. 2024 Oct;16(10):2376-2401.
doi: 10.1038/s44321-024-00137-8. Epub 2024 Sep 16.

7D, a small molecule inhibits dengue infection by increasing interferons and neutralizing-antibodies via CXCL4:CXCR3:p38:IRF3 and Sirt1:STAT3 axes respectively

Affiliations

7D, a small molecule inhibits dengue infection by increasing interferons and neutralizing-antibodies via CXCL4:CXCR3:p38:IRF3 and Sirt1:STAT3 axes respectively

Kishan Kumar Gaur et al. EMBO Mol Med. 2024 Oct.

Abstract

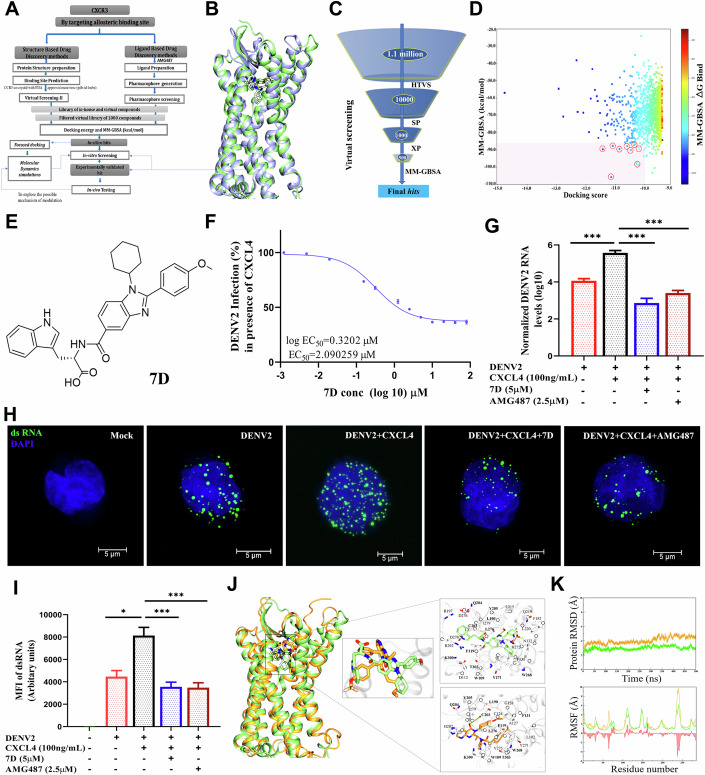
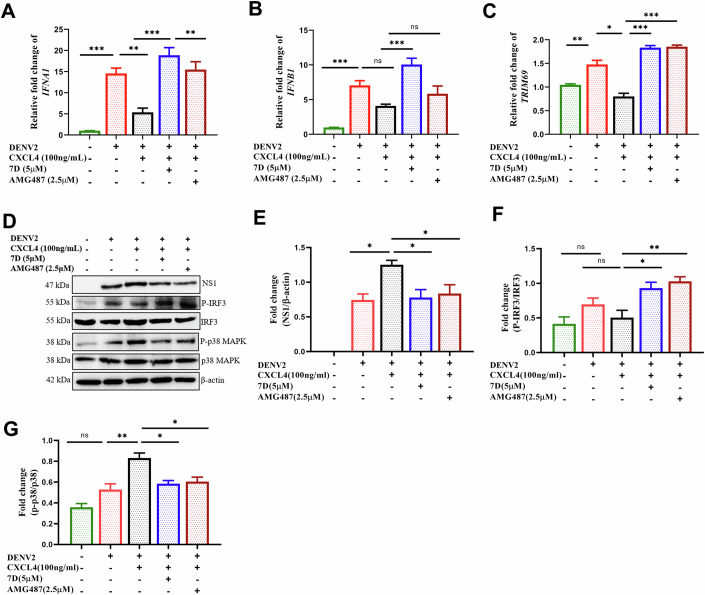
There are a limited number of effective vaccines against dengue virus (DENV) and significant efforts are being made to develop potent anti-virals. Previously, we described that platelet-chemokine CXCL4 negatively regulates interferon (IFN)-α/β synthesis and promotes DENV2 replication. An antagonist to CXCR3 (CXCL4 receptor) reversed it and inhibited viral replication. In a concurrent search, we identified CXCR3-antagonist from our compound library, namely 7D, which inhibited all serotypes of DENV in vitro. With a half-life of ~2.85 h in plasma and no significant toxicity, 7D supplementation (8 mg/kg-body-weight) to DENV2-infected IFNα/β/γR-/-AG129 or wild-type C57BL6 mice increased synthesis of IFN-α/β and IFN-λ, and rescued disease symptoms like thrombocytopenia, leukopenia and vascular-leakage, with improved survival. 7D, having the property to inhibit Sirt-1 deacetylase, promoted acetylation and phosphorylation of STAT3, which in-turn increased plasmablast proliferation, germinal-center maturation and synthesis of neutralizing-antibodies against DENV2 in mice. A STAT3-inhibitor successfully inhibited these effects of 7D. Together, these observations identify compound 7D as a stimulator of IFN-α/β/λ synthesis via CXCL4:CXCR3:p38:IRF3 signaling, and a booster for neutralizing-antibody generation by promoting STAT3-acetylation in plasmablasts, capable of protecting dengue infection.

Keywords: Antibodies; CXCL4; CXCR3-antagonist; Dengue; Interferons.


Conflict of interest statement

The authors declare no competing interests.

Figures

Figure 1
Figure 1. Screening CXCR3 antagonists and testing their anti-viral effects in vitro.
(AE) Screening CXCR3 antagonists. (A) Computational pipeline to identify CXCR3 antagonists. (B) Superimposed structures docked state of CXCR3 (green)-compound “7D” and crystal CCR5 (blue)- maraviroc (MRV). 7D and MRV are shown in licorice representation and colored in atom-wise C: purple/green, N: blue, O: red and F: Pink. (C) In silico virtual screening. High throughput virtual screening (HTVS)>Standard-precision (SP) docking>Extra-precision (XP) docking> Molecular mechanics with generalized born and surface area solvation (MM-GBSA). (D) Binding free energies of molecules vs docking energies. 13 hit-molecules (dot represents a molecule) were circled in red. (E) Molecular structure of 7D. (FI) Testing anti-viral effect of 7D. (F) U937-DC-SIGN cells were infected with MOI ~ 1 of DENV2 (strain P23085 INDI-60) in presence CXCL4 (100 ng/ml) for 24 h, and viral genome was quantified using qRT-PCR. The EC50 value of 7D was calculated from the dose-response curve from independent experiments, n = 3. (G) DENV2 genome were measured using qRT-PCR from the above experiment, n = 3 independent experiments, one-way ANOVA and Bonferroni’s post-test were used (P values: 0.001; 0.001; 0.001). (H) Viral dsRNA (green) was measured using microscopy. (I) Data are the mean fluorescence intensity (MFI), n = 3 independent experiments, (40 cells per group), Kruskal–Wallis test was used (P values: 0.03; 0.0008; 0.0006). (J, K) In silico binding of 7D or AMG487 with CXCR3. (J) Superimposed docking states of CXCR3-7D (green) and docked state of CXCR3-AMG487 (yellow). The inset shows the binding mode of 7D and AMG487. (K) Dynamical characteristics of systems were elucidated through MD simulations. Root-mean square deviation (RMSD) evolution through the course of 500 ns. Ligand RMSD of docked pose of CXCR3-7D (green) and docked pose of CXCR3-AMG487 (yellow). The Cɑ atomic fluctuation observed in all systems CXCR3-7D and CXCR3-AMG487 are represented by RMSF. Data information: (F, G, I) Data are mean ± SEM, *P < 0.05, ***P < 0.001. Source data are available online for this figure.
Figure 2
Figure 2. 7D inhibits viral replication in monocytes by inhibiting CXCR3 receptor.
(AE) 7D inhibits viral replication in CXCR3+/+ monocytes but not in CXCR3−/−. (A) Monocytes collected from peripheral blood of WT C57BL/6 (CXCR3+/+) or CXCR3−/− mice were infected with MOI ~1 DENV2 (EU081177.1 strain) in presence of CXCL4 (100 ng/ml) and AMG487 (2.5 µM) or 7D (5 µM). (B, C) After 24 h, cells were processed for NS1 staining using microscopy and data are presented as MFI, n = 3 independent experiments, (P values: 0.0001; 0.0001; 0.0001). (D, E) DENV2 genome was quantified from above experiment using qRT-PCR. n = 3 independent experiments, (P values: 0.01; 0.0006; 0.005). (FK) (FG) Western blot analysis was performed for dengue NS1, P-p38, normalized to β-actin. (HK) Densitometry data of the above blots, n = 3 independent experiments, (P values: H: 0.001; 0.01; 0.005; 0.01, I: 0.0001, J: 0.03; 0.003; 0.0005, K: 0.002). Data information: (BE, HK), one-way ANOVA and Bonferroni’s post-test were used. Data are mean ± SEM, *P < 0.05, **P < 0.01, ***P < 0.001. ****P < 0.0001, ns non-significant. Source data are available online for this figure.
Figure 3
Figure 3. Effect of 7D on interferon synthesis in vitro.
(AC) IFNA1, IFNB1 and TRIM69 genes were measured using qRT-PCR from cell pellets from the above experiments Fig. 1G–I, n = 3 independent experiments, (P values: A: 0.0002; 0.003; 0.0002; 0.0016, B: 0.0006; 0.0007, C: 0.002; 0.03; 0.0002; 0.0004). (DG) Cell pellets were processed for western blot analysis of DENV NS1, P-IRF3 and P-p38, normalized to β-actin. (EG) Densitometry of the above blots, n = 3 independent experiments, (P values: E: 0.01; 0.02; 0.02, F: 0.03; 0.009, G: 0.002; 0.01, 0.01). Data information: (AC, EG), one-way ANOVA and Bonferroni’s post-test were used. Data are mean ± SEM, *P < 0.05, **P < 0.01, ***P < 0.001, ns non-significant. Source data are available online for this figure.
Figure 4
Figure 4. 7D improves dengue disease pathology and mice survivability alongside increases IFN synthesis in AG129 mice.
(A) Schematic representation of mice experiment. AG129 mice were intraperitonially (i.p.) infected with 105 FFU mouse-adapted DENV2 virus (P8- P23085 INDI-60) or incomplete L15 media as mock. 7D (8 mg/kg body weight) was administered (i.p.) till 4 days post-infection (DPI) and other half were injected with vehicle (PBS + 10%Tween 80) and euthanized at 6 DPI for following assays. (B) In a similar experiment, mice were observed till 15 DPI to obtain survival curves using the Kaplan–Meier method. The curve comparison analysis was performed between the DENV2 (n = 12) and DENV2 + 7D (n = 14). Log-rank (Mantle Cox) test was used for statistical analysis (P value: 0.03). (C) Change in the body weight was recorded till 15 DPI, n = 7 vehicle, n = 8 mice per group, two-way ANOVA was used for data analysis, (P values: 0.009; 0.0001; 0.0001). (D) Plasma CXCL4 levels from above mice was measured using ELISA at 6 DPI, n = 5 vehicle, n = 8 mice per group, one-way ANOVA and Kruskal–Wallis test were used, (P value: 0.005). (E, F) DENV2 genome was quantified by qRT-PCR in (E) liver and (F) spleen tissues, respectively, n = 6 vehicle, n = 8 mice per group, one-way ANOVA and Bonferroni’s post-test were used, (P values: E: 0.001; 0.004, F: 0.001; 0.005). (GM) (G) Platelet, (H) monocytes, (I) neutrophil and (J) platelet-leukocyte aggregates were measured from peripheral blood of mice from above experiment using flow cytometry, n = 5 vehicle, n = 8 mice per group, one-way ANOVA and (G, H: Kruskal–Wallis test) and (I, J: Bonferroni’s post-test) were used, (P values: G: 0.0005; 0.03, H: 0.003; 0.03, J: 0.0001; 0.005). Gating strategy is mentioned in Appendix Fig. S4A. Plasma levels of (K) IL6, (L) TNFα and (M) IL1β were measured using CBA assay, n = 3 vehicle, n = 6 mice per group, Mann–Whitney U test was used, (P values: K: 0.02; L: 0.03; M: 0.004). (N, O) Vascular leakage in mice blood vessels. (N) Image of Evan’s blue dye extravasation from the veins in abdominal region of DENV2-infected mice. (O) Quantification of Evan’s blue dye in different tissues, n = 5 vehicle, n = 5 for DENV2 and, n = 6 for DENV2 + 7D, two-way ANOVA was used, (P values: 0.02; 0.03; 0.04). (PR) Plasma (P) IFNα, (Q) IFNβ, n = 4 vehicle, n = 8 mice per group, and (R) IFNγ levels, n = 5 vehicle, n = 6 mice per group, were measured using ELISA, one-way ANOVA and Bonferroni’s post-test were used, (P values: P: 0.006; 0.006; Q: 0.01; R: 0.03). Data information: (CJ, OR) Data are mean ± SEM, and (KM) median ± IQR, *P < 0.05, **P < 0.01, ***P < 0.001, ns non-significant. Source data are available online for this figure.
Figure 5
Figure 5. 7D treatment enhances DENV2-specific antibodies in infected mice.
(AD) DENV2-specific antibodies (A) IgM at 3 DPI, and (B) IgG at 6 DPI were measured in mice plasma from the above experiments (Fig. 4A) using ELISA. A: n = 3 vehicle, n = 5 mice per group, one-way ANOVA and Bonferroni’s post-test, B: n = 4 vehicle, n = 8 DENV2, n = 9 DENV2 + 7D, Mann–Whitney U test was used, (P values: A: 0.001; 0.03; B: 0.01). (C) FRNT50 curves of neutralization activity of mice serum on DENV2 propagation in Vero cells, n = 3 vehicle, n = 10 mice per group. (D) Graph of the above values, n = 10 mice per group, Mann–Whitney U test was used (P value: 0.02). Sera dilution assay is mentioned in Appendix Fig. S5A,B. (E) Increased plasma cells (CD138+veB220lo/-ve CD19+ve) percentage in 7D-treated mice spleen was measured using flow cytometry, n = 6 vehicle, n = 9 mice group, Kruskal–Wallis test is used (P value: 0.02). (F, G) Spleenocytes from the above mice were used to quantitate DENV2-specific antibody secreting cells using ELISPOT assay, (F) representative image and (G) graph of the above values, n = 5 vehicle, n = 10 mice per group, one-way ANOVA and Bonferroni’s post-test were used (P values: 0.0001; 0.04). (HJ) Intracellular levels of (H, I) Acetylated (Ac)-STAT3 and (H, J) phosphorylated (P)-STAT3 in CD138+ve cells was assessed by flow cytometry, n = 6 vehicle, n = 8 mice per group, one-way ANOVA and Bonferroni’s post-test were used (P values: H: 0.0009; I: 0.001; 0.005; J: 0.001; 0.001). Gating strategy is mentioned in Appendix Fig. S4D. (KM) Western blot analysis of (K, L) Ac-STAT3 and (K, M) P-STAT3 from the spleenocytes normalized to β-actin. Densitometry of the above blots, n = 6 mice per group, one-way ANOVA and Bonferroni’s post-test were used (P values: L: 0.001; M: 0.001). (N, O) Germinal center in spleen. (N) Immunofluorescent images of GL7-expressing follicles in spleen sections, GL7 (red) and DAPI (blue) staining. (O) Increased GL7-expressing follicles in 7D-treated mice, n = 8 mice per group, one-way ANOVA and Bonferroni’s post-test were used (P values: 0.0001; 0.0002). Data information: (AC, E, GJ, L, M, O) Data are mean ± SEM, and (D) median ± IQR, *P < 0.05, **P < 0.01, ***P < 0.001, ****P < 0.0001, ns non-significant. Data from similar experiment in WT mice is described in Fig. EV4. Source data are available online for this figure.
Figure 6
Figure 6. 7D treatment reduces DENV2 load by enhancing neutralizing antibodies in CXCR3−/− and WT mice.
As mentioned in the above Fig. 4A, a similar experiment was performed in CXCR3−/− and WT C57BL/6 mice at 6 DPI. (A, B) Spleen was isolated and processed for measuring dengue viral genome copies were quantified in (A) CXCR3−/−, n = 5 vehicle, n = 7 mice per group, one-way ANOVA and Kruskal–Wallis test, (P values: 0.0002; 0.03), and (B) WT, n = 6 vehicle, n = 7 mice per group, one-way ANOVA and Bonferroni’s post-test, (P values: 0.004; 0.04) using qRT-PCR. (C, D) IFNα levels were measured in plasma of these mice (C) CXCR3−/−, n = 5 vehicle, n = 7 mice per group, and (D) WT, n = 6 vehicle, n = 9 mice per group, one-way ANOVA and Bonferroni’s post-test were used for both cases, (P values: C: 0.0003, D: 0.01). (E, F) DENV2-specific IgG levels were measured in mice plasma of (E) CXCR3−/−, n = 5 vehicle, n = 7 mice per group, and (F) WT, n = 5 vehicle, n = 6 mice per group, using ELISA. One-way ANOVA and Bonferroni’s post-test were used for both cases, (P values: E: 0.003; 0.0013, F: 0.001). (GJ) FRNT50 curves and graph of neutralization activity of mice plasma was measured in (G, H) CXCR3−/−, n = 3 vehicle, n = 7 mice per group, and (I, J) WT, n = 6 vehicle, n = 7 mice per group. Mann–Whitney U test was used for analysis for both cases, (P value: 0.003). Sera dilution assay is mentioned in Appendix Fig. S5. Data information: (AF, G, I) Data are mean ± SEM, and (H, J) median ± IQR, *P < 0.05, **P < 0.01, ns non-significant. Source data are available online for this figure.
Figure 7
Figure 7. Schematic describes the CXCL4-mediated activation of CXCR3:p38:IRF3 signaling, in turn suppression of IRF3 and IFNα/β/λ in monocytes/macrophages.
Conversely, 7D supplementation reverses the above signaling and improves IFNα/β/λ synthesis. Besides, 7D increases acetylation and phosphorylation of STAT3, in turn promotes plasmablast proliferation and IgG synthesis via suppression of deacetylase activity of Sirt-1.
Figure EV1
Figure EV1. In silico drug design and viral replication data related to main Fig. 1.
(A) Superimposed structures of crystal CCR5 (blue) and model of CXCR3 (green). (B) Ramachandran plot of CXCR3 homology model (C) CXCR3-7D (green) and CXCR3-AMG487 (yellow) binding site interaction energies of residues. Related data of Fig. 1J,K. (D) U937-DC-SIGN cells were infected with MOI ~ 1 of DENV2 (P23085 INDI-60) in presence CXCL4 (100 ng/ml) and various concentrations of AMG487. The EC50 value of AMG487 was calculated from the dose-response curve from drug effects on viral genome (measured by qRT-PCR) from independent experiments, n = 3. (E) Cell viability was measured after treatment with all 13 compounds from in silico hits. U937-DC-SIGN cells were incubated with the compounds for 48 h and cell viability were measured using MTT assay, n = 3 independent experiments, two-way ANOVA was used (P values: 0.004; 0.0004; 0.01; 0.0002; 0.005; 0.005; 0.0004; 0.02; 0.0019; 0.01; 0.0001; 0.01). (F) Effects of 13 compounds (2.5 µM) on DENV2 replication in U937-DC-SIGN cells was measured in presence of CXCL4 (100 ng/ml). Viral genome was quantified using qRT-PCR from independent experiments, n = 3, one-way ANOVA and Kruskal–Wallis test was used (P values: 0.008; 0.003; 0.0014; 0.02). (GI) U937-DC-SIGN cells were infected with MOI ~ 1 of (G) DENV1 (H) DENV3 and (I) DENV4 (strain H241) in presence of CXCL4 (100 ng/ml) and 7D (5 µM) and viral genome was quantified using qRT-PCR from independent experiments, n = 3, one-way ANOVA and Bonferroni’s post-test were used (P values: G: 0.001; 0.0014; 0.0008, H: 0.001; 0.01; 0.02, I: 0.01; 0.003). (JL) Western blot was performed for (J) NS1, actyl-p53, p53 and β-actin in lysate from CXCR3-/- monocytes from Fig. 2G. Densitometry of (K) actyl-p53 and (L) NS1 blots, n = 3 independent experiments, one-way ANOVA and Bonferroni’s post-test were used (P value: K: 0.01, L: 0.0001). Data information: (DI, K, L) Data are mean ± SEM, *P < 0.05, **P < 0.01, ***P < 0.001, ****P < 0.0001, ns=non-significant.
Figure EV2
Figure EV2. Effects of 7D on DENV2 replication on megakaryocytes in vitro.
(A, B) Megakaryocytes isolated from mice bone marrow, and infected with DENV2 (MOI ~ 1) for 24 h with and without 7D. Culture supernatant was used for measuring (A) CXCL4 levels using ELISA, and (B) cell pallet was used for detecting viral genome using qRT PCR, n = 3 independent experiments for both (P values: A: 0.0002; 0.04, B: 0.0002; 0.008). (C, D) Similar experiment was performed in monocytes (as CXCL4 non-producing cells) isolated from whole blood of these mice. (C) CXCL4 and (D) DENV2 genome were detected, n = 3 independent experiments for both assays (P value: 0.0002). A similar experiment was performed in (E, F) human MEG-01 cell line (CXCL4 producing cells), n = 3 independent experiments (P values: E: 0.0008; 0.01, F: 0.006) and (G, H) U937-DC-SIGN cell line (CXCL4 non-producing cells), n = 3 independent experiments for above assays. One-way ANOVA and Bonferroni’s post-test were used for data analysis. Data information: (AE, G) One-way ANOVA and Bonferroni’s post-test were used for data analysis. Data are mean ± SEM. (F, H) Student’s t-test was used. Data are mean ± SEM. *P < 0.05, **P < 0.01, ***P < 0.001, ns=non-significant.
Figure EV3
Figure EV3. Effects of 7D on DENV2 replication in Sirt1−/− MEFs in vitro.
(A) Sirtuin-1 (Sirt1) expression in Sirt1−/− and WT mouse embryonic fibroblasts (MEFs) in western blot assay. Densitometry analysis independent experiments n = 3, Student’s t test was used (P value: 0.005). Above cells were infected with DENV2 and treated with 7D as mentioned for U937-DC-SIGN in Fig. 1F. After experiment, (B) WT and (C) Sirt1−/− cells were used for western blot analysis for NS1, Ac-P53 and P-IRF3. (DI) Densitometry data from, n = 3 independent experiments, one-way ANOVA and Bonferroni’s post-test were used (P values: D: 0.04; 0.007; 0.01, E: 0.001, F: 0.009; 0.0002; 0.009, G: 0.005; 0.0008; 0.0006, I: 0.006; 0.002; 0.007). (J, K) Viral genome was quantified in WT and Sirt1−/− MEFs pellet using qRT-PCR, n = 3 independent experiments, one-way ANOVA and Bonferroni’s post-test were used (P values: J: 0.0013; 0.0007; 0.0005; 0.006, K: 0.004; 0.0004; 0.002; 0.003). (L, M) IFNα level was measured using ELISA from cell supernatant of above experiments, n = 3 independent experiments, one-way ANOVA and Bonferroni’s post-test were used (P values: L: 0.003; 0.01; 0.0001; 0.0001, M: 0.0001; 0.0002; 0.0001; 0.0001). Data information: (A, DM) Data are mean ± SEM, *P < 0.05, **P < 0.01, ***P < 0.001, ****P < 0.0001, ns=non-significant.
Figure EV4
Figure EV4. Effects of 7D on DENV2 replication in BMDMs of AG129 mice.
DENV2 infection experiment was performed in bone marrow derived macrophages (BMDMs), isolated from AG129 mice, in presence of 7D. A blocking antibody to IFNλ2/3 (5 µg/ml, standardization of working concentration is mentioned in Fig. EV4L below) was used to investigate the effects of type-III IFN. (A) Viral genome was quantified in cell pellets using qRT-PCR, n = 3 independent experiments (P values: 0.0011; 0.0002; 0.03; 0.0014). (BE) Relative gene expressions of interferon-stimulated genes (ISGs), (B) Oas1a, (C) Isg15, (D) Trim69, and (E) Mx1 were measured from above experiments, n = 3 independent experiments, (P values: B: 0.0001; 0.0013; 0.0001; 0.0001, C: 0.0001; 0.0001; 0.0012; 0.01; 0.0001, D: 0.0006; 0.01; 0.0008; 0.0001, E: 0.0001; 0.0001; 0.0014; 0.009; 0.0001). (F) IFN λ2/3 levels were measured in the supernatant of these cells using ELISA, n = 3 independent experiments, (P values: 0.004; 0.02; 0.002). (G, H) Relative gene expressions of ifnl2 and ifnl3 were quantified from the above cell pellets, n = 3 independent experiments, (P values: G: 0.001; 0.001; 0.008, H: 0.001; 0.003; 0.001). (IK) Western blot analysis for P-p38:p38 and P-IRF3:IRF3. (J, K) Densitometry data from, n = 3 independent experiments, (P values: J: 0.007; 0.003; 0.001, K: 0.0006; 0.0002; 0.0003). (L) Concentration-dependent effect of blocking antibody against type-III IFN was tested on viral replication. DENV2 mRNA was quantified from pellets of DENV2-infected U937-DC-SIGN cells in presence of increasing concentration (1, 5 and 10 µg/ml) of blocking antibody against IFN-λ2/3 Ab, n = 3 independent experiments, (P values: 0.001; 0.002; 0.0002). One-way ANOVA and Bonferroni’s post-test were used for above analysis. Data information: (AH, JL) One-way ANOVA and Bonferroni’s post-test were used. Data are mean ± SEM, *P < 0.05, **P < 0.01, ***P < 0.001, ****P < 0.0001 and ns=non-significant.
Figure EV5
Figure EV5. Effect of STAT3-inhibitor on 7D-mediated antibody generation in DENV2-infected AG129 mice.
As mentioned in the Fig. 4A, a similar experiment was performed in AG129 mice treated with 7D and STAT3-inhibitor Stattic (10 mg/kg/body weight, referred concentration from vendor’s manual). (A, B) DENV2 viral RNA was quantified in liver and spleen respectively using qRT-PCR, n = 8 mice per group, (P values: A: 0.0001; 0.0001; 0.003, B: 0.0001; 0.0003; 0.04). (C, D) Anti-dengue IgG was measured from the serum of mice using ELISA, n = 8, (P values: 0.0001; 0.0005; 0.003). (EG) Ac-STAT3 and P-STAT3 were measured in spleenocytes by western blot and normalized with total STAT3. Densitometry of the above blots, n = 4 vehicle, n = 6 mice per group (P values: F: 0.0008; 0.0001, G: 0.01). One-way ANOVA and Bonferroni’s post-test were used for all above analysis. Data information: (AD, F, G) One-way ANOVA and Bonferroni’s post-test were used. Data are mean ± SEM, *P < 0.05, **P < 0.01, ***P < 0.001, ****P < 0.0001, ns=non-significant.
Figure EV6
Figure EV6. Effects of AMG487 on DENV2 infection in AG129 mice.
AG129 mice were infected with DENV2 and treated with AMG487 (8 mg/kg body weight, referred concentration from our previous work). (A) Platelets and (B) WBCs were counted in whole blood using hematology analyzer. (C) Platelet-leukocyte aggregates, (D) neutrophils and (E) monocytes percentage were measured using flow cytometry, n = 5 vehicle, n = 7 mice per group, one-way ANOVA and Bonferroni’s post-test were used for above analysis, (P values: A: 0.0015; B: 0.0003; 0.01; C: 0.001; 0.0005; E: 0.001; 0.03). (F, G) DENV2 genome was quantified by qRT-PCR in (F) liver and (G) spleen, n = 6 mice per group and Mann–Whitney U test was used, (P value: 0.01). (H, I) IgG against DENV2 antigen was measured in mice plasma, (n = 6 per group and one-way ANOVA and Kruskal–Wallis test was used). Sera dilution factor 25 at OD450nm. Data information: (AE, I) Data are mean ± SEM, and (F, G) data are median ± IQR, *P < 0.05, **P < 0.01, ***P < 0.001, ns=non-significant.

References

    1. Baron S, Dianzani F (1994) The interferons: a biological system with therapeutic potential in viral infections. Antiviral Res 24:97–110 - PubMed
    1. Bhatt S, Gething PW, Brady OJ, Messina JP, Farlow AW, Moyes CL, Drake JM, Brownstein JS, Hoen AG, Sankoh O et al (2013) The global distribution and burden of dengue. Nature 496:504–507 - PMC - PubMed
    1. Brady OJ, Gething PW, Bhatt S, Messina JP, Brownstein JS, Hoen AG, Moyes CL, Farlow AW, Scott TW, Hay SI (2012) Refining the global spatial limits of dengue virus transmission by evidence-based consensus. PLoS Negl Trop Dis 6:e1760 - PMC - PubMed
    1. Case DA, Aktulga HM, Belfon K, Ben-Shalom IY, Berryman JT, Brozell SR, Cerutti DS, Cheatham TE III, Cisneros GA, Cruzeiro VWD et al (2022) AMBER 22 reference manual. University of California, San Francisco, CA
    1. Cucunawangsih, Lugito NPH, Kurniawan A (2015) Immunoglobulin G (IgG) to IgM ratio in secondary adult dengue infection using samples from early days of symptoms onset. BMC Infect Dis 15:276–281 - PMC - PubMed

MeSH terms