. 2024 Oct;16(10):2349-2375.
doi: 10.1038/s44321-024-00127-w. Epub 2024 Sep 16.

Infection length and host environment influence on Plasmodium falciparum dry season reservoir

Affiliations

Infection length and host environment influence on Plasmodium falciparum dry season reservoir

Carolina M Andrade et al. EMBO Mol Med. 2024 Oct.

Abstract

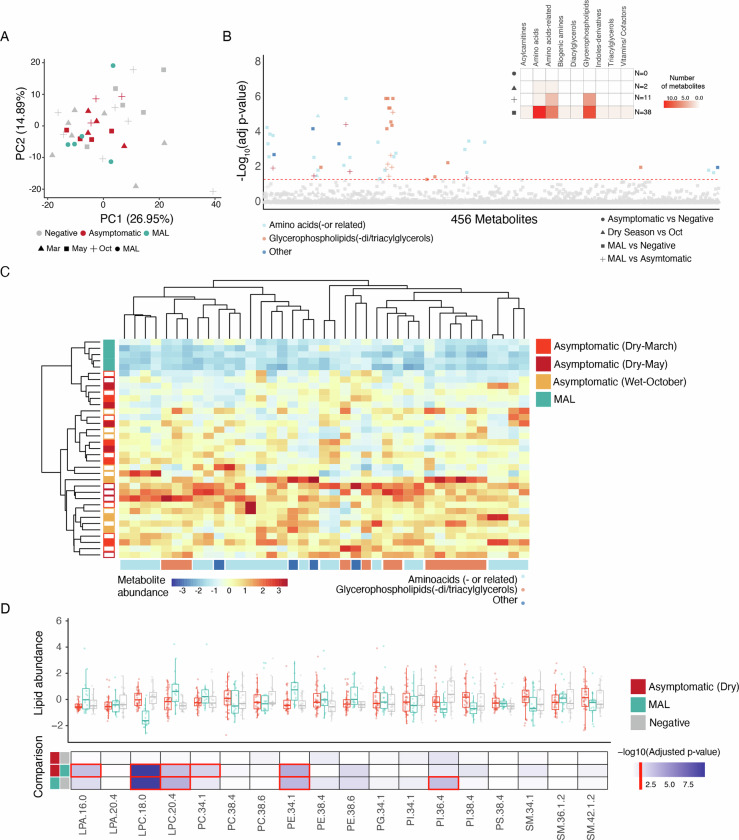
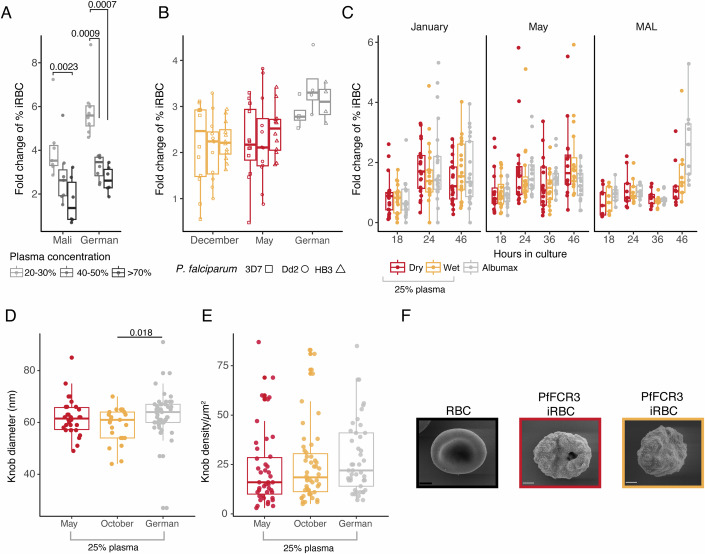
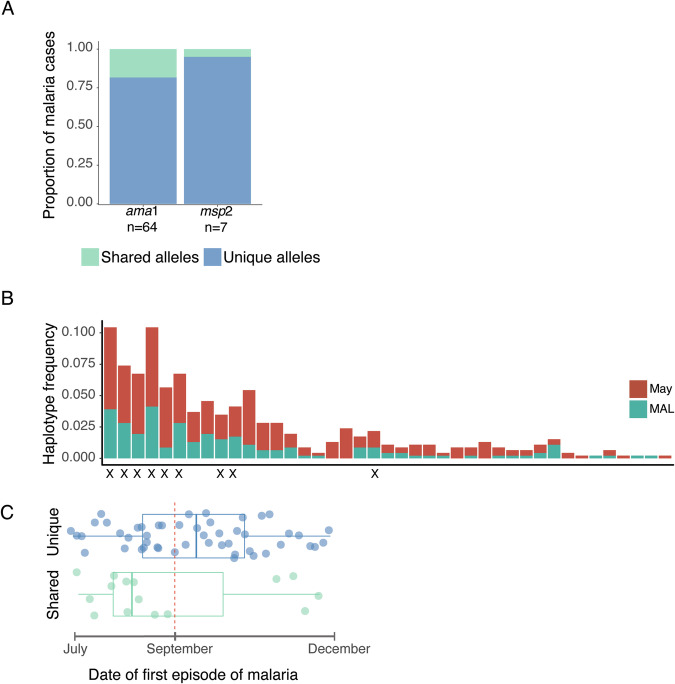
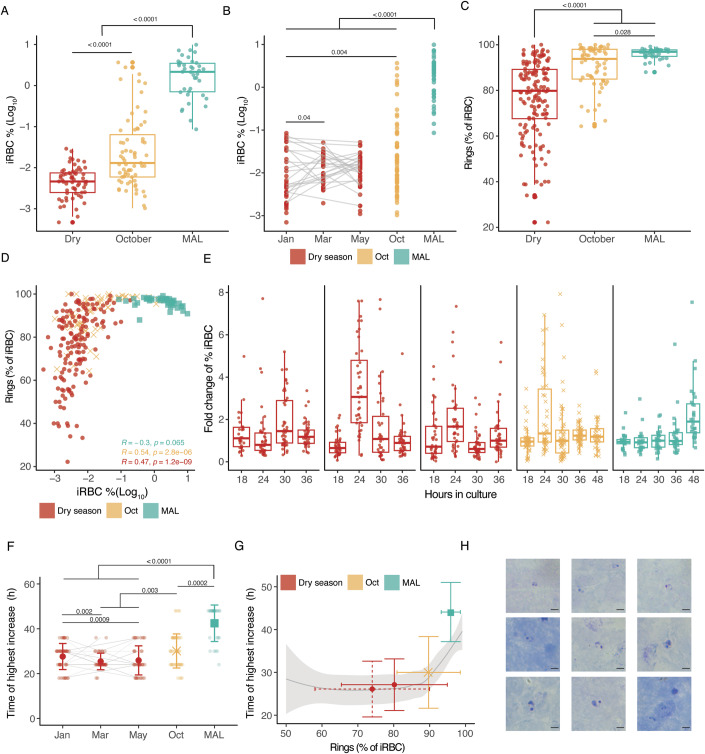
Persistence of malaria parasites in asymptomatic hosts is crucial in areas of seasonally-interrupted transmission, where P. falciparum bridges wet seasons months apart. During the dry season, infected erythrocytes exhibit extended circulation with reduced cytoadherence, increasing the risk of splenic clearance of infected cells and hindering parasitaemia increase. However, what determines parasite persistence for long periods of time remains unknown. Here, we investigated whether seasonality affects plasma composition so that P. falciparum can detect and adjust to changing serological cues; or if alternatively, parasite infection length dictates clinical presentation and persistency. Data from Malian children exposed to alternating ~6-month wet and dry seasons show that plasma composition is unrelated to time of year in non-infected children, and that carrying P. falciparum only minimally affects plasma constitution in asymptomatic hosts. Parasites persisting in the blood of asymptomatic children from the dry into the ensuing wet season rarely if ever appeared to cause malaria in their hosts as seasons changed. In vitro culture in the presence of plasma collected in the dry or the wet seasons did not affect parasite development, replication or host-cell remodelling. The absence of a parasite-encoded sensing mechanism was further supported by the observation of similar features in P. falciparum persisting asymptomatically in the dry season and parasites in age- and sex-matched asymptomatic children in the wet season. Conversely, we show that P. falciparum clones transmitted early in the wet season had lower chance of surviving until the end of the following dry season, contrasting with a higher likelihood of survival of clones transmitted towards the end of the wet season, allowing for the re-initiation of transmission. We propose that the decreased virulence observed in persisting parasites during the dry season is not due to the parasites sensing ability, nor is it linked to a decreased capacity for parasite replication but rather a consequence decreased cytoadhesion associated with infection length.

Keywords: Asymptomatic; Dry Season; Infection Length; Malaria; Sensing.


Conflict of interest statement

The authors declare no competing interests.

Figures

Figure 1
Figure 1. Seasonal malaria and study design.
Top panel shows a histogram of malaria cases in a cohort of ~600 individuals aged 3 months to 45 years, binned to 2-day intervals for 15 months in Kalifabougou, Mali. Malaria cases were defined by axillary temperature ≥37.5 °C, ≥2500 asexual parasites/μl of blood and no other apparent cause of fever. The bottom panel shows a cross-sectional sampling of plasma, DBSs, and fresh RBC pellets used to investigate (i) seasonal variations in plasma metabolites, lipids and proteins; (ii) the presence of clones persisting through the dry season in subsequent malaria episodes of the same individuals in the ensuing wet season; (iii) the in vitro response of parasites freshly collected from asymptomatic carriers in the dry season and clinical malaria cases in the wet season to supplementation of pooled plasmas from the dry and the wet seasons; and (iv) the approximate time of transmission, in the preceding wet season, of clones persisting until the end of the dry season. Negative samples for P. falciparum are shown in grey, P. falciparum positive samples of asymptomatic carriers are shown in yellow in October and during the wet season, light red in March and dark red in May during the dry season; and clinical cases obtained through passive surveillance are shown in aqua. The number of samples used for each analysis is specified within the coloured boxes or the representative RBC drawings. Source data are available online for this figure.
Figure 2
Figure 2. Seasonality and asymptomatic infections promote minimal differences in plasma metabolites proteins and lipids.
(A) Principal component analysis of 456 metabolites in the plasma of uninfected individuals (negative, n = 19) obtained in March (n = 7), May (n = 5) and October (n = 7), P. falciparum asymptomatic carriers (n = 11) obtained in March (n = 4), May (n = 4) and October (n = 3), and clinical cases during the wet season (MAL) (n = 5). (B) Pairwise comparison of plasma metabolites grouped into amino acids (red), glycerophospholipids (orange) and other metabolites (blue), between different infection status or time of the year. Adjusted p (FDR), negative-log-transformed (y-axis) from t-test performed on each metabolite abundance and between sample groups (dot shape); x-axis sorted by group category and adjusted p value. The panel box summarises the main metabolite type and the number of significantly different metabolites between the sample group comparison (Student's t-test). The Red dashed line shows the threshold of significance. (C) Hierarchical clustering of 39 significantly different metabolite abundances between-group comparisons. Hierarchical clustering applied to metabolites and samples is coloured by infection status or time of the year. Metabolites are grouped by categories as in (B). (D) Lipidomic analysis of 73 samples from 53 individuals, of whom 19 had paired samples collected in March (n = 19) and May (n = 19) in the dry season, 15 had clinical malaria (n = 15), and 20 were negative (n = 20) at the end of the dry season. Significantly different metabolites across all sample comparisons are grouped by lipid type class and timepoint or infectious status (Boxplots indicate median ± IQR with all individual values plotted, and pairwise Student's t-test, and adjusted p values are shown). Heatmap of adjusted p (FDR), negative-log-transformed from ANOVA and Tukey multiple comparison test performed on the abundance of each lipid species and between sample groups. Red boxes highlight significant metabolites found between the group comparisons, and the red line in the scale shows the threshold of significance.
Figure 3
Figure 3. Dry and wet season plasma have a similar effect on P. falciparum in vitro.
(A) P. falciparum 3D7 parasitaemia increased after 48 h in vitro culture in low glucose (5.5 mM) RPMI supplemented with 20–30%, 40–50% or > 70% plasma from uninfected Malian (n = 7) or German (n = 8) donors. (B) Parasitaemia fold change of lab-adapted 3D7, Dd2 and HB3 P. falciparum strains, after 60 h in vitro culture supplemented with 25% plasma from Malian (n = 12) or German (n = 4) donors. (C) Parasitaemia fold change at 18, 24, 36, and/or 46 h after culture of parasites collected from children at different times during the dry season (Jan, n = 21), (May, n = 16) or at the first malaria case during the transmission season (MAL, n = 9), supplemented with dry or wet season antibody-depleted plasma. (D) Knob diameter measured by transmission electron microscopy and (E) Knob density per μm2 of RBC measured by scanning electron microscopy of P. falciparum FCR3 parasites (May, n = 30; Oct, n = 24; German, n = 50) after 48 h in vitro culture supplemented with dry or wet season antibody-depleted plasma pooled from 27 Malian, or from four German donors. All boxplots indicate median ± IQR with all individual values plotted. Fold changes are defined as %iRBC t(n)/%iRBC t(n − 1). Kruskal–Wallis and Wilcoxon pairwise test. (F) Representative example of uninfected RBC (left), and P. falciparum FCR3 iRBCs after 48 h in vitro culture supplemented with dry (middle) or wet (right) season antibody-depleted plasma. Scale bar, 1 μm. Source data are available online for this figure.
Figure 4
Figure 4. Clinical malaria episodes are caused by newly transmitted P. falciparum parasites.
(A) Proportion of clinical malaria cases presenting only newly transmitted P. falciparum (unique alleles, blue), or presenting at least one allele persisting since the dry season (shared alleles, green), of children that carried P. falciparum asymptomatically in the preceding wet season. Alleles were defined by ama1 amplicon sequencing (n = 64) or msp2 capillary electrophoresis (n = 7). (B) Frequency of 41 ama1 alleles present at the end dry season (May), and during first clinical malaria (MAL) in paired individuals. Alleles shared between the two sampling times across the 64 children are marked with X. (C) Date of clinical malaria cases occurring in children presenting only newly transmitted P. falciparum alleles (blue, n = 49), or presenting at least one allele persisting since the dry season (green, n = 15). Chi-squared test, p = 0.08. Source data are available online for this figure.
Figure 5
Figure 5. iRBCs of asymptomatic carriers in the wet season share features with those of the dry season.
(A) Parasitaemia was detected by flow cytometry in asymptomatic individuals in the dry season (Dry, n = 108), asymptomatic individuals in transmission season (Oct, n = 67), and individuals presenting their first clinical malaria episode (MAL, n = 39) in the wet season. (Kruskal–Wallis and Wilcoxon pairwise test, p = 1.21e–9 between October and dry season). (B) Parasitaemia was measured by flow cytometry at three different timepoints during the dry season with lines indicating individuals with at least two paired timepoints (n = 80), with unpaired October (n = 67) and MAL (n = 39) (Kruskal–Wallis and Wilcoxon pairwise test). (C) Percentage of circulating ring-stage iRBCs detected by flow cytometry in asymptomatic individuals carrying P. falciparum in the dry (dry season, n = 108), or the wet (Oct, n = 67) season, and during first clinical malaria and in the wet season (MAL, n = 39). (Kruskal–Wallis and Wilcoxon pairwise test, p = 8.28e−11 between October and dry season). (D) Relation between percentage of circulating ring-stage and parasitaemia determined by flow cytometry in asymptomatic individuals carrying P. falciparum in the dry (dry season, n = 108), or the wet (Oct, n = 67) season, and during first clinical malaria in the wet season (MAL, n = 39). Pearson correlation (p value for Dry, October and MAL are 1.2e−9, 2.8e−6, 0.065, respectively). (E) Parasitaemia fold change at 16, 24, 30, 36 and 48 h after culture of parasites collected from children during the dry (Jan, n = 53), (Mar, n = 42) and (May, n = 41), and the wet (Oct, n = 54) season, and at the first clinical malaria episode in the wet season (MAL, n = 26). Fold changes are defined as %iRBC t(n)/%iRBC t(n − 1). All boxplots indicate median ± IQR with all individual values plotted. (F) Time of highest increase in parasitaemia detected during in vitro culture of P. falciparum parasites from children with at least two paired asymptomatic samples throughout the dry season (n = 38), and parasites from children carrying asymptomatic (Oct, n = 54) and symptomatic (MAL, n = 26) P. falciparum in the wet season. Dot corresponds to the average time of increase ± SD (Pairwise Fisher exact test between months and highest time of increase above or below 24 h, p values and significant levels are shown). (G) Relation between the average time of highest increase in vitro and proportions of ring-stage parasites collected from asymptomatic individuals in the beginning (Jan, red solid SD bars) and end (May, red dashed SD bar) of the dry season, during asymptomatic infections the wet season (Oct, blue SD bars), and during the first clinical malaria episode (MAL, aqua SD bars). The shaded curve indicates the Loess regression model with a 95% confidence interval. (H) Giemsa-stained thick blood films of P. falciparum parasites were collected directly from the arms of nine asymptomatic individuals carrying P. falciparum during the wet season (Oct). Young and late rings are visible in the top panels, and late rings to trophozoite stages are visible in the mid to bottom panels. Scale bar, 5 μm. Source data are available online for this figure.
Figure 6
Figure 6. Timing and duration of infection associated with dry season persistence.
(A) Retrospective P. falciparum PCR results determined every 2 weeks between January 2013 and July 2012 of 92 asymptomatic children found PCR positive (red) in May 2013 at the end of the dry season. PCR was performed until individuals became PCR negative (blue) for four consecutive timepoints, received malaria treatment (yellow), or until the end of the preceding dry season (May 2012). Each column represents a collection timepoint. The first column shows P. falciparum PCR result in May 2012, and the secnd whether treatment occurred (yellow) or not (grey), prior to the first timepoint in July 2012. (B) Clonal infection length in persistent (brick, n = 269) or cleared (grey, n = 575) P. falciparum clones, grouped into short (<49 d), intermediate (49–129 d) or long (>129 d), allowing up to two consecutively skipped timepoints within a series of positive for a particular clone. Venn diagram of ama1 sequences found in persisting and/or cleared clones by the end of the dry season. All boxplots indicate median ± IQR with all individual values plotted. (C) Infection length of clones from younger (6–9, n = 471) or older (10–13, n = 373) children. Wilcoxon rank-sum test (p = 0.036). (D) Proportion of persistent (brick) and cleared (grey) clones found throughout the year in younger (6–9, n = 471) or older (10–13, n = 373) children who were PCR positive in May 2013 (χ2 test, p = 0.0056). (E) Length of individual ama1 haplotypes (n = 186) present at the end of the dry season in May 2013 in children (n = 52) remaining PCR positive >8 timepoints (Poisson GLMM, p value = 5.27e–9). The histogram illustrates the frequency of clinical malaria in the full cohort of 595 individuals aged 1–45 during the 2012 wet season.
Figure EV1
Figure EV1. Plasma metabolites, lipids and proteins across seasons and clinical presentations.
(A) Principal component analysis (PCA) of 456 metabolites in the plasma of uninfected (Negative shown in circles) individuals (n = 19), obtained in March (n = 7), May (n = 5) and October (n = 7); P. falciparum asymptomatic carriers (Asymptomatic shown in triangles) (n = 11), obtained in March (n = 4), May (n = 4) and October (n = 3); and clinical cases during the wet season (MAL shown in squares) (n = 5) presenting the variance explained by the two first principal components between individuals based on their metabolite profiles and coloured by individual (left panel). Mean and standard deviation of the normalised metabolite abundance for each individual (n = 11 individuals and 35 samples) at the different timepoints included in the analysis (right panel). (B) A heatmap with hierarchical clustering showing the normalised and log2-transformed abundance of 456 metabolites (columns) of 35 plasma samples (rows) collected along the year, infection and clinical presentation status. Metabolites are listed in Dataset EV1. (C) Significantly different metabolites across all sample comparisons (n = 39) grouped by metabolite class and infectious status, including uninfected individuals (Negative), P. falciparum asymptomatic carriers (Asymptomatic) and clinical malaria cases (MAL). Boxplots indicate median ± IQR with all individual values plotted, pairwise Student's t-test and adjusted p values are shown. (D) Pathway enrichment analysis of the significant metabolites between clinical cases during the wet season and uninfected and P. falciparum asymptomatic carriers. Circles represent pathways with the colour scale and size adjusted to the pathway impact (x-axis) and number of hit metabolites, respectively. Statistical significance was determined with hypergeometric test for overrepresentation analysis, and impact calculated based on the relative centrality from pathway topology analysis with multiple testing correction. Significant pathways have an adjusted p > 1.3 (y-axis) and pathway impact >0 and are listed in Dataset EV3. (E) Principal component analysis (PCA) was performed on data from 73 samples and 20 lipid species, showing the variance explained by the two first principal components between individuals based on their lipid profiles. (F) A heatmap with hierarchical clustering showing protein abundance for each of the 146 proteins (columns) across 30 plasma samples (rows) collected along the year, infection and clinical presentation status. Proteins are listed in Dataset EV4. (G) Haemoglobin levels in the blood of study participants above 5 years old collected along the year, infection and clinical presentation status (n = 391 study participants). Boxplots indicate median ± IQR with all individual values plotted.
Figure EV2
Figure EV2. Plasma from the dry and wet seasons have a similar effect on P. falciparum lab-adapted strains in vitro.
(A) Parasitaemia fold change of lab-adapted 3D7, Dd2 and HB3 P. falciparum strains after 60 h in vitro culture supplemented with 25% plasma from Malian donors, split by infection status by rapid diagnostic test of plasma donors (RDT, n = 6, RDT+, n = 6). (B) Parasite development is measured as Sybr Green geometric mean in different P. falciparum lab-adapted strains cultured in vitro supplemented with December or May plasma from Malian donors (n = 12), measured at 36 h in culture (3D7) or 30 h in culture (Dd2 and HB3). (C) P. falciparum 2004 strain growth for over three 48 h cycles in vitro supplemented with 25% plasmas pooled from 12 Malian children in the beginning (December, n = 3) or end (May, n = 3) of the dry season, or from four German adults (n = 3). (D) Average fold change of iRBCs at 18, 24, 36 and 46 h after culture and across all plasma conditions for parasites obtained from the dry season (n = 37) or from clinical malaria cases (n = 9). Kruskal–Wallis and Wilcoxon pairwise test. Fold changes are defined as %iRBC t(n)/%iRBC t(n − 1). All boxplots indicate median ± IQR with all individual values plotted.
Figure EV3
Figure EV3. Clinical malaria episodes are mainly caused by newly transmitted P. falciparum parasites.
ama1 haplotypes in paired samples from 64 children collected at the end of the dry season (May) and during their first clinical malaria case in the ensuing wet season (MAL). Red squares highlight children with shared haplotypes in May and MAL. Circle size represents haplotype proportion within each timepoint.
Figure EV4
Figure EV4. Determinants of infection length and complexity of infection in dry-season persisting infections.
Infection length of all P. falciparum clones (allowing for two skips) found in 92 Malian children separated by (A). Sex and (B). haemoglobin type; (AA n = 71, AC n = 12, AS n = 9). Boxplots indicate median ± IQR with all values plotted corresponding to the individuals and timepoints. (C) Complexity of infection (COI) of 92 asymptomatic children found PCR In May 2013 at the end of the dry season, analysed retrospectively over the 12 timepoints in the preceding wet season from December 2012 until July 2012, and at the end of the preceding dry season (May 2012). (D) Infection length of P. falciparum clones allowing 0, 1, 2 or 3 skips (negative timepoints of a particular ama1 clone within a series of positive ones). Brick dots show persistent infections, and grey dots represent clones cleared before the end of the dry season (ANOVA and Tukey multiple comparison test). Boxplots indicate median ± IQR. (E) Haplotypes are ordered by clonal infection length. (F) Distribution of clones and their infection length. Brick lines show persistent infections, and grey lines represent clones cleared before the end of the dry season. (G) Kaplan–Meier analysis showing the probability of survival of P. falciparum clones (y-axis) over time, from the start of the wet season (July 2012) to the end of the dry season (May 2013) (x-axis) in individuals of 7–9 (aqua) and 10–13 (coral) years old, with the log-rank test used to determine statistical differences. (H) Summary of three generalised mixed-effect models used showing the Akaike Information Criteria and the log-likelihood for the selected model, GLMM Poisson (1), GLMM negative binomial model (2) and GLMM ZINB (3).
Figure EV5
Figure EV5. Distribution of infection length of P. falciparum clones using two genotyping approaches.
(A) Distribution of infection length in days of P. falciparum clones detected by msp2 genotyping (yellow) and ama1 genotyping methods (green), showing length with two skips of 346 and 582 clonal infections, respectively (x-axis). The Y-axis corresponds to the number of clones per genotyping method. (B) Infection length determined by msp2 genotyping of younger (5–8) or older (9–11) children (C) Infection length distribution using ama1 amplicon sequencing and 2 skips of individual clones across all individuals for the 12 timepoints spanning the transmission season (July to December, 2012).

References

    1. Akpogheneta OJ, Duah NO, Tetteh KKA, Dunyo S, Lanar DE, Pinder M, Conway DJ (2008) Duration of naturally acquired antibody responses to blood-stage Plasmodium falciparum is age dependent and antigen specific. Infect Immun 76:1748–1755 - PMC - PubMed
    1. Amaratunga C, Neal AT, Fairhurst RM (2014) Flow cytometry-based analysis of artemisinin-resistant Plasmodium falciparum in the ring-stage survival assay. Antimicrob Agents Chemother 58:4938–4940 - PMC - PubMed
    1. Andolina C, Ramjith J, Rek J, Lanke K, Okoth J, Grignard L, Arinaitwe E, Briggs J, Bailey J, Aydemir O et al (2023) Plasmodium falciparum gametocyte carriage in longitudinally monitored incident infections is associated with duration of infection and human host factors. Sci Rep. 13:7072 - PMC - PubMed
    1. Andrade CM, Fleckenstein H, Thomson-Luque R, Doumbo S, Lima NF, Anderson C, Hibbert J, Hopp CS, Tran TM, Li S et al (2020) Increased circulation time of Plasmodium falciparum underlies persistent asymptomatic infection in the dry season. Nat Med 26:1929–1940 - PubMed
    1. Ashley EA, White NJ (2014) The duration of Plasmodium falciparum infections. Malar J 13:500 - PMC - PubMed

LinkOut - more resources