Clinical Trial
. 2024 Nov;30(11):3223-3235.
doi: 10.1038/s41591-024-03249-3. Epub 2024 Sep 16.

Neoadjuvant nivolumab or nivolumab plus ipilimumab in early-stage triple-negative breast cancer: a phase 2 adaptive trial

Affiliations
Clinical Trial

Neoadjuvant nivolumab or nivolumab plus ipilimumab in early-stage triple-negative breast cancer: a phase 2 adaptive trial

Iris Nederlof et al. Nat Med. 2024 Nov.

Abstract

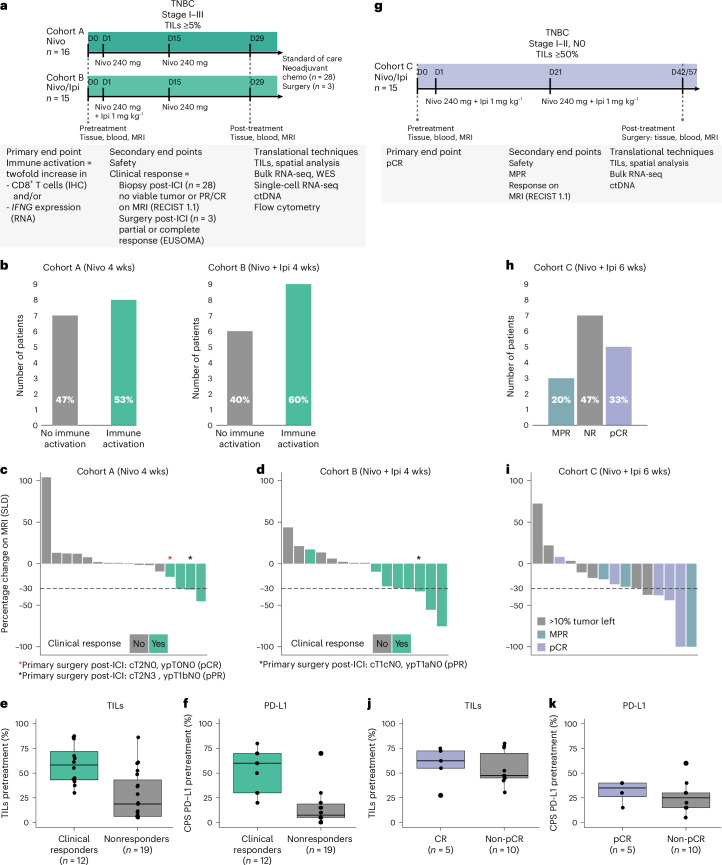
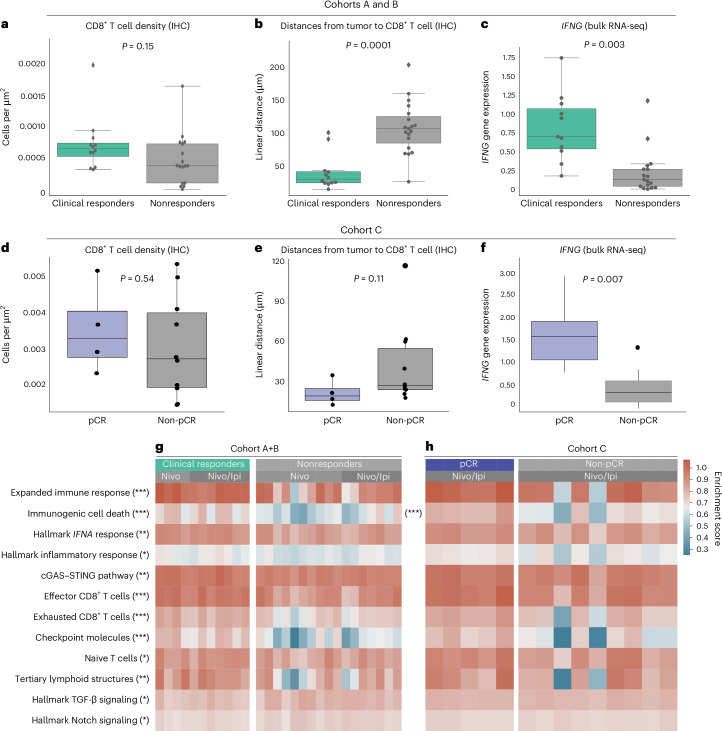
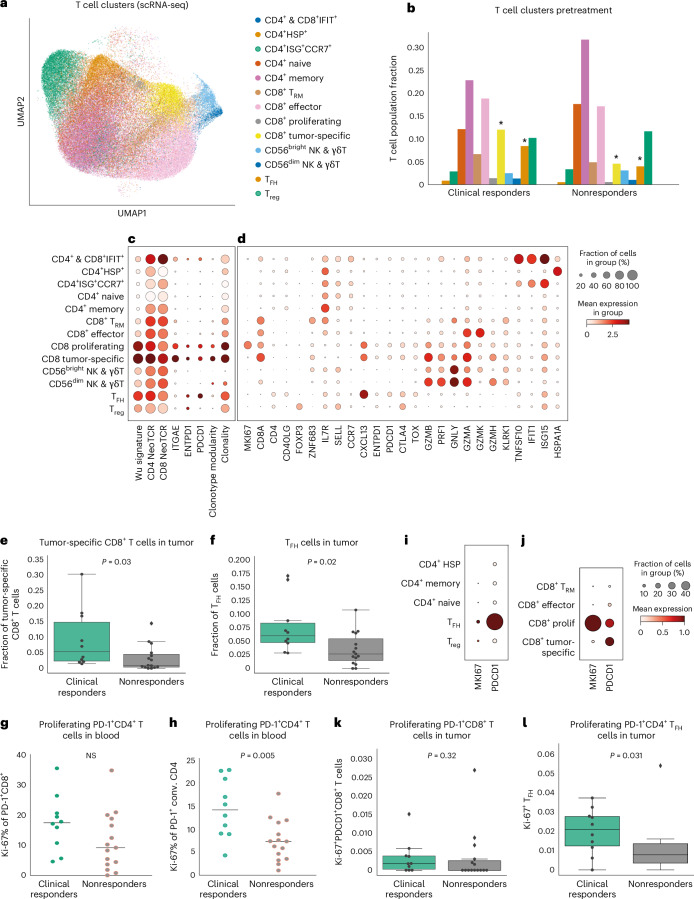
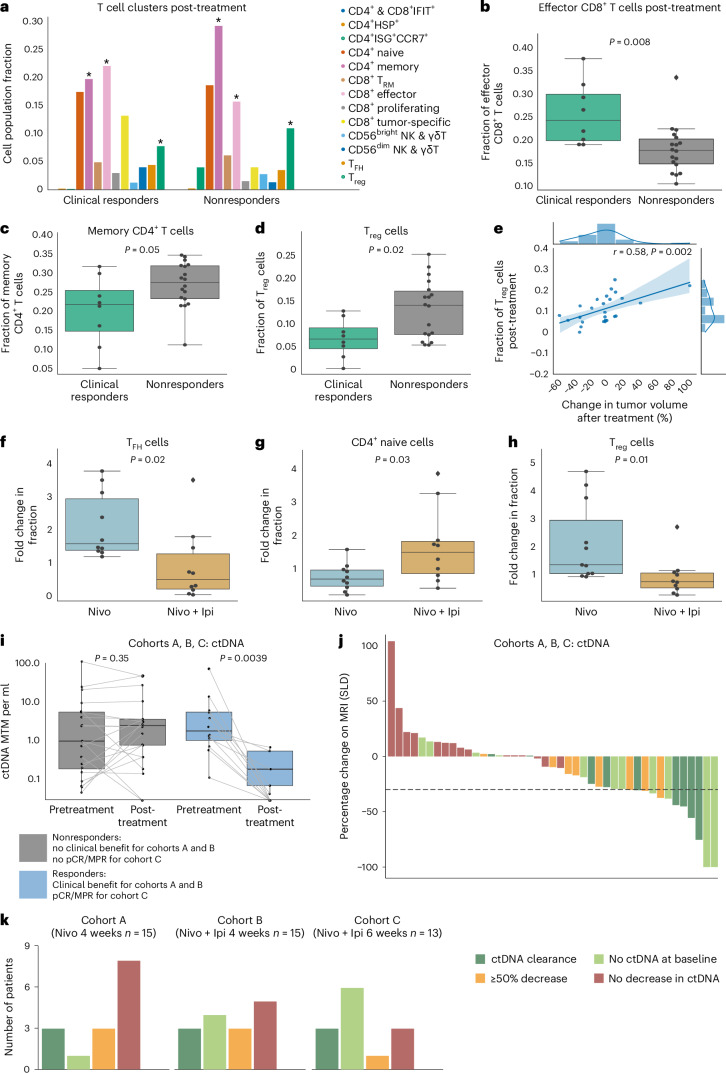
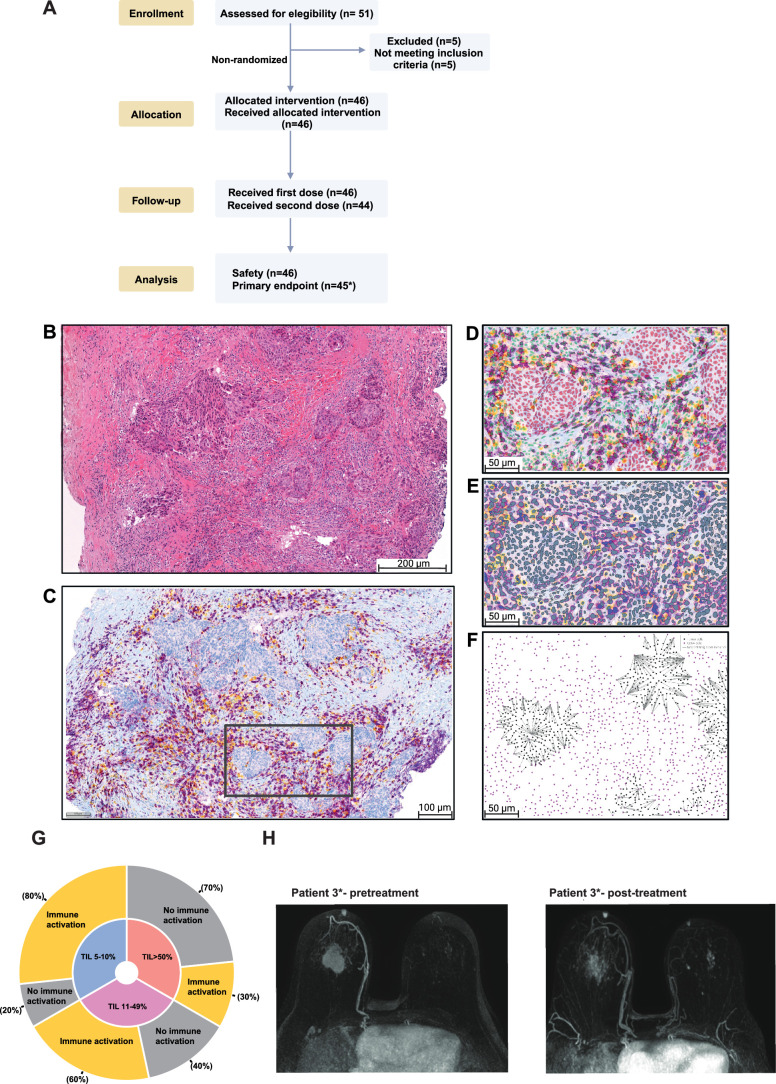
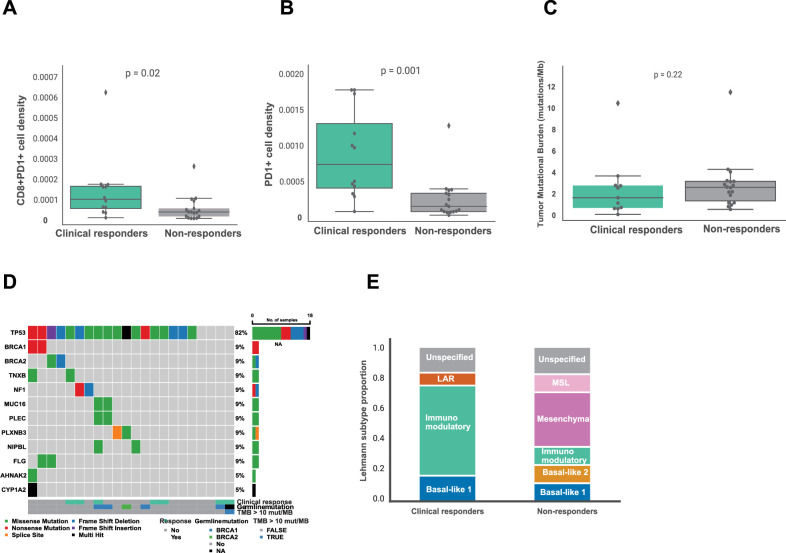
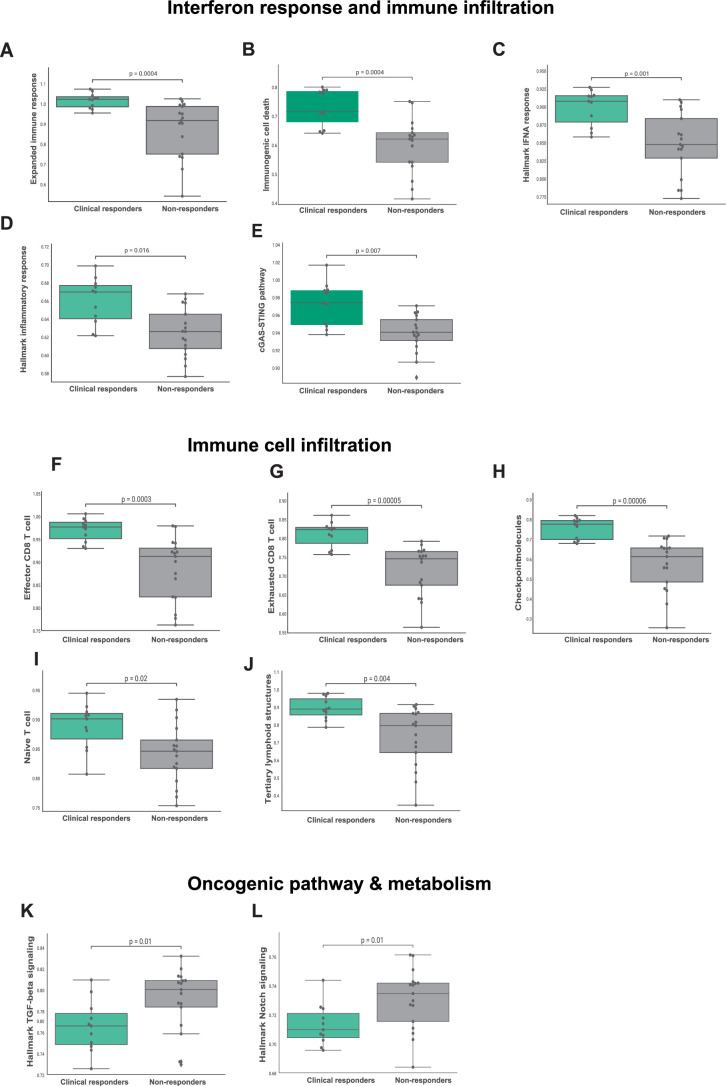
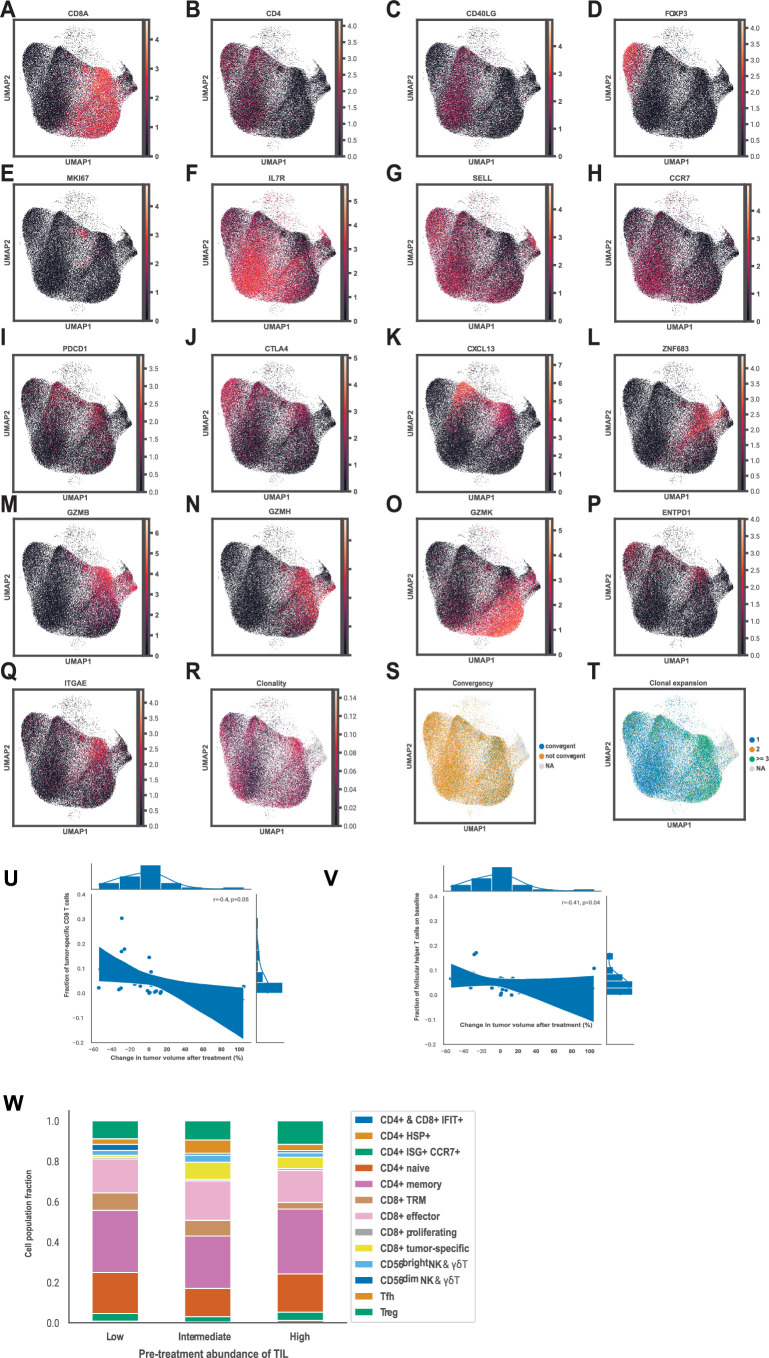
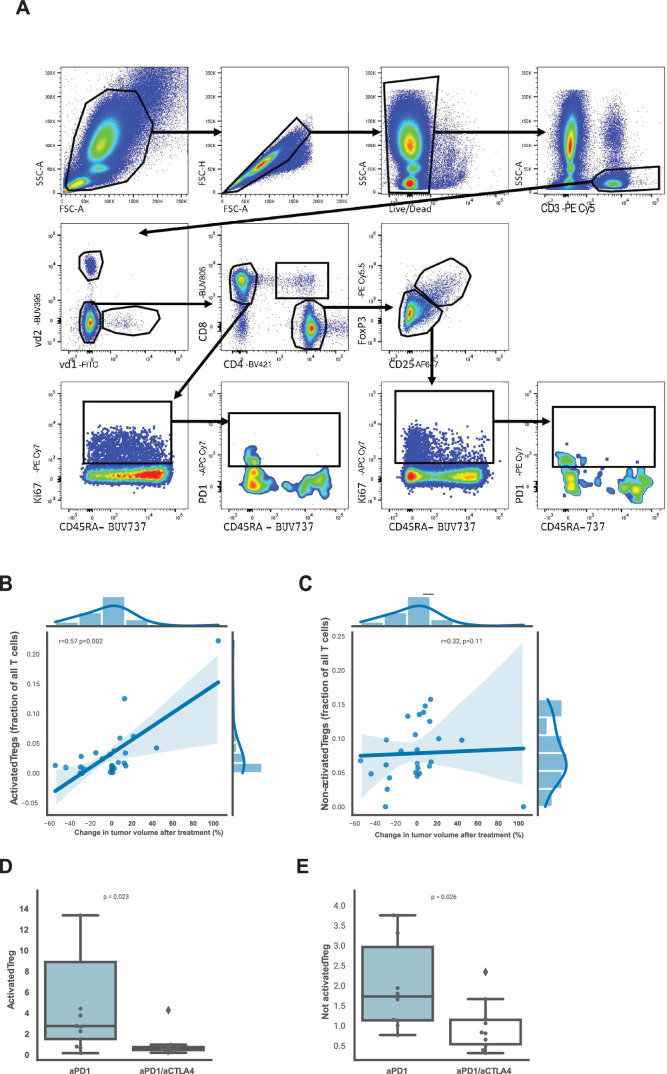
Immune checkpoint inhibition (ICI) with chemotherapy is now the standard of care for stage II-III triple-negative breast cancer; however, it is largely unknown for which patients ICI without chemotherapy could be an option and what the benefit of combination ICI could be. The adaptive BELLINI trial explored whether short combination ICI induces immune activation (primary end point, twofold increase in CD8+ T cells or IFNG), providing a rationale for neoadjuvant ICI without chemotherapy. Here, in window-of-opportunity cohorts A (4 weeks of anti-PD-1) and B (4 weeks of anti-PD-1 + anti-CTLA4), we observed immune activation in 53% (8 of 15) and 60% (9 of 15) of patients, respectively. High levels of tumor-infiltrating lymphocytes correlated with response. Single-cell RNA sequencing revealed that higher pretreatment tumor-reactive CD8+ T cells, follicular helper T cells and shorter distances between tumor and CD8+ T cells correlated with response. Higher levels of regulatory T cells after treatment were associated with nonresponse. Based on these data, we opened cohort C for patients with high levels of tumor-infiltrating lymphocytes (≥50%) who received 6 weeks of neoadjuvant anti-PD-1 + anti-CTLA4 followed by surgery (primary end point, pathological complete response). Overall, 53% (8 of 15) of patients had a major pathological response (<10% viable tumor) at resection, with 33% (5 of 15) having a pathological complete response. All cohorts met Simon's two-stage threshold for expansion to stage II. We observed grade ≥3 adverse events for 17% of patients and a high rate (57%) of immune-mediated endocrinopathies. In conclusion, neoadjuvant immunotherapy without chemotherapy demonstrates potential efficacy and warrants further investigation in patients with early triple-negative breast cancer. ClinicalTrials.gov registration: NCT03815890 .


Conflict of interest statement

Competing interests R.M.M. reports research grants from Siemens Healhtineers, Bayer Healthcare, Screenpoint Medical, Beckton & Dickinson, PA Imaging, Lunit and Koning, and is an advisory board member for Screenpoint, Bayer, Siemens and Guerbet, all outside the scope of this work. E. Kalashnikova is an employee of Natera. G.S.S. reports research funding to the institute from Merck, Agendia, AstraZeneca, Roche and Novartis and a consulting role for Novartis, Seattle Genetics and Biovica, outside the submitted work. S.C.L. reports research funding to the institute from Roche/Genentech, AstraZeneca, BMS, Tesaro, Merck, Immunomedics, Eurocept Pharmaceuticals, Agendia and Novartis and a consulting role and travel grant from Daiichi Sankyo, outside this work. C.U.B. has received research grants from Novartis, BMS and NanoString, is a paid advisory board member for BMS, MSD, Roche, Novartis, GlaxoSmithKline, AstraZeneca, Pfizer, Lilly, GenMab and Pierre Fabre and holds ownership interest in Uniti Card, Neon Therapeutics and Forty Seven, all outside this submitted work. K.E.d.V. reports research funding from Roche and is a consultant for Macomics, outside the scope of this work. R.S. reports nonfinancial support from Merck and BMS, research support from Merck, Puma Biotechnology and Roche and personal fees from Roche, BMS and Exact Sciences for advisory boards, all outside the scope of this paper. L.F.A.W. reports funding to the institute from Genmab BV. T.N.S. is an advisor for Allogene Therapeutics, Asher Bio, Merus, Neogene Therapeutics and Scenic Biotech; is a stockholder in Allogene Therapeutics, Asher Bio, Cell Control, Celsius, Merus and Scenic Biotech; and is venture partner at Third Rock Ventures, all outside of the current work. M.K. reports research funding to the institute from BMS, Roche and AstraZeneca/MedImmune and an advisory role/speakers’ fee (all compensated to the institute) for Alderaan, BMS, Domain Therapeutics, Medscape, Roche, MSD and Daiichi Sankyo, outside the submitted work. Natera provided nonfinancial support to this study. The other authors declare no competing interests.

Figures

Fig. 1
Fig. 1. BELLINI trial design, efficacy data and baseline biomarkers.
a, Trial design for cohorts A and B. Cohort A received two cycles of nivolumab (anti-PD-1). Cohort B received two cycles of nivolumab (anti-PD-1) and one cycle of ipilimumab (anti-CTLA4). Biopsies and blood were taken pretreatment and after 4 weeks of treatment after which patients proceeded to standard-of-care neoadjuvant chemotherapy (n = 28) or primary surgery (n = 3). CR, complete response; WES, whole-exome sequencing. b, Numbers of patients reaching immune activation in cohorts A (n = 15) and B (n = 15). c,d, Changes in tumor size according to the MRI for cohort A (c) and cohort B (d). The dashed line at −30% indicates radiological PR. The green bars indicate clinical responses (radiological PR and/or pathological response). Asterisks (*) represent patients with resection after ICI only (n = 3). pPR, pathological PR according to EUSOMA; SLD, sum of length diameters. e, TILs in pretreatment biopsies of patients with and without clinical response in cohorts A and B. n = 31 patients. f, Combined positive PD-L1 score (CPS) in pretreatment biopsies of patients with and without clinical response in cohorts A and B. n = 31 patients. g, BELLINI trial design for cohort C. Cohort C (n = 15) received two cycles of nivolumab and ipilimumab on days 1 and 21. Biopsies and blood were taken pretreatment and after 6 weeks. Patients proceeded to primary surgery (n = 15). h, pCR and MPR (<10% viable tumor left) rates in cohort C. NR, nonresponse. i, Changes in tumor size according to the MRI in cohort C. The dashed line at −30% indicates radiological PR. Dark blue bars show pCR. j, TILs in pretreatment biopsies of patients according to pCR status in cohort C. n = 15 patients. k, CPS in pretreatment biopsies for patients according to pCR status in cohort C. n = 15 patients. Panels a,g were created with BioRender.com. Levels of TILs calculated as average from TIL levels at diagnostic and pretreatment study (e,j). Boxplots display minimum (Q0), maximum (Q4), median (Q2) and IQR (e,f,j,k). P values were derived using a two-sided Mann–Whitney test.
Fig. 2
Fig. 2. Pretreatment immune activation associated with clinical response.
a, CD8+ density (IHC) in pretreatment biopsies of patients with and without clinical response in cohorts A and B. n = 31 patients. b, Median distances (µm) from tumor cells to the nearest CD8+ T cells in pretreatment biopsies of patients with and without clinical response in cohorts A and B. n = 31 patients. c, IFNG gene expression scores in pretreatment biopsies of patients with and without clinical response in cohorts A and B. n = 28 patients. d, CD8+ density (IHC) in pretreatment biopsies of patients with and without pCR in cohort C. n = 14 patients. e, Median distances from tumor cells to the nearest CD8+ T cells in pretreatment biopsies of patients with and without pCR in cohort C. n = 14 patients. f, IFNG gene expression scores in pretreatment biopsies of patients with and without pCR in cohort C. n = 14 patients. g,h, Gene set enrichment expression scores in pretreatment biopsies of patients with and without clinical response in cohorts A and B (n = 28 patients (g)) or pCR (n = 14 patients (h)) in cohort C. Heatmaps include Expanded immune signature, Immunogenic cell death signature, Hallmark IFNA response gene set, Hallmark inflammatory response gene set, cGAS–STING pathway gene set, Effector CD8+ T cell gene set, Exhausted T cell gene set, Checkpoint molecules gene set, Naive T cell gene set, Tertiary lymphoid structures gene set, Hallmark TGF-β signaling gene set, Hallmark Notch signaling. Asterisks represent the P values. *P ≤ 0.05, **P ≤ 0.01, ***P ≤ 0.001. Reported P values were significant after Benjamini–Hochberg (FDR) correction at 10% significance level. Boxplots display minimum (Q0), maximum (Q4), median (Q2) and IQR (af). P values were derived using a two-sided Mann–Whitney test.
Fig. 3
Fig. 3. Pretreatment T cell profiles of the tumor microenvironment and peripheral blood associated with clinical response in cohorts A and B.
a, UMAP representation of the T cell clusters in the scRNA-seq dataset (cohorts A and B). n = 52 samples from 29 patients, 80, 000 cells. NK, natural killer. b, Fractions of different T cell populations relative to all T cells in the pretreatment biopsies from clinical responders (left) and nonresponders (right) in cohorts A and B. c, Dotplot illustrating markers of different T cell clusters based on scRNA-seq data (cohorts A and B). d, Dotplot illustrating differences in tumor reactivity markers in different T cell clusters based on scRNA-seq data (cohorts A and B). Wu_signature, CD8+ T cell tumor specificity signature; CD4_NeoTCR, CD4+ T cell tumor specificity signature; CD8_ NeoTCR, CD8+ T cell tumor specificity signature. e, Tumor-specific CD8+ T cell fractions relative to all T cells in pretreatment biopsies of patients with and without clinical response (cohorts A and B). n = 25 patients. f, TFH fractions relative to all T cells in pretreatment biopsies of patients with and without clinical response (cohorts A and B). n = 25 patients. g,h, Ki-67 expression on PD-1+CD8+ T cells (g) and conventional CD4+ T cells (h) pretreatment in peripheral blood of patients with and without clinical response in cohorts A and B. n = 25 patients. i, Dotplot for PDCD1 and MKI67 expression in CD4+ T cell clusters (tumoral, scRNA-seq, cohorts A and B). j, Dotplot for PDCD1 and MKI67 expression in CD8+ T cell clusters (tumoral, scRNA-seq, cohorts A and B). k, Fraction of proliferating PD-1+CD8+ T cells relative to all T cells in pretreatment biopsies of patients with and without clinical response based on scRNA-seq data (cohorts A and B). n = 25 patients. l, Fraction of Ki-67+ TFH cells relative to all T cells in pretreatment biopsies of patients with and without clinical response (cohorts A and B). n = 25 patients. Boxplots display minimum (Q0), maximum (Q4), median (Q2) and IQR (e,f,k,l). P values were derived using a two-sided Mann–Whitney test. NS, not significant.
Fig. 4
Fig. 4. Effects of anti-PD-1 ± anti-CTLA4 on the T cell profiles in the tumor microenvironment after treatment in cohorts A and B: ctDNA data for all cohorts.
a, Fractions of different T cell clusters relative to all T cells in post-treatment biopsies of patients who did (left) and did not (right) experience clinical response based on scRNA-seq data. b, Effector CD8+ T cell fractions relative to all T cells in post-treatment biopsies versus clinical response (cohorts A and B). n = 26 patients. c, Memory CD4+ T cell fractions relative to all T cells in post-treatment biopsies versus clinical response (cohorts A and B). n = 26 patients. d, Treg cell fractions relative to all T cells in post-treatment biopsies versus clinical response (cohorts A and B). n = 26 patients. e, Fractions of Treg cells relative to all T cells in post-treatment biopsies of patients (cohorts A and B) in relation to the change in tumor volume after treatment assessed using MRI (RECIST v.1.1). n = 26 patients. fh, Fold changes in fractions of T cell populations relative to all T cells in cohort A and cohort B. n = 22 patients. TFH cells (f). Naive CD4+ T cells (g). Treg cells (h). i, Changes in ctDNA levels of responding and nonresponding patients upon treatment. Patients from all cohorts (A, B and С) for whom ctDNA analysis was performed and ctDNA was detected at baseline (n = 32) were included. j, Waterfall plot of all patients for whom ctDNA analysis was performed (n = 43, all cohorts) colored according to the fold change in ctDNA levels in blood upon treatment. The groups represent ctDNA clearance; post-therapy decrease in ctDNA levels of 50% or more; no ctDNA at baseline; and no decrease in ctDNA. The dashed line at −30% indicates radiological PR. k, Barplots summarizing the number of patients for each ctDNA response category in each cohort (A, B and C). ctDNA at baseline was available for 43 of 46 patients. Boxplots display minimum (Q0), maximum (Q4), median (Q2) and IQR (bd,fi). P values (bd,fh) were derived using a two-sided Mann–Whitney test. P values in i were derived using a paired Wilcoxon test.
Extended Data Fig. 1
Extended Data Fig. 1. IHC CD8 + T cell analysis.
a. CONSORT Flow Diagram. Consort diagram of patients eligible, recruited, numbers followed up and included in analysis. *max 15 patients per cohort analyzed for primary end point b. H&E-stained image, corresponding to CD8/PD-1 stained tissue under C. c. Representative example of a CD8/PD-1 double-stained tissue (haematoxylin = blue, PD-1 = yellow, CD8 = purple). d. Representative example of the performance of the AI-based tumor cell classifier Tumor classification (red) and nontumor cells (green). e. Example of cell segmentation and tumor phenotype assignment. Cell with purple border = CD8+ cell, yellow border = PD-1+ cell, orange border = PD-1 + CD8+ cell. f. Corresponding distance analysis in the same tissue area as under D and E. The grey lines represent the shortest distance from a tumor cell to its nearest CD8 + T cell g. Proportions of patients reaching immune activation stratified according to TIL levels at inclusion in cohorts A and B. 10 patients had 5–10% TILs, 10 patients 11–49% TILs and 10 patients had 50% or more TILs. h. Pretreatment and post-treatment MRI images of patient #3 with a pathological complete response (pCR) at surgery after ICI only (cT2N0, ypT0N0). Figure A was created with BioRender.com. In A-B, one biopsy was analyzed per patient.
Extended Data Fig. 2
Extended Data Fig. 2. Baseline tumor microenvironment features and genomic profile of cohorts A and B.
a. PD-1 + CD8 + T cell density in pretreatment biopsies of patients with and without who did and did not experience clinical response in cohorts A and B. n = 31 patients. b. PD-1+ cell density in pretreatment biopsies of patients with and without who did and did not experience clinical response in cohorts A and B. n = 31 patients. c. Tumor mutational burden (TMB) in pretreatment biopsies of patients with and without clinical response in cohorts A and B. n = 30 patients. Boxplots display a minimum (Q0), a maximum (Q4), a median (Q2) and the interquartile range. Data were analyzed by a two-sided Mann–Whitney test. d. Oncoplot of TMB (mutations per megabase (Mb)) and top mutated genes in cohorts A and B. e. Proportions of Lehmann et al. subtypes in patients with and without clinical response in cohorts A and B. MSL, mesenchymal stem-like; LAR, luminal androgen receptor.
Extended Data Fig. 3
Extended Data Fig. 3. Gene signatures in pretreatment biopsies associated with clinical response in cohorts A and B.
a–l. Gene set expression scores in pretreatment biopsies of patients with and without clinical response in cohorts A and B. n = 28 patients. a. Expanded immune signature from Ayers et al. b. Immunogenic cell death signature. c. Hallmark IFNA response gene set. d. Hallmark inflammatory response gene set. e. cGAS-STING pathway gene set. f. Effector CD8 + T cell gene set. g. Exhausted T cell gene set. h. Checkpoint molecules gene set. i. Naive T cell gene set. j. Tertiary lymphoid structures gene set. k. Hallmark TGF-beta signaling gene set. l. Hallmark Notch signaling. In A–L, boxplots display a minimum (Q0), a maximum (Q4), a median (Q2) and the interquartile range. P values were derived using a two-sided Mann–Whitney test. Reported p values were significant after Benjamini–Hochberg (FDR) correction at 10% significance level.
Extended Data Fig. 4
Extended Data Fig. 4. Single-cell RNA-Seq pretreatment tumor microenvironment profile of the cohorts A and B.
a-q. UMAP representations of the marker gene expression in the dataset. a. CD8A. b. CD4. c. CD40LG d. FOXP3 e. MKI67 f. IL7R. g. SELL. h. CCR7. i. PDCD1. j. CTLA4. k. CXCL13. l. ZNF683. m. GZMB. n. GZMH. o. GZMK. p. ENTPD1. q. ITGAE. r. UMAP representation of the T cell clonality in the dataset. s. UMAP representation of the T cell clone convergence in the dataset. t. UMAP representation of the T cell clonal expansion in the dataset. u. Fractions of tumor-reactive CD8 + T cells relative to all T cells in pretreatment biopsies of patients based on single-cell RNA-Seq data in relation to the change in tumor volume after treatment based on RECIST 1.1 in cohorts A and B. v. Fractions of Tfh cells relative to all T cells in pretreatment biopsies of patients based on single-cell RNA-Seq data in relation to the change in tumor volume after treatment based on RECIST 1.1 in cohorts A and B. w. Fractions of different T cell clusters relative to all T cells based on single-cell RNA-Seq data in pretreatment biopsies of patients who had low (5–10%), intermediate (11–49%) and high (>=50%) presence of tumor-infiltrating lymphocytes before treatment in cohorts A and B. In U-V, correlation was estimated with Spearman’s rank correlation coefficient, two-sided, with 95% confidence interval for the regression estimate.
Extended Data Fig. 5
Extended Data Fig. 5. Gating strategy used for the flow cytometry data analysis and activated and non-activated Tregs in cohorts A and B.
a. Gating strategy used for the flow cytometry data analysis. b. Spearman correlation between fraction of activated Tregs and the change in tumor size on MRI (%). c. Spearman correlation between fraction of non-activated Tregs and the change in tumor size on MRI (%). Activated Tregs were defined as activated by the expression of CD137. d–e. Fold change in activated (d) and non-activated (e) Tregs after anti-PD-1 or anti-PD-1/anti-CTLA4 therapy. n = 22 patients. In B-C, correlation was estimated with Spearman’s rank correlation coefficient, two-sided, with 95% confidence interval for the regression estimate. In D–E, boxplots display a minimum (Q0), a maximum (Q4), a median (Q2) and the interquartile range. P values were derived using a two-sided Mann–Whitney test.

Similar articles

Cited by

References

    1. Schmid, P. et al. Event-free survival with pembrolizumab in early triple-negative breast cancer. N. Engl. J. Med.386, 556–567 (2022). - PubMed
    1. Loibl, S. et al. A randomised phase II study investigating durvalumab in addition to an anthracycline taxane-based neoadjuvant therapy in early triple-negative breast cancer: clinical results and biomarker analysis of GeparNuevo study. Ann. Oncol.30, 1279–1288 (2019). - PubMed
    1. Mittendorf, E. A. et al. Neoadjuvant atezolizumab in combination with sequential nab-paclitaxel and anthracycline-based chemotherapy versus placebo and chemotherapy in patients with early-stage triple-negative breast cancer (IMpassion031): a randomised, double-blind, phase 3 trial. Lancet396, 1090–1100 (2020). - PubMed
    1. Schmid, P. et al. Pembrolizumab for early triple-negative breast cancer. N. Engl. J. Med.382, 810–821 (2020). - PubMed
    1. Gustafson, C. E. et al. Immune cell repertoires in breast cancer patients after adjuvant chemotherapy. JCI Insight5, e134569 (2020). - PMC - PubMed

Publication types

MeSH terms

Associated data