Observational Study
. 2024 Nov;30(11):3272-3283.
doi: 10.1038/s41591-024-03254-6. Epub 2024 Sep 16.

ctDNA-based molecular residual disease and survival in resectable colorectal cancer

Affiliations
Observational Study

ctDNA-based molecular residual disease and survival in resectable colorectal cancer

Yoshiaki Nakamura et al. Nat Med. 2024 Nov.

Abstract

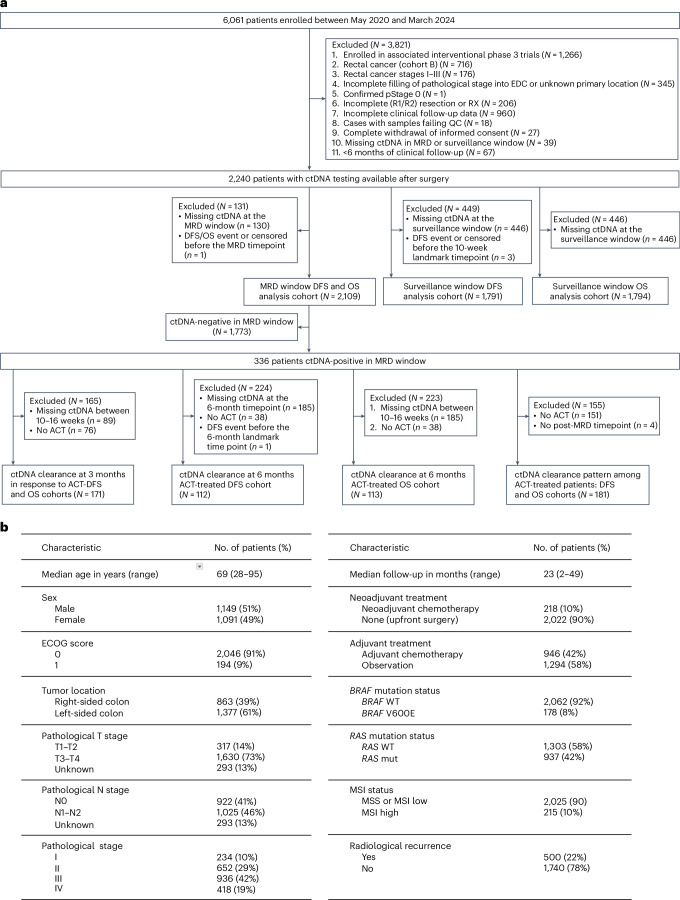
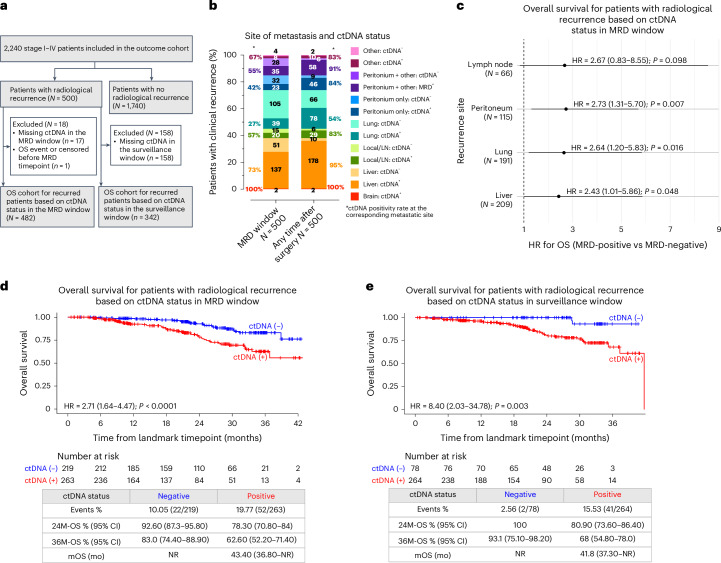
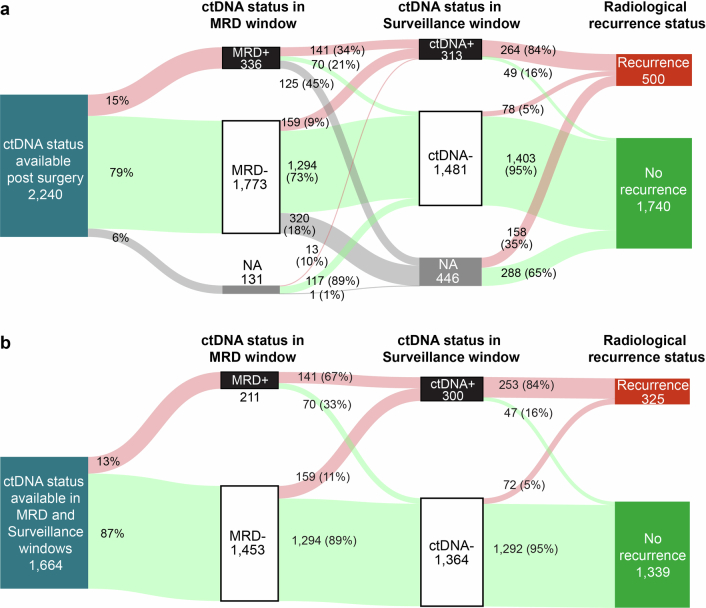
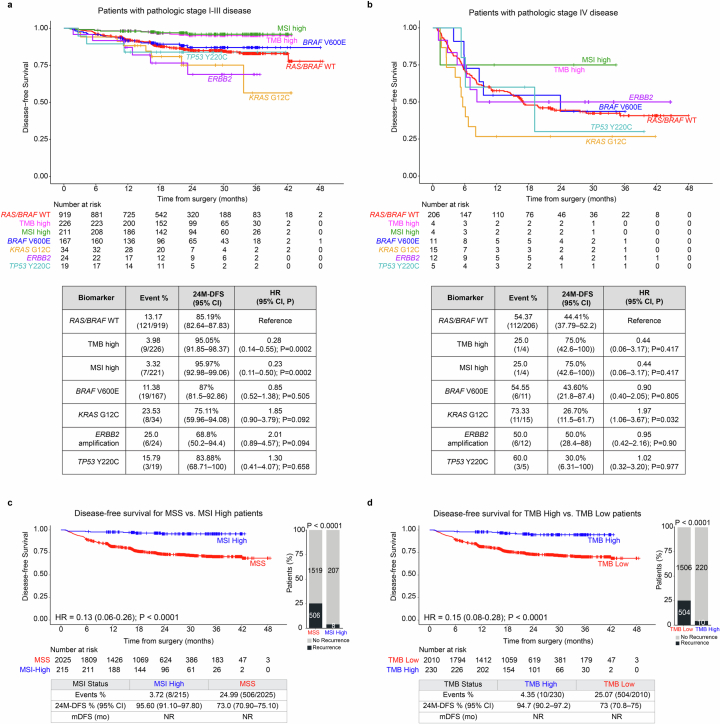
The interim analysis of the CIRCULATE-Japan GALAXY observational study demonstrated the association of circulating tumor DNA (ctDNA)-based molecular residual disease (MRD) detection with recurrence risk and benefit from adjuvant chemotherapy (ACT) in resectable colorectal cancer (CRC). This updated analysis with a 23-month median follow-up, including 2,240 patients with stage II-III colon cancer or stage IV CRC, reinforces the prognostic value of ctDNA positivity during the MRD window with significantly inferior disease-free survival (DFS; hazard ratio (HR): 11.99, P < 0.0001) and overall survival (OS; HR: 9.68, P < 0.0001). In patients who experienced recurrence, ctDNA positivity correlated with shorter OS (HR: 2.71, P < 0.0001). The significantly shorter DFS in MRD-positive patients was consistent across actionable biomarker subsets. Sustained ctDNA clearance in response to ACT was an indicator of favorable DFS and OS compared to transient clearance (24-month DFS: 89.0% versus 3.3%; 24-month OS: 100.0% versus 82.3%). True spontaneous clearance rate with no clinical recurrence was 1.9% (2/105). Overall, our findings provide evidence for the utility of ctDNA monitoring for post-resection recurrence and mortality risk stratification that could be used for guiding adjuvant therapy.


Conflict of interest statement

Competing interests Y.N. reports advisory roles with Guardant Health Pte Ltd., Natera, Inc., Roche Ltd., Seagen, Inc., Premo Partners, Inc., Daiichi Sankyo Co., Ltd., Takeda Pharmaceutical Co., Ltd., Exact Sciences Corporation and Gilead Sciences, Inc.; speakers’ bureau from Guardant Health Pte Ltd., MSD K.K., Eisai Co., Ltd., Zeria Pharmaceutical Co., Ltd., Miyarisan Pharmaceutical Co., Ltd., Merck Biopharma Co., Ltd., CareNet, Inc., Hisamitsu Pharmaceutical Co., Inc., Taiho Pharmaceutical Co., Ltd., Daiichi Sankyo Co., Ltd., Chugai Pharmaceutical Co., Ltd., Becton, Dickinson and Company and Guardant Health Japan Corp.; research funding from Seagen, Inc., Genomedia, Inc., Guardant Health AMEA, Inc., Guardant Health, Inc., Tempus Labs, Inc., Roche Diagnostics K.K., Daiichi Sankyo Co., Ltd. and Chugai Pharmaceutical Co., Ltd. J.W. reports receiving honoraria for lectures from Johnson & Johnson, Medtronic, Eli Lilly and Takeda Pharmaceuticals and receiving research funding from Medtronic, AMCO, TERUMO and Stryker Japan, all outside the submitted work. N.A. reports nothing to declare. K.H. reports nothing to declare. K. Kataoka reports speakers’ bureau from Merck Biopharma Co., Ltd., Takeda Pharmaceutical Co., Ltd., Eli Lilly Japan Co., Ltd. and Guardant Health Japan Corp. and research funding from Sysmex. M.Y. reports receipt of personal fees and honoraria for lectures from Medtronic, Johnson & Johnson, INTUITIVE, Eli Lilly, Taiho, Merck KGaA, Takeda and Daiichi Sankyo. K. Kato reports nothing to declare. M.K. reports speakers’ bureau from Taiho Pharmaceutical Co., Ltd., Chugai Pharmaceutical Co., Ltd., Takeda Pharmaceutical Co., Ltd., Eli Lilly and Yakult Honsha. Y.K. reports speakers’ bureau from Guardant Health Pte Ltd., MSD K.K., Merck Biopharma Co., Ltd., Taiho Pharmaceutical Co., Ltd., Chugai Pharmaceutical Co., Ltd., Takeda Pharmaceutical Co. and Ono Pharmaceutical Co., Ltd. K.H.Y. reports payment or honoraria for lectures, presentations and speakers’ bureaus from Takeda Pharmaceutical Co., Ltd., Ono Pharmaceutical Co., Ltd, TTY Biopharm Co. Ltd., OEP Group Co., Ltd., Bristol Myers Squibb, Amgen, Inc., Bayer Co., Ltd., Daiichi Sankyo Co., Ltd., Merck Biopharma Co., Ltd., Novartis Co., Ltd. and CStone Pharmaceuticals Co., Ltd. and advisory roles with Merck & Co., Inc, Pfizer Inc., Pierre Fabre, Ltd. and AstraZeneca. S.M. reports honoraria from Taiho Pharmaceutical Co., Ltd., Chugai Pharmaceutical Co., Ltd. and Eli Lilly. H.Y. reports nothing to declare. K.A. reports nothing to declare. M. Miyo reports nothing to declare. T.M. reports advisory role with Anaut, Inc. and Fujifilm Corporation and speakers’ bureau from AstraZeneca K.K., Chugai Pharmaceutical Co., Ltd. and Miyarisan Pharmaceutical Co., Ltd. K.Y. reports speakers’ bureau from Chugai Pharmaceutical Co., Ltd., Daiichi Sankyo Co., Ltd., Yakult Honsha Co., Ltd., Takeda Pharmaceutical Co., Ltd., Merck Biopharma Co., Ltd., Taiho Pharmaceutical Co., Ltd., Eli Lilly Japan K.K., Ono Pharmaceutical Co., Ltd., MSD Co., Ltd. and Bristol Myers Squibb and research funding from Taiho Pharmaceutical Co., Ltd. H.E. reports honoraria from Amgen, Chugai Pharmaceutical Co., Ltd., Guardant Health Japan Corp., Incyte Japan Co., Ltd., Merck Serono Co., Ltd., Ono Pharmaceutical Co., Ltd. and Konica Minolta Co, Ltd. and research funding from Astellas Pharmaceutical Co., Ltd. K.O. reports speakers’ bureau from Taiho Pharmaceutical Co., Ltd. A.H. reports receiving honoraria for lectures from Medtronic, Johnson & Johnson, Merck Biopharma Co., Ltd., Eli Lilly and Fujifilm Corporation. H.S. reports nothing to declare. S.K. is a full-time employee of EPS Corporation. G.L., V.N.A., S.S. and A.J. are employees of Natera, Inc., with stock or options to own stock. M.C.L. is an employee of Natera, Inc., with stock or options to own stock, and further reports grants/contracts (funding to institution: Mayo Clinic) from Eisai, Exact Sciences Corporation, Genentech, Genomic Health, GRAIL, Menarini Silicon Biosystems, Merck, Novartis, Seattle Genetics and Tesaro; travel support reimbursement from AstraZeneca, Genomic Health and Ionis; and ad hoc advisory board meetings (all funds to Mayo Clinic; no personal compensation) from AstraZeneca, Celgene, Roche/Genentech, Genomic Health, GRAIL, Ionis, Merck, Pfizer, Seattle Genetics and Syndax. A.A. is an employee of Natera, Inc., with a leadership position and stock or options to own stock. M.R. reports employment, leadership position, stock and other ownership interests and consulting and advisory role at Natera, Inc., MyOme and Marble Therapeutics and research funding, patents/royalties/other intellectual property and travel/accommodations/expenses from Natera, Inc. and MyOme. H.B. reports research funding from Ono Pharmaceutical and honoraria from Ono Pharmaceutical, Eli Lilly Japan and Taiho Pharmaceutical. H.T. reports speakers’ bureau from MSD K.K, Merck Biopharma Co., Ltd., Takeda, Taiho, Eli Lilly Japan, Bristol Myers Squibb Japan, Chugai Pharmaceutical, Ono Yakuhin and Amgen and research funding from Takeda and Daiichi Sankyo. I.T. reports speakers’ bureau from Medtronic, Johnson & Johnson, Intuitive, Medicaroid and Eli Lilly and research funding from Medtronic and Sysmex. T.K. reports nothing to declare. D.K. reports honoraria from Takeda, Chugai, Eli Lilly, MSD, Ono Pharmaceutical, Seagen, Guardant Health, Eisai, Taiho, Bristol Myers Squibb, Daiichi Sankyo, Pfizer, Merck Biopharma Co., Ltd. and Sysmex and research funding from Ono Pharmaceutical, MSD, Novartis, Servier, Janssen, IQVIA, Syneoshealth, CIMIC and Cimicshiftzero. M. Mori reports nothing to declare. T.Y. reports honoraria from Chugai Pharmaceutical, Takeda Pharmaceutical, Merck Biopharma Co., Ltd., Bayer Yakuhin, Ono Pharmaceutical and MSD K.K; consulting fee from Sumitomo Corp.; and research funding from Amgen, Bristol Myers Squibb, Chugai Pharmaceutical, Daiichi Sankyo, Eisai, FALCO Biosystems, Genomedia, Medical & Biological Laboratories, Merus N.V., Molecular Health GmbH, MSD, Nippon Boehringer Ingelheim, Ono Pharmaceutical, Pfizer Japan, Roche Diagnostics, Sanofi, Sysmex, Taiho Pharmaceutical and Takeda Pharmaceutical. E.O. reports speakers’ bureau from Chugai Pharmaceutical Co., Ltd., Bristol Meyers Squibb, Ono Pharmaceutical Co., Ltd., Eli Lilly and Takeda Pharmaceutical Co., Ltd.; research funding from Guardant Health, Inc.; and an advisory role with GlaxoSmithKline.

Figures

Fig. 1
Fig. 1. Patient inclusion and baseline characteristics.
a, CONSORT diagram illustrating the inclusion of patients from enrollment to primary and subanalyses in this study. b, Patient characteristics of the evaluable patient population (n = 2,240). EDC, electronic data capture; RX, the presence of residual tumor cannot be assessed.
Fig. 2
Fig. 2. ctDNA status in the MRD and surveillance windows is predictive of survival outcomes in post-surgical patients with CRC.
a,b, Kaplan–Meier estimates for DFS (a) and OS (b) stratified by ctDNA status during the MRD window (negative versus positive). P = 7.55 × 10–162 (a); P = 1.25 × 10–25 (b). P value for the bar plots showing the association between ctDNA status and DFS or OS events was calculated based on the two-sided chi-square test: P = 4.11 × 10−146 (a); P = 6.97 × 10−29 (b). c,d, Forest plot depicting the multivariate analysis (including ctDNA status during MRD window and other clinicopathological factors) for DFS (c) and OS (d) in patients with CRC. P = 1.10 × 10–96 (c, ctDNA); P = 1.43 × 10−4 (c, MSI); P = 2.55 × 10−15 (d, ctDNA); P = 3.56 × 10−5 (d, BRAF V600E). e,f, Kaplan–Meier estimates for DFS (e) and OS (f) stratified by ctDNA status during the surveillance window (negative versus positive). P = 1.21 × 10−163 (e); P = 1.20 × 10−20 (f). Two-sided chi-square test for bar plots: P = 1.19 × 10−217 (e); P = 1.10 × 10−29 (f). g, Forest plot depicting the multivariate analysis (including ctDNA status during the surveillance window and other clinicopathological factors) for DFS in patients with CRC. P = 6.79 × 10−118 (g, ctDNA); P = 1.88 × 10−4 (g, sex). HRs and 95% CIs were calculated using the Cox proportional hazard model; P values were calculated using the two-sided log-rank test (a,b,e,f). Various prognostic factors and their association with DFS, as indicated by HR, were analyzed across the cohort using the two-sided Wald chi-squared test (c,d,g). The unadjusted HRs (squares) and 95% CIs (horizontal lines) are shown for each prognostic factor; the vertical dotted line represents the null hypothesis (c,d,g). The DFS and OS analyses in the MRD window were landmarked from the date of the MRD timepoint, and the analyses in the surveillance window were landmarked at 10 weeks after surgery. Median DFS/OS and percentage DFS and OS at 24 months, 30 months and 36 months were estimated from the landmark timepoint. AIC, Akaike information criterion; mDFS, median DFS; mOS, median OS; NR, not reached.
Fig. 3
Fig. 3. ctDNA positivity during the MRD and surveillance windows was significantly associated with inferior OS of patients who had radiological recurrence.
a, CONSORT diagram depicting patients included in the OS cohorts of patients with radiological recurrence. b, Bar plot showing the association of percentage of patients with ctDNA positivity and negativity during the MRD window and any time after surgery with the site of recurrence. c, ctDNA status in the MRD window is predictive of OS across all recurrence sites in post-surgical patients with CRC. Note: Given that 226 of the 500 patients with radiological recurrence had metastatic involvement at more than one site, these individual patients were counted in more than one category. d,e, Kaplan–Meier estimates for OS stratified by ctDNA status during the MRD window (d) or surveillance window (e) of patients with CRC who had radiological recurrence during follow-up. P = 9.89 × 10−5 (d). HRs and 95% CIs were calculated using the Cox proportional hazard model. P values were calculated using the two-sided log-rank test. The OS analysis in the MRD window was landmarked from the date of the MRD timepoint, and the analysis in the surveillance window was landmarked at 10 weeks after surgery. Median OS and percentage OS at 24 months were estimated from the landmark timepoint. ctDNA, ctDNA negative; ctDNA+, ctDNA positive; LN, lymph node.
Fig. 4
Fig. 4. MRD positivity was associated with worse DFS compared to MRD negativity consistently across all actionable biomarkers.
a, Prevalence of genomic biomarkers in our cohort. b,c, Kaplan–Meier estimates for DFS stratified by the presence of genomic biomarkers. P = 2.17 × 10−7 (c, TMB high); P = 3.62 × 10−7 (c, MSI high). Two-sided chi-square test for bar plot: P = 3.04 × 10−17 (b). d, ctDNA detection percentage rates in the MRD window by genomic biomarkers. Error bars represent 95% CI. e,f, Kaplan–Meier estimates for DFS stratified by the ctDNA status in the MRD window and genomic biomarkers. The unadjusted HRs (circles) and 95% CIs (horizontal lines) are shown for each biomarker; the vertical dashed line represents the null hypothesis (f). P = 8.75 × 10−12 (e, BRAF V600E); P = 7.55 × 10−162 (f, all); P = 8.75 × 10−12 (f, BRAF V600E); P = 3.35 × 10−5 (f, ERBB2); P = 1.01 × 10−6 (f, KRAS G12C); P = 3.37 × 10−8 (f, MSI high); P = 1.33 × 10−7 (f, TMB high); P = 4.75 × 10−74 (f, RAS/BRAF WT). Two-sided chi-square test for bar plot: P = 1.01 × 10−15 (e). HRs and 95% CIs were calculated using the Cox proportional hazard model; P values were calculated using the two-sided log-rank test (c,e,f). Analyses in df were landmarked from the date of the MRD timepoint. Median DFS and percentage DFS at 24 months were estimated from the landmark timepoint. Statistical comparisons of baseline characteristics by the presence of each actionable biomarker were performed using Fisher’s exact test for categorical variables and the Mann–Whitney test for continuous variables. Multivariate logistic regression analysis was used to test the association of post-surgical MRD detection with actionable biomarkers as well as baseline characteristics.
Fig. 5
Fig. 5. Among patients with ctDNA positivity during the MRD window, ctDNA clearance is associated with superior DFS compared to no ctDNA clearance.
a,b, Kaplan–Meier estimates for DFS (a) and OS (b) stratified by ctDNA clearance status from MRD window to 3-month timepoint in MRD-positive patients receiving ACT. This analysis was landmarked at the date of 3-month timepoint. P = 2.67 × 10−16 (a). Two-sided chi-square test for bar plot: P = 4.65 × 10−10 (a). c,d, Kaplan–Meier estimates for DFS (c) and OS (d) stratified by ctDNA clearance status from MRD window to 6-month timepoint in MRD-positive patients receiving ACT. P = 4.24 × 10−15 (c). Two-sided chi-square test for bar plot: P = 3.62 × 10−9 (c). HRs and 95% CIs were calculated using the Cox proportional hazard model. P values were calculated using the two-sided log-rank test. This analysis was landmarked at the date of 6-month timepoint. Analyses were performed using R software version 4.4.0. Median DFS and percentage DFS at 24 months were estimated from the landmark timepoint.
Fig. 6
Fig. 6. Patients turning ctDNA positive after MRD negativity or transient ctDNA clearance.
a,b, Kaplan–Meier estimates for DFS (a) and OS (b) stratified by ctDNA clearance patterns (no clearance versus transient clearance versus sustained clearance) in MRD-positive patients receiving ACT. *Based on Firth’s penalized maximum likelihood; P value from log-rank test. P = 1.78 × 10⁻¹² (a, transient clearance); P = 3.97 × 10–26 (a, no clearance); P = 3.72 × 10–9 (b, no clearance). Two-sided chi-square test for bar plots: P = 6.69 × 10–28 (a); P = 3.11 × 10–6 (b). c, Among patients with transient clearance who recurred (n = 50), the cumulative incidence plot demonstrates a timeline of patients turning back ctDNA positive (time from surgery). d, Among MRD-negative patients who had molecular recurrence before radiological recurrence (n = 165), the cumulative incidence plot demonstrated a timeline of when the patients turned ctDNA positive. e, Kaplan–Meier estimates for OS stratified by ctDNA MRD status and molecular recurrence during the surveillance window (all-time ctDNA negative versus MRD negative with molecular recurrence versus MRD positive). P = 7.09 × 10−11 (MRD positive). Two-sided chi-square test for bar plot: P = 2.63 × 10–31. f, Kaplan–Meier estimates for OS stratified by timing of molecular recurrence after surgery. HRs and 95% CIs were calculated using the Cox proportional hazard model (a,e) or Cox regression with Firth’s penalized likelihood hazard model (b,f). P values were calculated using the two-sided log-rank test. These analyses were landmarked at the MRD timepoint date and were performed using R software version 4.4.0. Median DFS and OS and percentage DFS and OS at 24 months were estimated from the landmark timepoint.
Extended Data Fig. 1
Extended Data Fig. 1. ctDNA status in the MRD window is predictive of DFS across all stages in postsurgical patients with CRC.
a-f. Kaplan-Meier estimates for DFS stratified by ctDNA status during the MRD window (negative versus positive) in patients with pathologic stage I (a), stage II (b), stage III (c), stage IV (d), high-risk stage II (e), and high-risk stage III (f) CRC. P = 1.66 × 10⁻⁵ (a); P = 1.05 × 10⁻³³ (b); P = 9.55 × 10−59 (c); P = 3.82 × 10−37 (d); P = 8.30 × 10⁻³⁰ (e); P = 9.66 × 10−36 (f). Hazard ratios (HRs) and 95% CIs were calculated using the Cox proportional hazard model. P values were calculated using the two-sided log-rank test. This analysis was landmarked from the date of the MRD time point. Median DFS and percent DFS at 24 months were estimated from the landmark time point. Abbreviations: MRD, molecular residual disease. DFS, disease-free survival.
Extended Data Fig. 2
Extended Data Fig. 2. ctDNA status in the MRD window is predictive of DFS and OS among patients with stage I-III colon cancer and stage IV CRC.
a-b. Kaplan-Meier estimates for DFS stratified by ctDNA status in the MRD window among patients with pathological stage I-III colon cancer (a) and pathological stage IV colorectal cancer (b). c-d. Kaplan-Meier estimates for OS stratified by ctDNA status in the MRD window among patients with stage I-III colon cancer (c) and stage IV colorectal cancer (d). Hazard ratios (HRs) and 95% CIs were calculated using the Cox proportional hazard model. P values were calculated using the two-sided log-rank test. This analysis was landmarked from the date of the MRD time point. Median DFS and percent DFS at 24 months were estimated from the landmark time point. Abbreviations: MRD, molecular residual disease. DFS, disease-free survival; OS, overall survival.
Extended Data Fig. 3
Extended Data Fig. 3. ctDNA status in the MRD and surveillance windows and subsequence radiological recurrence status.
a. Sankey plot depicting the percentage of all patients in the cohort (N = 2,240) with MRD-positivity or -negativity, the percentage of patients with subsequent ctDNA status during surveillance (after ACT or observation), and the percentage of each group with confirmed radiological recurrence. b. Among patients with ctDNA status available in both MRD and surveillance windows (N = 1,664), Sankey plot shows the percentage of patients with MRD-positivity or -negativity, the percentage of patients with subsequent ctDNA status during surveillance (after ACT or observation), and the percentage of each group with confirmed radiological recurrence. Abbreviations: MRD, molecular residual disease; NA, not available.
Extended Data Fig. 4
Extended Data Fig. 4. ctDNA status in the MRD and surveillance windows is predictive of post-recurrence survival among patients who recurred.
a-b. Kaplan-Meier estimates for PRS stratified by ctDNA status during the MRD window (a) or surveillance window (b) among patients with CRC who had radiological recurrence during follow-up. Hazard ratios (HRs) and 95% CIs were calculated using the Cox proportional hazard model. P values were calculated using the two-sided log-rank test. All analyses were landmarked at the date of radiological recurrence. Median PRS and percent PRS at 24 months were estimated from the landmark time point. c. Bar plot demonstrating the proportion of ctDNA-negative (N = 90) and ctDNA-positive (N = 79) patients undergoing curative resection for recurrence lesions. Error bars represent 95% confidence intervals. P value was generated based on the two-sided Chi-square test. Abbreviations: MRD, molecular residual disease; PRS, post-recurrence survival.
Extended Data Fig. 5
Extended Data Fig. 5. Association of actionable biomarker status with DFS.
a-b. Kaplan-Meier estimates for DFS stratified by the presence of genomic biomarkers among patients with pathological stage I-III colon cancer (a) and pathological stage IV colorectal cancer (b). *MSI high and TMB high lines overlap with each other. Two-sided Chi-square test for bar plots: P = 5.08 × 10⁻⁷ (a) c-d. Kaplan-Meier estimates for DFS stratified by MSI status (MSI High versus MSS; c) and TMB status (TMB high versus TMB low; d) for all patients in this cohort (N = 2,040). P = 9.47 × 10⁻⁹ (c); P = 2.96 × 10⁻⁹ (d). Two-sided Chi-square test for bar plots: P = 3.27 × 10⁻¹² (c); P = 2.59 × 10⁻¹² (d). Hazard ratios (HRs) and 95% CIs were calculated using the Cox proportional hazard model. P values were calculated using the two-sided log-rank test. This analysis was landmarked from the date of the MRD time point.
Extended Data Fig. 6
Extended Data Fig. 6. Combination of MRD status, BRAF mutation status, and MSI status is predictive of DFS.
a-b. Kaplan-Meier estimates for DFS stratified by BRAF mutation status (wild-type versus V600E) and MSI status (MSI high versus MSS) among patients who were MRD-positive (a) or MRD-negative (b). P = 4.95 × 10⁻⁷ (b, BRAF WT & MSI high). Two-sided Chi-square test for bar plots: P = 6.50 × 10⁻⁶ (b). Hazard ratios (HRs) and 95% CIs were calculated using the Cox proportional hazard model. P values were calculated using the two-sided log-rank test. This analysis was landmarked from the date of the MRD time point. Median DFS and percent DFS at 24 months are estimated from the landmark time point. Abbreviations: WT, wild-type; MRD, molecular residual disease.
Extended Data Fig. 7
Extended Data Fig. 7. ctDNA-based MRD testing is predictive of the benefit of ACT in postsurgical patients with colon cancer.
a-f. Kaplan-Meier estimates for DFS stratified by adjuvant treatment (observation versus ACT) in MRD-positive and -negative patients with: (a-b) pathological high-risk stage II or stage III, (c-d) high-risk stage II and (e-f) stage III disease. P = 1.43 × 10⁻¹² (a); P = 5.38 × 10⁻⁵ (c); P = 8.79 × 10⁻¹⁰ (e). Two-sided Chi-square test for bar plots: P = 1.39 × 10⁻⁵ (a). *HR was adjusted by age, sex, stage (A, B), and ECOG performance status. Hazard ratios (HRs) and 95% CIs were calculated using the Cox proportional hazard model. P values were calculated using the two-sided log-rank test. The analysis was landmarked at 2 months post-surgery. Median DFS and percent DFS at 24 months were estimated from the landmark time point. Abbreviations: ACT, adjuvant chemotherapy; MRD, molecular residual disease.
Extended Data Fig. 8
Extended Data Fig. 8. MRD-negative patients with T3N0 or T4N0 disease do not derive benefit from ACT.
a-b. Kaplan-Meier estimates for DFS stratified by adjuvant treatment (observation versus ACT) in MRD-negative patients with T30N0 (a) or T4N0 (b) colon cancer. *HR was adjusted by age, sex and ECOG performance status. Hazard ratios (HRs) and 95% CIs were calculated using the Cox proportional hazard model. P values were calculated using the two-sided log-rank test. The analysis was landmarked at 2 months post-surgery. Median DFS and percent DFS at 24 months were estimated from the landmark time point. Abbreviations: ACT, adjuvant chemotherapy.
Extended Data Fig. 9
Extended Data Fig. 9. MRD-positive patients but not MRD-negative patients with stage IV CRC derive benefit from ACT regardless of whether they received neoadjuvant chemotherapy or not.
a-b. Kaplan-Meier estimates for DFS stratified by adjuvant treatment (observation versus ACT) in MRD-positive patients with stage IV CRC who received NAC (a) or did not receive NAC (b). P = 8.34 × 10⁻⁷ (b). c-d. Kaplan-Meier estimates for DFS stratified by adjuvant treatment (observation versus ACT) in MRD-negative patients with stage IV CRC who received NAC (c) or did not receive NAC (d). HR was adjusted by age, sex and ECOG performance status. Hazard ratios (HRs) and 95% CIs were calculated using the Cox proportional hazard model. P values were calculated using the two-sided log-rank test. The analysis was landmarked at 2 months post-surgery. Median DFS and percent DFS at 24 months were estimated from the landmark time point. Abbreviations: NAC, neoadjuvant chemotherapy; ACT, adjuvant chemotherapy.

Similar articles

Cited by

References

    1. Reinert, T. et al. Analysis of plasma cell-free DNA by ultradeep sequencing in patients with stages I to III colorectal cancer. JAMA Oncol.5, 1124–1131 (2019). - PMC - PubMed
    1. Loupakis, F. et al. Detection of molecular residual disease using personalized circulating tumor DNA assay in patients with colorectal cancer undergoing resection of metastases. JCO Precis. Oncol.5, PO.21.00101 (2021). - PMC - PubMed
    1. Kotani, D. et al. Molecular residual disease and efficacy of adjuvant chemotherapy in patients with colorectal cancer. Nat. Med.29, 127–134 (2023). - PMC - PubMed
    1. Kasi, P. M. et al. Circulating tumor DNA (ctDNA) for informing adjuvant chemotherapy (ACT) in stage II/III colorectal cancer (CRC): interim analysis of BESPOKE CRC study. J. Clin. Oncol. 42, 10.1200/JCO.2024.42.3_suppl.9 (2024).
    1. Berry, D. A. et al. Association of minimal residual disease with clinical outcome in pediatric and adult acute lymphoblastic leukemia: a meta-analysis. JAMA Oncol.3, e170580 (2017). - PMC - PubMed

Publication types

MeSH terms