

Targeted therapy guided by circulating tumor DNA analysis in advanced gastrointestinal tumors
- PMID: 39284955
- PMCID: PMC11750700
- DOI: 10.1038/s41591-024-03244-8
Targeted therapy guided by circulating tumor DNA analysis in advanced gastrointestinal tumors
Abstract
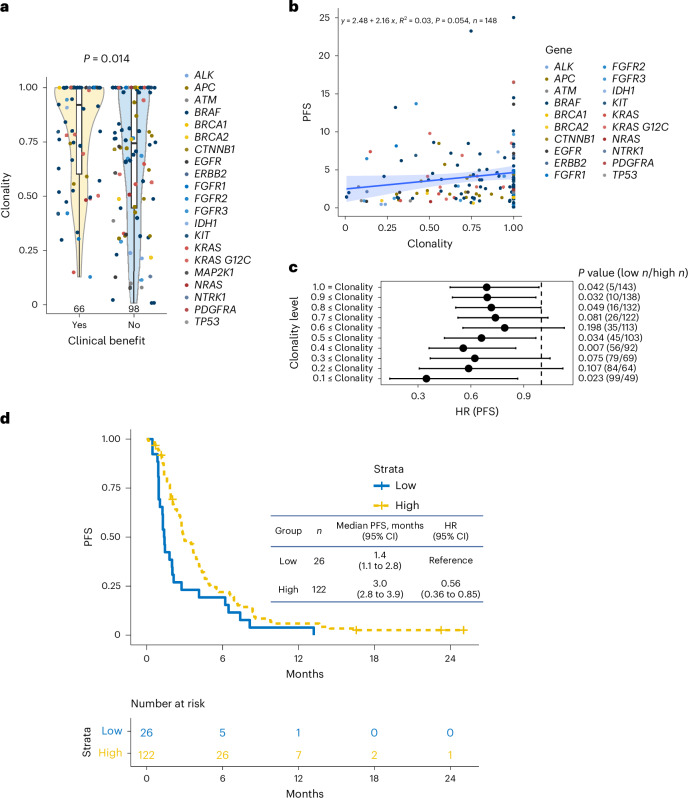
Although comprehensive genomic profiling has become standard in oncology for advanced solid tumors, the full potential of circulating tumor DNA (ctDNA)-based profiling in capturing tumor heterogeneity and guiding therapy selection remains underexploited, marked by a scarcity of evidence on its clinical impact and the assessment of intratumoral heterogeneity. The GOZILA study, a nationwide, prospective observational ctDNA profiling study, previously demonstrated higher clinical trial enrollment rates using liquid biopsy compared with tissue screening. This updated analysis of 4,037 patients further delineates the clinical utility of ctDNA profiling in advanced solid tumors, showcasing a significant enhancement in patient outcomes with a 24% match rate for targeted therapy. Patients treated with matched targeted therapy based on ctDNA profiling demonstrated significantly improved overall survival compared with those receiving unmatched therapy (hazard ratio, 0.54). Notably, biomarker clonality and adjusted plasma copy number were identified as predictors of therapeutic efficacy, reinforcing the value of ctDNA in reflecting tumor heterogeneity for precise treatment decisions. These new insights into the relationship between ctDNA characteristics and treatment outcomes advance our understanding beyond the initial enrollment benefits. Our findings advocate for the broader adoption of ctDNA-guided treatment, signifying an advancement in precision oncology and improving survival outcomes in advanced solid tumors.
© 2024. The Author(s).
Conflict of interest statement
Competing interests: Y.N. reports advisory roles with Guardant Health Pte Ltd, Natera, Inc., Roche Ltd, Seagen, Inc., Premo Partners, Inc., Daiichi Sankyo Co., Ltd, Takeda Pharmaceutical Co., Ltd, Exact Sciences Corporation and Gilead Sciences, Inc.; speakers’ bureau from Guardant Health Pte Ltd, MSD K.K., Eisai Co., Ltd, Zeria Pharmaceutical Co., Ltd, Miyarisan Pharmaceutical Co., Ltd, Merck Biopharma Co., Ltd, CareNet, Inc., Hisamitsu Pharmaceutical Co., Inc, Taiho Pharmaceutical Co., Ltd, Daiichi Sankyo Co., Ltd, Chugai Pharmaceutical Co., Ltd and Becton, Dickinson and Company, Guardant Health Japan Corp; research funding from Seagen Inc., Genomedia Inc., Guardant Health AMEA, Inc., Guardant Health, Inc., Tempus Labs, Inc., Roche Diagnostics K.K., Daiichi Sankyo Co., Ltd and Chugai Pharmaceutical Co., Ltd. H.O. declares no competing interests. M.U. reports honoraria from Taiho Pharmaceutical Co., Ltd, AstraZeneca, K.K., Yakult Honsha Co., Ltd, MSD K.K., Nihon Servier Co., Ltd, Ono Pharmaceutical Co., Ltd, Incyte Biosciences Japan GK, Chugai Pharmaceutical Co., Ltd, Boehringer Ingelheim GmbH, J-pharma Co., Ltd, Daiichi Sankyo Co., Ltd, Eisai Co., Ltd, Takeda Pharmaceutical Co., Ltd and Novartis Pharma K.K.; research funding from Taiho Pharmaceutical Co., Ltd, AstraZeneca, K.K., MSD K.K., Nihon Servier Co., Ltd, Ono Pharmaceutical Co., Ltd, Incyte Biosciences Japan GK, Chugai Pharmaceutical Co., Ltd, Boehringer Ingelheim GmbH, J-pharma Co., Ltd, Eisai Co., Ltd, Novartis Pharma K.K., Astellas Pharma Inc., J-pharma Co., Ltd, DFP (Delta Fly Pharma), Inc., Novocure GmbH and Chiome Bioscience Inc. Y.K. reports research funding from Ono Pharmaceutical Co., Ltd, Chugai Pharmaceutical Co., Ltd, Taiho Pharmaceutical Co., Ltd, Shionogi & Co., Ltd, Nippon Zoki Pharmaceutical Co., Ltd, Asahi Kasei Pharma Corporation, Nippon Kayaku Co. Ltd, Daiichi Sankyo Co., Ltd, IQVIA Services Japan K.K., MSD, Astellas Pharma Inc., National Cancer Center Japan, Syneos Health Clinical K.K., ShiftZero K.K., Parexel International Inc., Japan Clinical Cancer Research Organization, EPS Holdings, Inc., Sysmex Corporation, Public Health Research Foundation, Aichi Cancer Center and Kyushu Study Group of Clinical Cancer; honoraria from Ono Pharmaceutical Co., Ltd, Taiho Pharmaceutical Co., Ltd, Chugai Pharmaceutical Co., Ltd, Daiichi Sankyo Co., Ltd, Eli Lilly and Company, Alfresa Pharma Corporation, Astellas Pharma Inc., EA Pharma Co., Ltd, Nippon Kayaku Co. Ltd, Pfizer, Nippon Zoki Pharmaceutical Co., Ltd, Sanofi K.K., Nipro, Moroo, Boehringer Ingelheim, Hakodate National Hospital, Asahi Kasei Pharma Corporation, MSD, Zeria Pharmaceutical Co., Ltd, Bayer Yakuhin, Ltd, Yakult Honsha Co., Ltd, Sumitomo Dainippon Pharma Co., Ltd, Incyte Corporation, Merck Biopharma Co., Ltd, the Japanese Gastroenterological Association, Sapporo Minami Tokushukai Hospital and Pancan Japan. S.Y. reports honoraria from Eli Lilly Japan K.K., Chugai Pharmaceutical Co., Ltd, Taiho Pharmaceutical Co., Ltd, Daiichi Sankyo Co., Ltd, Takeda Pharmaceutical Co., Ltd, Bristol-Myers Squibb K.K., Ono Pharmaceutical Co., Ltd, Bayer Yakuhin, Ltd, MSD K.K., Merck Biopharma Co., Ltd and Nippon Boehringer Ingelheim Co., Ltd. T.E. reports research funding from MSD, Daiichi Sankyo, Pfizer, Chugai, Amgen, Ono, Astellas Amgen Biopharma, Asahikasei Pharma, ALX Oncology, Seagen, Taiho and Jazz Pharmaceuticals; honoraria from Chugai, Daiichi Sankyo and Taiho. H.T. reports research funding from Takeda Pharmaceutical Co., Ltd, Daiichi Sankyo Co., Ltd and Ono Pharmaceutical Co., Ltd; honoraria from Takeda Pharmaceutical Co., Ltd, Ono Pharmaceutical Co., Ltd, Eli Lilly Japan K.K., Merck Biopharma Co., Ltd and Chugai Pharmaceutical Co., Ltd. Y.S. reports research funding from Chugai Pharmaceutical Co., Ltd and Taiho Pharmaceutical Co., Ltd; honoraria from Eli Lilly Japan K.K., Bristol-Myers Squibb K.K., Chugai Pharmaceutical Co., Ltd, Takeda Pharmaceutical Co., Ono Pharmaceutical Co., Ltd, Merck Biopharma Co., Ltd, Taiho Pharmaceutical Co., Ltd, Bayer Yakuhin, Ltd, Daiichi Sankyo Co., Ltd, MSD K.K., Novartis Pharmaceuticals, Astellas Pharma Inc., Sysmex, and Guardant Health; participation on a Data Safety Monitoring Board or Advisory Board for Merck Biopharma Co., Ltd., Ono Pharmaceutical Co., Ltd., and Guardant Health. K. Yamaguchi reports consulting or advisory role from Bristol Myers Squibb Japan, Daiichi Sankyo; Speakers’ Bureau from Chugai Pharma, Bristol Myers Squibb Japan, Takeda, Taiho Pharmaceutical, Lilly, Ono Pharmaceutical, Daiichi Sankyo, Merck; research funding from Ono Pharmaceutical, Taiho Pharmaceutical, Daiichi Sankyo, Lilly, Gilead Sciences, Yakult Honsha, Chugai Pharma, Boehringer Ingelheim, Eisai, MSD Oncology, Sanofi, and Bristol Myers Squibb. K.K. reports consulting fees from ONO, Bristol Myers Squibb, Beigene/Novartis, AstraZeneca, Roche, BAYER, Merck & Co., Merck bio, and Janssen; honoraria from ONO and Bristol Myers Squibb, and expert testimony from ONO and Bristol Myers Squibb. T.D. reports research funding from Ono Pharmaceutical, Amgen, MSD, Pfizer, and Bristol Myers Squibb Foundation; honoraria from Daiichi-Sankyo, Ono Pharmaceutical, and Sysmex. T.N. reports honoraria from Daiichi Sankyo Co., Ltd., Ono Pharmaceutical Co., Ltd., Bristol-Myers Squibb K.K., Eli Lilly Japan K.K., Takeda Pharmaceutical Co., Ltd., Merck Biopharma Co., Ltd., Chugai Pharmaceutical Co., Ltd., Taiho Pharmaceutical Co., Ltd., and Yakult Honsha Co., Ltd. N.T. reports research funding from Ono Pharmaceutical Co.; honoraria for lectures from Ono Pharmaceutical Co., Ltd., Taiho Pharmaceutical Co., Ltd., Bristol-Myers Squibb K.K. T.S. reports research funding from Ono Pharmaceutical, Chugai-Pharmaceutical, and Yakult-Honsha; honoraria from Elli-Lilly, Daiichi-Sankyo, Ono Pharmaceutical, and Bristol-Myers. H.Y. reports research funding from MSD, Daiichi Sankyo, Ono Pharmaceutical and Astellas Pharma; honoraria from Daiichi Sankyo, Ono Pharmaceutical, Taiho Pharmaceutical, Chugai Pharma, Bristol-Myers Squibb Japan, TERUMO, Eli Lilly Japan, Merk Biopharma, Yakult Honsha, Bayer Yakuhin, and Takeda Pharmaceutical. H.S. reports research funding from Ono Pharmaceutical Co. Ltd., Taiho Pharmaceutical Co., Ltd., Takeda Pharmaceutical Co., Ltd., Asahi KASEI, and honoraria from Bayer Co., Ltd., Bristol-Myers Squibb Co., Ltd., Chugai Pharmaceutical Co., Ltd., Daiichi Sankyo Co., Ltd., Eli Lilly Japan Co., Ltd., Merck Bio Pharma Co., Ltd., MSD Co., Ltd., Ono Pharmaceutical Co., Ltd., Sanofi Co., Ltd., Taiho Pharmaceutical Co., Ltd., Takeda Co., Ltd. and Yakult Honsha Co., Ltd. E.O. reports honoraria from Ono Pharm., Chugai Pharm., Eli Lilly, Bayer, and Takeda Pharm. T.K. reports honoraria from Chugai Pharmaceutical Co., Ltd., Eli Lilly and Company, Takeda Pharmaceutical Company Limited, and Ono Pharmaceutical Co. T.O. reports research funding from Takeda Pharmaceutical Co., Ltd.; honoraria for lectures from Eli Lilly Japan K.K., Taiho Pharmaceutical Co., Ltd., Takeda Pharmaceutical Co., Ltd., Daiichi Sankyo Co., Ltd., EA Pharma Co., Ltd., Bristol-Myers Squibb K.K., Ono Pharmaceutical Co., Ltd., Eisai Co., Ltd., Yakult Honsha Co., Ltd., MSD K.K., AstraZeneca K.K., Merck Biopharma Co., Ltd., Novartis Pharma K.K., and Otsuka Pharmaceutical Co., Ltd. N.M. reports honoraria from Abbott, AMCO, Asahi Kasei Pharma, AstraZeneca, Bayer Yakuhin, Bristol-Myers Squibb, Chugai Pharm., Covidien Japan, Daiichi Sankyo, EA Pharma, Eisai, Eli Lilly Japan, Gunze Medical Limited, Johnson & Johnson, Kaken Pharm., Kyowa Kirin, MC Medical, Merck Biopharma Japan, Miyarisan Pharm., MSD, Novartis, Olympus Marketing, Ono Pharm., Stryker, Taiho Pharm., Takeda Pharm., TERUMO, Tsumura, Viatris, Yakult Honsha; research funding from Daiichi Sankyo, EP‐CRSU, EPS Corporation, MSD, Ono Pharm., ShiftZero K.K., Taiho Pharm. M.G. reports research funding from Taiho Pharmaceutical Co., Ltd, Chugai Pharmaceutical Co., Ltd and Nippon Kayaku Co., Ltd; honoraria for lectures from Ono Pharmaceutical Co., Ltd, Daiichi Sankyo Co., Ltd and MSD K.K. N.O. reports honoraria from Taiho Pharmaceutical, Bayer Yakuhin, Lilly Japan, Chugai Pharma, Ono Pharmaceutical, Eisai, Daiichi Sankyo, AstraZeneca, MSD, Incyte, Nihon Servier. K.O. declares no competing interests. K. Yamazaki reports honoraria from Chugai, Takeda, Yakult, Daiichi Sankyo, Merk Biopharma, Lily, Sanofi, Ono, MSD and Bristol. R.Y. reports expert testimony from Takeda Pharmaceutical Co., Ltd. N.I. declares no competing interests. M.Y. declares no competing interests. H.B. reports honoraria from Ono Pharmaceutical, Eli Lilly Japan and Taiho Pharmaceutical. T.Y. reports honoraria from Chugai Pharmaceutical, Takeda Pharmaceutical, Merck Biopharma, Bayer Yakuhin, Ono Pharmaceutical and MSD K.K; consulting fees from Sumitomo Corp.; and research funding from Amgen, Bristol-Myers Squibb, Chugai Pharmaceutical, Daiichi Sankyo, Eisai, FALCO Biosystems, Genomedia, Medical & Biological Laboratories, Merus N.V., Molecular Health GmbH, MSD, Nippon Boehringer Ingelheim, Ono Pharmaceutical, Pfizer Japan, Roche Diagnostics, Sanofi, Sysmex, Taiho Pharmaceutical and Takeda Pharmaceutical.
Figures


References
-
- Mosele, F. et al. Recommendations for the use of next-generation sequencing (NGS) for patients with metastatic cancers: a report from the ESMO Precision Medicine Working Group. Ann. Oncol.31, 1491–1505 (2020). - PubMed
-
- Aggarwal, C. et al. Association between availability of molecular genotyping results and overall survival in patients with advanced nonsquamous non-small-cell lung cancer. JCO Precis. Oncol.7, e2300191 (2023). - PubMed
-
- Merker, J. D. et al. Circulating tumor DNA analysis in patients with cancer: American Society of Clinical Oncology and College of American Pathologists Joint Review. J. Clin. Oncol.36, 1631–1641 (2018). - PubMed
-
- Pascual, J. et al. ESMO recommendations on the use of circulating tumour DNA assays for patients with cancer: a report from the ESMO Precision Medicine Working Group. Ann. Oncol.33, 750–768 (2022). - PubMed
MeSH terms
Substances
Grants and funding
LinkOut - more resources
Full Text Sources
