. 2024 Nov;27(11):2253-2260.
doi: 10.1038/s41593-024-01741-0. Epub 2024 Sep 16.

Neuroanatomical changes observed over the course of a human pregnancy

Affiliations

Neuroanatomical changes observed over the course of a human pregnancy

Laura Pritschet et al. Nat Neurosci. 2024 Nov.

Abstract

Pregnancy is a period of profound hormonal and physiological changes experienced by millions of women annually, yet the neural changes unfolding in the maternal brain throughout gestation are not well studied in humans. Leveraging precision imaging, we mapped neuroanatomical changes in an individual from preconception through 2 years postpartum. Pronounced decreases in gray matter volume and cortical thickness were evident across the brain, standing in contrast to increases in white matter microstructural integrity, ventricle volume and cerebrospinal fluid, with few regions untouched by the transition to motherhood. This dataset serves as a comprehensive map of the human brain across gestation, providing an open-access resource for the brain imaging community to further explore and understand the maternal brain.


Conflict of interest statement

The authors declare no competing interests.

Figures

Fig. 1
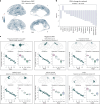
Fig. 1. Precision imaging reveals neuroanatomical changes throughout gestation.
a, Standard medical demarcations for pregnancy stages (that is, trimesters) by gestation week (the image is created with BioRender.com). b, Steroid hormones increased significantly throughout pregnancy and dropped precipitously postpartum, as is characteristic of the prenatal and postnatal periods. c, A healthy 38-year-old primiparous woman underwent 26 scanning sessions from 3 weeks preconception through 2 years postpartum. Scans were distributed throughout preconception (four scans), first trimester (four scans), second trimester (six scans), third trimester (five scans) and postpartum (seven scans); tick marks indicate when major measures were collected and colors denote pregnancy stage. The participant underwent IVF to achieve pregnancy, allowing for precise mapping of ovulation, conception and gestation week. d, Summary (that is, total) of brain measures throughout the experiment. Generalized additive models revealed GMV, CT and total brain volume decreased throughout pregnancy (see Methods for validation with cubic regression), with a slight recovery postpartum. Global QA, lateral ventricle and CSF volumes displayed nonlinear increases across gestation, with a notable rise in the second and third trimesters before dropping sharply postpartum. Shaded regions represent 95% confidence bands; solid lines indicate model fit; dashed line indicates parturition. Source data
Fig. 2
Fig. 2. Cortical GMV showed widespread change through gestation and postpartum.
a, Multivariate regression analyses reveal largely negative relationships between gestation week and regional GMV, with only a minority of regions unaffected or increasing over the gestational window (baseline—36 weeks). All associations presented here were corrected for multiple comparisons (FDR at q < 0.05; nonsignificant values set to zero for interpretability). b, Average network change was calculated by estimating GMV percent change from baseline (initial) to 36 weeks gestation (final). Attention and control networks appear most affected. c, Six representative regions, classified by major subnetworks, that exhibit pronounced GMV change across gestation. For each panel, we display a scatterplot between average GMV of the ROIs and gestation week (left; gestation sessions only, 19 scans), and summary GMV of ROIs by pregnancy stage across the whole study (right; gestation and postpartum sessions, 26 scans). Shaded regions in scatterplots represent a 95% confidence interval. Each boxplot represents IQR for each stage, with a horizontal line representing the median value. The whiskers indicate variability outside (±1.5) of this range. Outside values are >1.5× and <3× IQR beyond either end of the box. All statistical tests were corrected for multiple comparisons (FDR at q < 0.05) and values were z scored and transformed to have a mean of zero and s.d. of one for easier comparison across regions. Please note that the data values shown here are raw (see Supplementary Tables 1 and 2 and Supplementary Data 1 for exhaustive list). Brain visualizations created with R package ggseg. IQR, interquartile range; Lat, lateral; Med, medial; DMN, default mode network; VisPeri, visual peripheral network; SomMot, somatomotor network; VisCent, visual central network; Cont, control network; TempPar, temporal parietal network; DorsAttn, dorsal attention network; SalVentAttn, salience/ventral attention network. Source data
Fig. 3
Fig. 3. Subcortical GMV changed throughout gestation.
a, Multivariate regression analyses revealed largely negative relationships between gestation week and subcortical GMV regions over pregnancy, including bilateral thalamus, caudate, hippocampus, ventral diencephalon (encompassing hypothalamus, substantia nigra, mammillary body and red nucleus) and left caudate. Lateral ventricles displayed the only positive relationships with gestation week (also depicted in Fig. 1d). The whole-brain subcortical GMV estimates shown here were derived via FreeSurfer and ‘aseg’ subcortical segmentation. FDR-corrected at q < 0.05. Inset, right ventral diencephalon displayed the strongest negative association with gestation (left; baseline—36 weeks, 19 scans) and did not return to baseline postpartum (right; gestation and postpartum, 26 scans). b, The participant’s hippocampus and surrounding cortex were segmented into seven bilateral subregions. Quadratic (CA1, CA2/CA3) and linear regression analyses (PHC) revealed subfields were negatively associated with gestation week (baseline—36 weeks, 18 scans) and did not return to baseline postpartum (gestation and postpartum, 25 scans). Shaded regions in scatterplots represent a 95% confidence interval. Each boxplot represents IQR for each stage, with a horizontal line representing the median value. The whiskers indicate variability outside (±1.5) of this range. Outside values are >1.5× and <3× IQR beyond either end of the box. FDR-corrected at q < 0.05. For a and b, nonsignificant regions were set to zero for interpretability. See Supplementary Fig. 6 for complete labeling of regions in both segmentations. Brain visualizations created with R package ggseg. DC, diencephalon. Source data
Fig. 4
Fig. 4. White matter microstructure changes throughout the experiment.
a, Numerous white matter tracts demonstrate increasing QA in relation to advancing gestation week (baseline—36 weeks, 16 scans), as determined by correlational tractography analysis (FDR, q < 0.0001). See Supplementary Table 9 for complete list of tracts with a significant correlation between QA and gestation week. b, Summary of QA values by pregnancy stage (gestation and postpartum, 23 scans) for representative ROIs significantly tied to gestation. ROI-based tractometry was used to extract QA values. Each boxplot represents IQR for each stage, with a horizontal line representing the median value. The whiskers indicate variability outside (±1.5) of this range. Outside values are >1.5× and <3× IQR beyond either end of the box. Values were z scored and transformed to have a mean of zero and s.d. of one for easier comparison across individual tracts. AF, arcuate fasciculus; C, cingulum bundle; CC, corpus callosum; CPT, corticopontine tracts; CS, corticostriatal tracts; CST, corticospinal tracts; DT, dentatorubrothalamic tract; IFOF, inferior frontal occipital fasciculus; ILF, inferior longitudinal fasciculus; MLF, middle longitudinal fasciculus. Source data

Update of

References

    1. World Health Organization. Maternal, newborn, child and adolescent health and ageing. platform.who.int/data/maternal-newborn-child-adolescent-ageing (2022).
    1. Thornburg, K. L., Bagby, S. P. & Giraud, G. D. Knobil and Neill’s Physiology of Reproduction pp. 1927–1955 (Elsevier, 2015).
    1. Brunton, P. J. & Russell, J. A. The expectant brain: adapting for motherhood. Nat. Rev. Neurosci.9, 11–25 (2008). - PubMed
    1. Gregg, C. Pregnancy, prolactin and white matter regeneration. J. Neurol. Sci.285, 22–27 (2009). - PubMed
    1. Haim, A. et al. A survey of neuroimmune changes in pregnant and postpartum female rats. Brain Behav. Immun.59, 67–78 (2017). - PubMed