. 2024 Nov;27(11):2152-2166.
doi: 10.1038/s41593-024-01767-4. Epub 2024 Sep 16.

Vagus nerve stimulation recruits the central cholinergic system to enhance perceptual learning

Affiliations

Vagus nerve stimulation recruits the central cholinergic system to enhance perceptual learning

Kathleen A Martin et al. Nat Neurosci. 2024 Nov.

Abstract

Perception can be refined by experience, up to certain limits. It is unclear whether perceptual limits are absolute or could be partially overcome via enhanced neuromodulation and/or plasticity. Recent studies suggest that peripheral nerve stimulation, specifically vagus nerve stimulation (VNS), can alter neural activity and augment experience-dependent plasticity, although little is known about central mechanisms recruited by VNS. Here we developed an auditory discrimination task for mice implanted with a VNS electrode. VNS applied during behavior gradually improved discrimination abilities beyond the level achieved by training alone. Two-photon imaging revealed VNS induced changes to auditory cortical responses and activated cortically projecting cholinergic axons. Anatomical and optogenetic experiments indicated that VNS can enhance task performance through activation of the central cholinergic system. These results highlight the importance of cholinergic modulation for the efficacy of VNS and may contribute to further refinement of VNS methodology for clinical conditions.


Conflict of interest statement

Competing interests

The authors declare no competing interests.

Figures

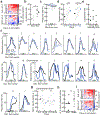
Extended Data Fig. 1 |
Extended Data Fig. 1 |. Performance is stable and does not significantly improve after seven days in stage 3.
a, Lick rates relative to tone offset from one session in six fully trained example animals (shades of gray represent individual animals). b, Lick rates in the second after tone offset (2.6±0.84 licks/s, mean±s.d., N=6 mice) are significantly higher than lick rates 2–3 seconds after tone offset (0.2±0.3 licks/s, p=0.0002, Student’s two-tailed paired t-test, N=6 mice). c, Change in performance across all frequencies throughout all days in stage 3 relative to the performance on the first three days of stage 3 (N=38 mice). d, Lack of correlation between total days animals spent in stage three and peak performance in stage 3 (Pearson’s R=0.29, p=0.08, N=38 mice). e, Distribution of days until first days of “stable” behavior for all animals (6.1±1.5 days, mean±s.d., range: 5–12). f, Average performance on first day of stable behavior ± 1 day and the second day of stable behavior ± 1 day (p=0.65, two-tailed Student’s paired t-test). Dark gray lines represent significant differences across the two days of behavior (4/38 animals, p<0.05, two-tailed Student’s paired t-test). g, Average performance for four animals with significant differences across the initial two days of stable behavior for the first day of stable behavior ± 1 day, the second day of stable behavior ± 1 day, and the last day of stable behavior for that animal ± 1 day (for all animals: p<0.05 for days 1 and 2, p<0.05 for days 1 and 3, p>0.05 for days 2 and 3, one-way ANOVA with Bonferroni correction). One animal represented with a dotted line was only trained for two days of stable performance. This animal had a consistent and significant reduction in performance across days of stable behavior (p=0.01, one-way ANOVA with Bonferroni correction). h, Across-animal performance is variable on the first day of stable behavior ± 1 day in stage three (69.8±1.2%, mean±s.e.m., N=38 animals). i, Percent reported center at each frequency relative to center stimulus on days 1–3 of stage 3, day 1 of stable behavior ± 1 day and day 2 of stable behavior ± 1 day in stage 3.
Extended Data Fig. 2 |
Extended Data Fig. 2 |. Additional training did not continue to improve performance.
a, Percent reported left for all days in stage 3 for animals trained for 21–48 days in stage 3 (36.3±12.4 days in stage 3, N=6). ND (gray) represents days with no data collection. b, Distribution of days until first days of “stable” behavior for all animals (6.8±2.6 days, mean±s.d., range: 5–12). c, Performance for all frequencies averaged across the first days of “stable” performance ± 1 day and the last three days of stage 3 (yellow, Day 1 of stable performance ± 1 day: 73.2±1.9%, mean±s.e.m.; Last three days of stage 3: 73.7±3.3%; N=6 mice; p=0.81, two-tailed Student’s paired t-test). d, Percent reported center for averaged across the first days of “stable” performance ± 1 day and the last three days of stage 3 across ± 0.25, ± 0.5, and ± 1.0 octaves from center (yellow, Day 1 of stable performance ± 1 day (±0.25): 74.9±4.7%, mean±s.e.m.; Last three days of stage 3 (±0.25): 62.4±7.8%; N=6 mice; p(±0.25)=0.054, two-tailed Student’s paired t-test; Day 1 of stable performance ± 1 day (±0.5): 47.8±4.1, mean±s.e.m.; Last three days of stage 3 (±0.5): 33.7±7.1%; N=6 mice; p(±0.5)=0.02, two-tailed Student’s paired t-test; Day 1 of stable performance ± 1 day (±1.0): 27.6±6.0%, mean±s.e.m.; Last three days of stage 3 (±1.0): 17.2±5.3%; N=6 mice; p(±1.0)=0.25, two-tailed Student’s paired t-test). Dark lines represent animals with behavior that is significantly different across the two time periods (p<0.05, two-tailed Student’s paired t-test). e, Schematic for reward size modulation experiments performed in days following performance shown in a. After animals were fully trained and had stable performance, animals received rewards of double the volume for all frequencies for 12–13 additional days. f, Performance over all frequencies over days of altered reward size. g, Average percent reported center for the five days before increased reward size and last five days on increased reward size. h, Performance across the two reward sizes (smaller reward, more trials: open circle, larger reward, fewer trials: closed circle) at 0 (small reward: 78.9±4.1% correct, for large reward: 83.5±3.3%, mean±s.e.m; p=0.15, Student’s two-tailed paired t-test), ±0.25 (small reward: 36.9±6.8% correct, large reward: 35.4±4.3%, mean± s.e.m.; p=0.67, Student’s two-tailed paired t-test), and ±0.5 (small reward: 64.2±7.0% correct, large reward: 71.4±6.3%, mean± s.e.m.; p=0.08, Student’s two-tailed paired t-test).
Extended Data Fig. 3 |
Extended Data Fig. 3 |. VNS transiently alters heart rate in viable cuffs.
a, Impedance over days post-implantation from a representative animal (top) and all 7 wild-type mice used for VNS pairing behavioral experiments. Gray, individual animals; black, mean±s.d. every 10 days (N=7 mice). b, Cuff impedance is stable over time. Impedance reading on day 0 (day of cuff implantation) and the first measurement 30+ days after implantation (30–54 days) (Day 0 mean: 2.7±0.6 kΩ, day 30–54 mean: 2.3±1.6 kΩ, mean±s.d., N=7 mice, p=0.56, Student’s two-tailed paired t-test). c, Description of vitals recordings. Sessions with and without VNS application were alternated. Between 10 and 20 VNS bouts occurred in each VNS session and lasted 500 ms at 0.1 Hz. Stimulation intensity was consistent within a recording session but was systematically changed throughout the day (ranging from 0.2 to 1.4 mA). The following data is from sessions with VNS (0.8–1.0 mA) compared to the baseline sessions immediately prior or following. d, Distribution of heart rate was not significantly different during VNS or baseline sessions in two animals with cuff impedances >100MΩ (Sham 1, cuff impedance: 100MΩ, p=0.66, Mann Whitney U two-sided test; Sham 2, cuff impedance: 120MΩ, p=0.48, Mann Whitney U two-sided test). e, Raw heart rate from example animal with viable cuff. VNS was applied at 0.1 Hz and lasted 500 ms. f, Distribution of heart rates in VNS and baseline sessions for ten animals with potentially viable cuffs (VNS significantly reduced heart rate in 7/10 animals; Animal 1, cuff impedance: 0.2 kΩ, p<10−5, Mann Whitney U two-sided test; Animal 2, cuff impedance: 3.4 kΩ, p<10−5; Animal 3, cuff impedance: 3.0 kΩ, p<10−5; Animal 4, cuff impedance: 0.1 kΩ, p=0.03; Animal 5, cuff impedance: 2.8 kΩ, p<10−5; Animal 6, cuff impedance: 3.9 kΩ, p<10−5; Animal 7, cuff impedance: 3.9 kΩ, p<10−5; Sham 3, cuff impedance: 2.1 kΩ, p>0.05; Sham 4, cuff impedance: 1.9 kΩ, p>0.05; Sham 5, cuff impedance: 3.6 kΩ, p>0.05).
Extended Data Fig. 4 |
Extended Data Fig. 4 |. Experimental and control animals have consistent behavior before VNS pairing.
a, Distribution of days in stage one for sham control (gray, 13.9±6.0 days, mean±s.d., N=10) and experimental animals (black, 10.4±4.4 days, mean±s.d., N=7, p=0.16, Mann Whitney U two-sided test). b, Distribution of days spent in stage 3 prior to VNS pairing for sham control (gray, 17.5±6.8 days, mean±s.d., N=10) and experimental mice (black, 21.1±10.6 days, mean±s.d., N=7, p=0.40, Mann Whitney U two-sided test). c, Distribution of response rate in stage 3 for sham control (gray, 96.1±5.0%, mean±s.d., N=10) and experimental animals (black, 91.3±7.5%, mean±s.d., N=7, p=0.14, Mann Whitney U two-sided test). d, Distribution of peak performance in stage 3 for sham control (gray, 73.4±6.1%, mean±s.d., N=10) and experimental animals (black, 68.7±10.0%, mean±s.d., N=7, p=0.36, Mann Whitney U two-sided test). e, Average performance across frequencies for first three days of stage 3 and first two days of stable behavior ±1 day in experimental (solid lines, mean±s.d.) and sham animals (dotted lines, mean±s.d.). f, Percent reported center for sham (dotted lines, N=10) and experimental mice (solid lines, N=7, p=0.20, two-way ANOVA with Tukey’s multiple comparisons correction). g, Example behavior trajectory of one animal through time with all major time periods labeled. h, Performance is not affected by VNS cuff implantation in experimental (−1.8±1.7%, mean±s.e.m., N=7, p=0.38, Student’s two-tailed paired t-test) or sham animal (0.4±1.0%, mean±s.e.m., N=10, p=0.68, Student’s two-tailed paired t-test; difference between sham and experimental: p=0.28, Student’s two-tailed unpaired t-test). i, Performance prior to implantation (experimental: 65.6±3.1%, N=7; sham: 67.8±1.7%, N=10; p=0.52, Student’s unpaired two-tailed t-test, mean±s.e.m.), post-implantation but prior to VNS pairing (experimental: 65.4±3.8%; sham: 68.5±2.4%; p=0.48), and after days 18–20 of VNS pairing (experimental: 77.1±3.1%; sham: 67.4±2.8%; p = 0.036). j, Total number of days spent in stage 3 is not significantly correlated with the change in performance seen throughout pairing in experimental (solid circles; Pearson’s R: −0.1, p=0.83) or sham (open circles; Pearson’s R: 0.13, p=0.73). k, Initial performance prior to the start of VNS was not significantly correlated with the change in performance seen throughout pairing in experimental (solid circles; Pearson’s R: −0.59, p=0.16) or sham (open circles; Pearson’s R: −0.31, p=0.39).
Extended Data Fig. 5 |
Extended Data Fig. 5 |. Impact of VNS pairing on experimental and control animals.
a, Change in performance in behavior for all frequencies throughout experimental VNS (N=7 mice, top) or sham (N=10, bottom) pairing over days. b, Change in response rate for three days prior to VNS onset and days 18–20 of VNS pairing for sham (gray, −7.8±2.4% response rate, mean±s.e.m., N=10) and experimental animals (black, 4.5±2.1% response rate, mean±s.e.m., N=7, p=0.002, Student’s two-tailed unpaired t-test). c, Response rate across frequencies for the three days prior to VNS onset (black) and on days 18–20 of VNS pairing (blue) for experimental animals (p=0.32 across frequencies, p=0.001 across days, two-way ANOVA with Tukey’s multiple comparisons correction). d, Percent correct on final days of VNS pairing (Days 18–20) across all frequencies in experimental animals (blue, closed circles, without: 80.4±2.4%, mean±s.e.m., with: 77.1±3.1%, N=7) in comparison to the behavior three days prior to VNS (black, closed circles, ‘Day −2–0’, without: 71.6±3.5%, with: 65.4±3.8%) with (p=0.008, Student’s paired two-tailed t-test) and without no-response trials (without: p=0.02). e, Change in response rate for the three days prior to VNS onset and days 18–20 of VNS pairing across three groups of intensities used for control animals (p=0.4, N=10). f, Percent of trials reported as center for all animals in VNS pairing experiments for three days prior to VNS onset (black) and days 18–20 of VNS pairing (blue) used in Figs. 2 and 3 (Control: N=10, dotted lines; Experimental: N=7, solid lines). g, Percent reported center normalized by performance at the center frequency at ±1.0 octave frequency from center prior to VNS pairing onset (black, Days −2–0) compared to final days of VNS pairing (blue, Days 18–20) in experimental animals (solid lines, closed circles, Days −2–0: 60.5±8.1%, Days 18–20: 41.5±8.5%, mean±s.e.m., p=0.065, Student’s two-tailed paired t-test) and sham control animals (dotted lines, open circles, Days −2–0: 50.2±6.7%, Days 18–20: 53.5±7.2%, mean±s.e.m., p=0.66, Student’s two-tailed paired t-test). h, Difference in normalized percent reported center at ±1.0 octave from center for experimental (closed circles, difference at ±1.0: −18.9±8.4%, mean±s.e.m.) and control mice (open circles, difference at ±1.0: 3.2±7.1%, mean±s.e.m.; p=0.062, Student’s two-tailed unpaired t-test). i, Change in performance for all frequencies in block one of behavior throughout experimental VNS (N=7, top) or sham (N=10 mice, bottom) VNS pairing over days.
Extended Data Fig. 6 |
Extended Data Fig. 6 |. Tracking neurons during two-photon imaging.
a, Example ROIs in an example animal during unpaired passive tone presentation on days 0, 3, 6, 9 and 11 days of VNS pairing. Average Pearson’s R correlation for 20×20 pixel area containing ROIs and surrounding area across all days. b, Average Pearson’s R correlation for 20×20 pixel area containing ROIs and surrounding area across all days of passive tone presentation (“Imaging days”) for all VNS pairing animals (N=7; Average R (animal 1): 0.59±0.15, mean±s.d.; Average R (animal 2): 0.67±0.12; Average R (animal 3): 0.69±0.08; Average R (animal 4): 0.52±0.18; Average R (animal 5): 0.69±0.13; Average R (animal 6): 0.61±0.15; Average R (animal 7): 0.57±0.19).
Extended Data Fig. 7 |
Extended Data Fig. 7 |. Activation of basal forebrain cholinergic neurons by VNS.
a, Correlation between baseline activity of cholinergic cell bodies in 1.5s prior to VNS onset and average activity in 1.5s following VNS onset (Pearson’s R=−0.30, p=0.02, N=3 mice, n=60 trials). b, Cholinergic cell body responses prior to or during VNS separated by baseline responses (higher than zero or lower than or equal to zero). Responses in 500 ms after VNS were significantly higher in trials with low baseline (during VNS: 0.47±0.16% ΔF/F, p=0.006, Student’s two-tailed t-test) but not during trials with high baseline (during VNS: −0.21±0.19% ΔF/F, p=0.26, Student’s two-tailed t-test). c, Example basal forebrain and NTS section with alignment to corresponding output from QuickNII system of Allen Brain Atlas section with either basal forebrain or NTS circled in white. d, Schematic for mapping inputs to cholinergic basal forebrain neurons using retrograde, Cre-dependent, pseudotyped monosynaptic rabies. Location of mCherry labeled neurons in section containing LC labeled by dots in shades of gray. The region of interest is highlighted in red. Each animal is represented in a distinct shade of gray (N=5). e, Schematic of injection of retrograde Cre-dependent tdTomato into basal forebrain of TH-Cre mice. Location of tdTomato labeled neurons in section containing NTS labeled by dots in shades of gray. The region of interest is highlighted in red. Each animal is represented in a distinct shade of gray (N=4). f, Schematic of proposed anatomical connections between NTS, locus coeruleus and basal forebrain. g, Correlation between baseline cholinergic axon activity in 1s prior to VNS onset and average activity in the 1s following VNS onset (Pearson’s R=0.04, p=0.71).
Extended Data Fig. 8 |
Extended Data Fig. 8 |. Impact of stimulating auditory cortical-projecting cholinergic neurons on individual animal performance.
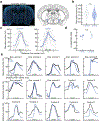
a, Verification of fiber placement over basal forebrain in one example animal. Scale bar is 1200 μm. b, Distribution of peak performance prior to optogenetic pairing onset of control (open circles, 77.1±2.5% correct, mean±s.e.m.) and experimental animals (‘ChR2’, closed circles, 72.1±2.8% correct, mean ± s.e.m., p=0.15, Mann Whitney U two-sided test). c, Percent of trials reported center for control (dotted lines, mean in blue, individual animals in gray, N=7) and experimental animals (solid lines, mean in blue, individual animals in gray, N=8). d, Difference in response rate in the three days prior to optogenetic or sham pairing and on the last three days of optogenetic or sham pairing in control (open circles, −0.28±7.5% change in response rate, mean±s.e.m, N=7) or experimental animals (closed circles, −1.7±1.8% change in response rate, mean±s.e.m., N=8, p=0.86, Student’s two-tailed unpaired t-test). e, Percent of trials reported as center for 15 animals in Fig. 6 for the three days prior to optogenetic or sham pairing onset (black) and on the last three days with optogenetic or sham pairing (blue). Experimental animals are represented with solid lines and sham animals are represented with dotted lines.
Extended Data Fig. 9 |
Extended Data Fig. 9 |. Optical stimulation of different wavelengths had no effect on resting membrane potential or excitability in basal forebrain cholinergic neurons.
a, Verification of fiber placement over basal forebrain in one example animal. Scale bar, 1200 μm. b, Schematic of slice recording set up. Each ChAT-Cre animal was injected with Cre-dependent eYFP and sectioned three weeks later. eYFP+ neurons were targeted for whole-cell recordings. Each cell was exposed to three trials of blue light at 30 Hz with a 5 ms light pulse for 500 ms to emulate optogenetic stimulation, followed by three trials with a constant block of green light of 500 ms to emulate optogenetic inhibition. c, Two example cells recorded in current-clamp during light exposure to 470 nm (blue) and 520 nm (orange). One cell did not spontaneously fire action potentials (left), one cell did fire spontaneously (right). In neither case did optical stimulation affect membrane potential responses, synaptic activity, or spiking. Blue dashes indicate timing of blue light train stimulation. Scale bars, 5 mV and 100 ms. d, Average resting membrane potential (Vm) for 500 ms bins prior to, during, and after light stimulation of 470 nm (blue, pre: −54.7±4.6 mV, light on: −54.9±4.4 mV, post: −54.6±4.6 mV, mean±s.e.m, n=5 cells, p=0.32, one-way ANOVA with Bonferroni correction) or 520 nm (orange, pre: −54.7±5.0 mV, light on: −54.6±5.0 mV, post: −54.7±4.9 mV, n=5 cells, p=0.62). e, No change in average Vm across different wavelengths of light compared to baseline prior to light exposure (470 nm: −0.3±0.3 mV mean±s.e.m; 520 nm: 0.1±0.1 mV, p=0.35, two-way Student’s paired t-test, n=5 cells).
Extended Data Fig. 10 |
Extended Data Fig. 10 |. Impact of inhibiting cholinergic neurons in basal forebrain during VNS on individual animal performance.
a, Description of vitals recordings. Sessions with and without VNS application were alternated. Between 10 and 20 VNS bouts occurred in each VNS session and lasted 500 ms at 0.1 Hz. Stimulation intensity was consistent within a session but was systematically changed throughout the day (ranging from 0.2 to 1.4 mA). The following data is from sessions with VNS (0.8–1.0 mA) compared to the baseline sessions immediately prior or following. b, Example baseline and VNS session from example animal. c, Distribution of heart rates in VNS (blue) and baseline (gray) sessions for six animals with potentially viable cuffs (p<0.001, Mann Whitney U two-sided test). d, Difference in response rate in the three days prior to VNS pairing and on day 18–20 of VNS pairing with inhibition of cholinergic basal forebrain neurons (1.4±3.3% change in response rate, mean±s.e.m, N=6 mice). e, Change in performance in behavior for all frequencies throughout VNS pairing with Arch stimulation of cholinergic neurons over days. f, Percent of trials reported as center for 6 animals in Fig. 7 for the three days prior to VNS onset (black) and days 18–20 of VNS stimulation (orange).
Fig. 1 |
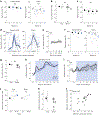
Fig. 1 |. 2AFC task.
a, Behavior. Mice were trained to classify tones as center (green, left licks) or noncenter (gray, right licks) for water reward. ITI, inter-trial interval. b, Center frequency (11.3–16.0 kHz) rewarded if animal licked left; noncenter frequency (±0.25–1.5 octaves from center) rewarded if animal licked right. A single noncenter frequency either −1.5 or 1.5 octaves from the center tone was used in stage 1, the other ±1.5 octave frequency was added in stage 2 and all other stimuli were added in stage 3. Dist, distance. c, Example wild-type male performance. Error bars show binomial confidence intervals. d, Performance for all animals relative to day 1 of stage 2 (n = 38 mice). Heat map, %correct. Gray, no data (ND); animals not trained. e, Days in stage 1 (median 10 days, interquartile range 7–13 days). Open circles, wild-type females (n = 5); filled circles, wild-type males (n = 11); open squares, ChAT-Cre females (n = 8); filled squares, ChAT-Cre males (n = 14). f, %correct for all frequencies in stage 3 for example animal. Yellow, slopes between −1.0–1.0% Δ performance. g, Average slope (Δ % performance per day) for each animal over days of stage 3. Light gray, individual animals; black, mean ± s.d. (n = 38 mice). h, Distribution of all slopes across all animals per stage 3 days. Stable slopes highlighted in yellow. i, Performance for all frequencies averaged across days 1–3 of stage 3 (blue, days 1–3 of stage 3: 64.7 ± 1.0%, mean ± s.e.m., n = 38 mice) and first 2 days of ‘stable’ performance ±1 day (yellow, day 1 of stable performance ± 1 day: 69.8 ± 1.2%, mean ± s.e.m.; day 2 of stable performance ± 1 day: 69.5 ± 1.2%; n = 38 mice; P = 0.003, one-way ANOVA, Bonferroni correction). j, %reported center across all stimuli on day 1 of stage 3 (dotted lines) and day of maximum performance (solid lines). Gray lines, individual mice. Colored circles, means. k, Percent of trials reported center for the three frequencies closest to center (±0.25, ±0.5 and ±1.0 octaves from center) over the first 11 days of stage 3. Light gray, individual animals; black, mean ± s.d. (n = 38 mice). l, %reported center across days 1–3 of stage 3 (blue) and first 2 days of stable performance ±1 day for ±0.25–1.0 octaves from center (day 1 stage 3 (±0.25): 79.2 ± 2.4%, mean ± s.e.m.; day 1 stable performance (±0.25): 70.7 ± 2.9%; day 2 stable performance (±0.25): 73.0 ± 2.7%; n = 38 mice, P = 0.74, one-way ANOVA, Bonferroni correction; day 1 stage 3 (±0.5): 69.8 ± 2.9%; day 1 stable performance (±0.5): 54.3 ± 3.0%; day 2 stable performance (±0.5): 58.2 ± 2.7%; P = 0.0006; day 1 stage 3 (±1.0): 42.9 ± 3.1%; day 1 stable performance (±1.0): 27.0 ± 2.5%; day 2 stable performance (±1.0): 30.3 ± 2.8%; P = 0.0003). NS, not significant. *P < 0.05.
Fig. 2 |
Fig. 2 |. VNS improves perception over days.
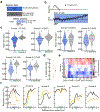
a, Cuff electrode implantation. b, VNS was performed in two blocks of 50 trials (blue, blocks 2 and 4) between blocks without stimulation (gray, blocks 1, 3 and 5). VNS parameters: 500 ms duration, 30 Hz rate, 0.6–0.8 mA intensity, flanking tone on each trial. c, VNS pairing during behavior gradually improved performance over days; lines indicate mean ± s.d. (n = 7 mice). Exp, solid line; sham, dotted line. d, Performance over all stimuli improved after VNS pairing (filled circles; prepairing: 65.4 ± 3.8%, 18–20 days post-pairing: 77.1 ± 3.1%, mean ± s.e.m., n = 7 mice, P = 0.008, Student’s two-tailed paired t-test), but not in sham-stimulated animals (open circles; pre-sham-stim: 68.5 ± 2.5%, 18–20 days post-sham-stim: 67.4 ± 2.8%, n = 10 mice, P = 0.65). e, Difference in performance on days 18–20 compared to 3 days before pairing in experimental VNS-paired animals (closed circles, 11.7 ± 3.0%, mean ± s.e.m., n = 7) versus sham animals (open circles, −1.1 ± 2.4%, n = 10, P = 0.004, Student’s one-tailed unpaired t-test). f, %reported center at each frequency relative to center stimulus on 3 days before VNS (black, ‘days −2–0’, n = 7 mice) and behavior on final VNS pairing days (blue, ‘days 18–20’). Lines, mean ± s.d. g, %correct at center frequency increased on final days of VNS pairing (blue, days 18–20: 84.9 ± 5.0%, mean ± s.e.m.) compared to 3 days before pairing (black, days −2–0: 71.6 ± 7.0%, P = 0.02, Student’s two-tailed paired t-test). %correct at center frequency was not different on final days of sham pairing (P = 0.76). h, Difference in %correct at center on days 18–20 of VNS or sham pairing from baseline in experimental animals (closed circles, 13.2 ± 4.4%, mean ± s.e.m., n = 7) versus sham (open circles, −1.6 ± 4.9%, mean ± s.e.m., n = 10, P = 0.025, Student’s one-tailed unpaired t-test). i, Average %reported center errors at ±0.25 (dark gray) and ±0.5 (medium gray) octaves (normalized by performance at center) reduced over days of stimulation (shaded blue) in experimental animals (solid line, n = 7), but not sham (dotted line, n = 10). Lines, mean ± s.d. Norm, normalized. j, %reported center errors at ±0.25 octaves (normalized by center performance) were reduced over days after VNS pairing (days −2–0: 91.6 ± 7.0%, days 18–20: 67.2 ± 8.1%, mean ± s.e.m., P = 0.04, Student’s two-tailed paired t-test), but not sham (days −2–0: 95.3 ± 3.9%, days 18–20: 87.2 ± 4.7%, P = 0.13). k, %reported center errors at ±0.5 octaves (normalized by center performance) were reduced over days by VNS pairing in experimental animals (days −2–0: 78.8 ± 7.1%, days 18–20: 49.2 ± 6.8%, mean ± s.e.m., P = 0.01, Student’s two-tailed paired t-test), but not sham (days −2–0: 74.8 ± 5.1%, days 18–20: 75.9 ± 6.4%, P = 0.81). l, Difference in normalized %reported center errors at ±0.25, ±0.5 octaves for sham (open circles, difference at ±0.25: −8.1 ± 4.9%, difference at ±0.5: 1.1 ± 4.6%, mean ± s.e.m.) and experimental animals (closed circles, difference at ±0.25: −24.3.1 ± 9.2%, P = 0.06, Student’s one-tailed unpaired t-test; difference at ±0.5: −29.6 ± 8.6%, P = 0.002). *P < 0.05.
Fig. 3 |
Fig. 3 |. VNS induces long-lasting behavioral improvements.
a, Stable performance during blocks 1–4 on final 3 days in VNS-paired animals (VNS blocks, blue; no VNS blocks, black; block 1: 79.5 ± 3.2% correct, mean ± s.e.m., block 2: 79.1 ± 1.9%, block 3: 77.6 ± 3.4%, block 4: 75.8 ± 2.5%; P = 0.78, one-way ANOVA, Tukey’s multiple comparisons correction, n = 7 mice) versus sham (block 1: 73.3 ± 2.7% correct, block 2: 65.5 ± 4.6%, block 3: 70.9 ± 3.5%, block 4: 64.9 ± 4.8%; P = 0.37, n = 10 mice). b, Difference in performance across blocks with and without VNS for experimental (average difference: −1.1 ± 1.3%, mean ± s.e.m.) and sham animals (average difference: −6.9 ± 3.8%, P = 0.23, Student’s two-tailed unpaired t-test). c, Performance for all stimuli was stable across blocks 1–4 before VNS (block 1: 68.0 ± 4.3% correct, mean ± s.e.m., block 2: 63.9 ± 3.6%, block 3: 63.1 ± 3.7%, block 4: 63.7 ± 3.4%; P = 0.78, one-way ANOVA with Tukey’s multiple comparisons correction; n = 7 mice). d, %reported center at each frequency relative to center on the final days of stimulation in blocks with VNS (blue: blocks 2 and 4) or without (black: blocks 1 and 3) in VNS-paired (solid lines) and sham-stimulated mice (dotted lines). e, Difference in performance in blocks with/without VNS at each frequency relative to center for experimental (solid line) and control animals (dotted line; P = 0.28 for frequencies, P = 0.11 for experimental group, two-way ANOVA with Tukey’s multiple comparisons correction). f, Response rate across blocks 1–4 on the final 3 days in VNS animals (block 1: 97.1 ± 2.0% correct, mean ± s.e.m., block 2: 98.2 ± 1.6%, block 3: 95.0 ± 3.0%, block 4: 95.5 ± 2.8%; P = 0.77, one-way ANOVA with Tukey’s multiple comparisons correction; n = 7 mice) and sham animals (block 1: 96.7 ± 1.6% correct, block 2: 91.9 ± 3.8%, block 3: 93.9 ± 2.1%, block 4: 85.7 ± 5.7%; P = 0.20, n = 10 mice). g, Difference in response rate across blocks for VNS-paired (closed circles, average difference: 0.9 ± 1.1%, mean ± s.e.m.) and sham animals (open circles, average difference: −6.5 ± 3.7%, P = 0.13, Student’s two-tailed unpaired t-test). h, Mean change in %correct relative to three baseline days for all stimuli in block 1 and subsequent blocks for example animal. i, Summary of change in %correct for all stimuli in block 1 (n = 7 mice). j, Performance in block 1 during baseline sessions (black, ‘days −2–0’) compared to final days of stimulation (blue, ‘days 18–20’) in VNS-paired (days −2–0: 68.0 ± 4.3%, mean ± s.e.m., days 18–20: 79.5 ± 3.2%, P = 0.03, Student’s two-tailed paired t-test, n = 7 mice) and sham animals (days −2–0: 69.5 ± 1.9%, days 18–20: 73.3 ± 2.7%, P = 0.17, n = 10 mice). k, Difference in block 1 performance between days −2–0 and days 18–20 in experimental (11.5 ± 4.1%, mean ± s.e.m.) and control animals (3.8 ± 2.6%, P = 0.057, Student’s one-tailed unpaired t-test). l, Correlation between performance change in block 1 and subsequent blocks in experimental (closed circles, Pearson’s R = 0.89, P = 0.008, n = 7) and control animals (open circles, R = 0.57, P = 0.09, n = 10). *P < 0.05.
Fig. 4 |
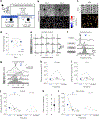
Fig. 4 |. VNS enables cortical plasticity.
a, VNS-tone pairing and two-photon imaging of auditory cortex excitatory neurons. PF, paired frequency. b, Example imaging region. ROIs colored for best frequency evoked by passive tone presentation on day 0 (before VNS-tone pairing) and day 3 (after three days of VNS-tone pairing). Initial best frequency (‘pre-peak’, black-outlined arrowhead), pairing frequency (‘P’, blue arrowhead) and frequency ±1 octave from paired frequency (‘±1’, gray-outlined arrowhead) indicated on colorbar. c, ROIs tracked across 5 days of passive tone presentation (top) and spatial overlap (bottom); colors represent different imaging days. d, Significantly responsive neurons after 5 days of VNS pairing (n = 7 mice, n = 145.3 ± 20.5 neurons per animals) or sham stimulation (n = 4 mice, n = 192 ± 35.8 neurons per animal). e, Example neuron passive tone responses, after 5 or 12 days VNS-tone pairing. Paired tone: 16 kHz. Gray, single trials; black, mean. f, Example passive tuning profiles before/after VNS pairing. g, %responsive neurons before/after VNS pairing with 22.7 kHz for this animal. h, No change in %responsive neurons 15 min after VNS pairing (P = 0.21; one-way ANOVA with Tukey’s multiple comparisons correction) at pre-peak (−31.4 ± 29.9%; mean ± s.d.; n = 9 mice, n = 1,303 neurons, 144.8 ± 33.2 neurons per animal, mean ± s.d.), paired frequency (blue; 4.4 ± 75.7%) and ±1 octave from paired frequency (gray; 59.3 ± 164.1%). Dark gray, animal from g. i, No change in %responsive neurons 2 h after VNS pairing (n = 9 mice, n = 1,303 neurons, 144.8 ± 33.2 neurons per animal, P = 0.29) at pre-peak (−9.0 ± 52.9%; mean ± s.d.), paired frequency (blue; 14.1 ± 110.0%) and ±1 octave from paired frequency (gray; 64.8 ± 119.5%). j, Change in %responsive at day 5 of pairing for experimental (paired: 113.3 ± 132.2%, mean ± s.d.; pre-peak: −38.4 ± 29.4%; ±1 octave: 57.9 ± 133.4%; n = 7 mice, n = 953 total neurons, 136.1 ± 16.5 neurons per animal; P = 0.05; one-way ANOVA with Tukey’s multiple comparisons correction) but not sham animals (paired: −28.0 ± 68.5%, pre-peak: −50.4 ± 19.0%; ±1 octave: 38.2 ± 188.9%; n = 4 mice, n = 737 neurons total, 184.3 ± 37.1 neurons per animal; P = 0.56). k, Distribution of days to maximum response at paired frequency (4.9 ± 3.5 days; mean ± s.d.; n = 7 mice). Gray circle, animal in g. l, Change in %responsive at day of maximum population response to paired frequency (‘Pre-peak’, black), paired frequency (blue), and frequency one octave away from the paired frequency (±1, gray) for experimental (paired: 263.2 ± 295.2%, mean ± s.d.; pre-peak: −31.3 ± 19.4%; Freq ±1: 22.3 ± 105.1%; n = 7 mice, n = 934 neurons total, 133.4 ± 15.5 neurons per animal; P = 0.02; one-way ANOVA with Tukey’s multiple comparisons correction) and sham animals (paired: 82.0 ± 33.6%, mean ± s.d.; pre-peak: −28.7 ± 30.1%; Freq ±1: 100.1 ± 163.8%; mean ± s.d., n = 4 mice, n = 750 neurons total, 187.5 ± 43.8 neurons per animal; P = 0.19; one-way ANOVA with Tukey’s multiple comparisons correction). Day of maximum population response determined for individual animals in k. *P < 0.05.
Fig. 5 |
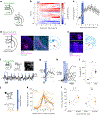
Fig. 5 |. VNS activates auditory cortical-projecting cholinergic basal forebrain.
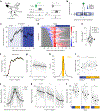
a, Photometry from cholinergic basal forebrain neurons. b, ΔF/F from VNS for example animal. VNS was applied for 500 ms at 30 Hz at 1.0 mA every 10 s. c, Average ΔF/F for all VNS trials across animals with mean baseline ΔF/F less than zero (n = 3 mice; n = 36 trials). d, Mapping inputs to cholinergic basal forebrain neurons using retrograde, Cre-dependent, pseudotyped monosynaptic rabies. Example injection area in basal forebrain, corresponding section from the Allen Brain Atlas, and location of green fluorescent protein (GFP)-labeled neurons. Red, regions of interest. Each animal is represented in a distinct shade of gray (n = 3 mice). Scale bar, 200 μm. e, Location of mCherry labeled neurons in section containing NTS labeled by dots in shades of gray. Each animal is represented in a distinct shade of gray (n = 6 mice). Scale bar, 200 μm. f, Imaging of basal forebrain cholinergic axons in auditory cortex. Trace of fluorescent activity from example region. VNS applied for 500 ms at 30 Hz at 0.8 mA every 20 s. Scale bar, 100 μm. g, VNS triggered response from all trials in one example region. Example animal is the same shown in f. h, Mean ΔF/F relative to VNS onset across all VNS applications in all regions for each animal (n = 6 mice, 16.5 ± 6.3 regions per animal, mean ± s.d., n = 270 trials). VNS was applied for 500 ms at 30 Hz at 0.8–1.0 mA every 2.5–26.7 s. i, Average ΔF/F for 1 s baseline before VNS onset and 1 s following VNS onset (shaded in light blue in h, n = 6 mice, VNS: 128.7 ± 36.4% ΔF/F, mean ± s.e.m., P = 0.02, Student’s two-tailed paired t-test). j, Schematic for local injection of either atropine (orange) or vehicle (gray, control) in auditory cortex after 20 days of VNS pairing during behavior. After local injection, VNS was applied during behavior in the same manner as described in Fig. 2. k, %reported center across all frequencies for either atropine (individual animals in light orange, mean in darker orange) or vehicle (individual animals in light gray, mean in darker gray). l, Normalized percent reported center for atropine or vehicle at frequencies ±0.25 (atropine: orange, 91.0 ± 24.5%, mean ± s.d.; vehicle: gray, 63.3 ± 26.4%, mean ± s.d., n = 5, P = 0.03, Student’s one-tailed paired t-test) and ±0.5 from center (atropine: orange, 69.5 ± 48.0%, mean ± s.d.; vehicle: gray, 57.0 ± 20.2%, mean ± s.d., n = 5 mice, P = 0.21, Student’s one-tailed paired t-test). DAPI, 4,6-diamidino-2-phenylindole; NS, not significant; *P < 0.05.
Fig. 6 |
Fig. 6 |. Cortical-projecting cholinergic modulation improves performance.
a, Optogenetic activation of cortically projecting cholinergic BF neurons during behavior in ChAT-Cre mice. b, Optogenetically activating ChAT+ BF neurons during behavior gradually improved performance over days; lines indicate mean ± s.d. (n = 8 mice). ChR2, solid line; control, dotted line. c, Performance improved after optogenetic pairing in experimental (closed circles; baseline performance: 71.1 ± 3.1%, post-pairing: 76.3 ± 2.8%, mean ± s.e.m., n = 8 mice, P = 0.01, Student’s two-tailed paired t-test) but not control animals (open circles; baseline performance: 74.8 ± 2.5%, post-sham-pairing: 75.6 ± 3.0%, n = 7 mice, P = 0.67). d, Performance change (optogenetic pairing: 5.3 ± 1.6%, mean ± s.e.m., n = 8 mice; controls: 0.8 ± 1.7%, n = 7 mice, P = 0.04, Student’s one-tailed unpaired t-test). e, Performance before/after optogenetic pairing or sham stimulation. f, %reported center errors (normalized by center frequency performance) at ±0.25 octaves were not reduced by optogenetic pairing (experimental animals, days −2–0: 84.6 ± 6.4%, last 3 days: 83.6 ± 6.9%, mean ± s.e.m., P = 0.67, Student’s two-tailed paired t-test; control animals, days −2–0: 87.5 ± 4.8%, last 3 days: 86.2 ± 5.0%, P = 0.56). g, %reported center errors (normalized by center performance) at ±0.5 octaves were reduced by optogenetic pairing (experimental animals, days −2–0: 70.9 ± 7.9%, last 3 days: 58.9 ± 9.7%, mean ± s.e.m., P = 0.04, Student’s two-tailed paired t-test; control animals, days −2–0: 62.9 ± 7.2%, last 3 days: 61.3 ± 5.3%, P = 0.80). h, %reported center errors (normalized by center performance) at ±1 octave were not reduced by optogenetic pairing (experimental animals, days −2–0: 47.5 ± 9.0%, last 3 days: 33.5 ± 6.8%, mean ± s.e.m., P = 0.04, Student’s two-tailed paired t-test; control animals, days −2–0: 30.7 ± 5.9%, last 3 days: 34.4 ± 10.2%, P = 0.55). i, Difference in normalized %reported center errors at ±0.5, ±1 octaves from center for control animals (open circles, difference at ±0.5: −1.6 ± 5.8%, difference at ±1: 3.8 ± 5.9%, mean ± s.e.m.) and experimental animals (closed circles, difference at ±0.5: −12.0 ± 4.8%, P = 0.09; difference at ±1: −14.0 ± 5.5%, P = 0.02, Student’s one-tailed unpaired t-test). j, Stable performance across blocks 1–4 (P = 0.99, one-way ANOVA with Tukey’s multiple comparisons correction; n = 8 mice). k, Stable response rate across blocks 1–4 (P = 0.99). l, Block 1 performance was similar before/after optogenetic pairing (black, days −2–0: 72.6 ± 3.5%, mean ± s.e.m.; blue, last 3 days: 74.7 ± 2.6%, P = 0.50, Student’s two-tailed paired t-test, n = 8 mice). Only one of eight animals showed a significant difference (P < 0.05, Student’s two-tailed paired t-test) on days −2–0 before versus after pairing (bold line). Performance in block 1 during baseline sessions before optogenetic pairing onset (black, days −2–0: 71.8 ± 2.8%, mean ± s.e.m.) compared to performance on the final 3 days of optogenetic pairing in control animals (blue, last 3: 76.0 ± 2.7%, P = 0.12, Student’s two-tailed paired t-test, n = 8). m, Correlation between change in performance in block 1 and all subsequent blocks (for experimental animals: Pearson’s R = 0.69, P = 0.06, n = 8 mice; for control animals: R = 0.38, P = 0.40, n = 7 mice). *P < 0.05.
Fig. 7 |
Fig. 7 |. Inhibiting cholinergic basal forebrain neurons during VNS blunts perceptual improvements.
a, Schematic of VNS and optogenetic inhibition of cholinergic BF neurons during behavior. Cholinergic BF neurons were optogenetically inhibited using a Cre-dependent archaerhodopsin and yellow/green light (565 nm) for the entire duration of VNS during behavior (500 ms). b, Optogenetic inhibition of ChAT+ BF neurons during VNS (yellow, n = 6 mice) during behavior abolishes improved performance seen with VNS only (blue, n = 7 mice); lines indicate mean ± s.d. c, Performance did not improve after optogenetic inhibition during VNS. Percent correct on the final 3 days of optogenetic inhibition during VNS (days 18–20; yellow; 62.7 ± 2.3%, mean ± s.e.m., n = 6 mice) in comparison to the behavior 3 days before VNS (black; 62.2 ± 2.3%, P = 0.79, Student’s two-tailed paired t-test). d, Difference in performance on days 18–20 of VNS pairing relative to 3 days before pairing onset for animals receiving VNS with optogenetic inhibition of cholinergic basal forebrain neurons (yellow, 0.5 ± 1.7%, mean ± s.e.m., n = 6 mice) or without (blue, 11.7 ± 3.0%, mean ± s.e.m., n = 7 mice, P = 0.01, Student’s two-tailed unpaired t-test). e, %reported center at each frequency relative to center stimulus on the 3 days before start of optogenetic inhibition with VNS pairing onset (black) and the final three days of pairing (yellow, days 18–20, n = 6 mice). f, %reported center errors at ±0.25 and ±0.5 octaves (normalized by center performance) were not reduced over days before VNS pairing onset (black, days −2–0 (±0.25): 97.6 ± 2.5%, days −2–0 (±0.5): 84.3 ± 6.3%, mean ± s.e.m.) compared to the final days of VNS pairing (yellow, days 18–20 (±0.25): 94.5 ± 1.8%, days 18–20 (±0.5): 79.8 ± 6.5%, P(±0.25) = 0.15, P(±0.5) = 0.33, Student’s two-tailed paired t-test). g, Difference in normalized %reported center at ±0.25 and ±0.5 octaves from center for animals with optogenetic inhibition of cholinergic basal forebrain neurons during VNS pairing (yellow, difference at ±0.25: −3.1 ± 1.8%, difference at ±0.5: −4.5 ± 4.2%, mean ± s.e.m.) or without (blue, difference at ±0.25: −24.3 ± 9.2%, difference at ±0.5: −29.6 ± 8.6%, mean ± s.e.m., for ±0.25: P = 0.04, for ±0.5: P = 0.03, Student’s one-tailed unpaired t-test). h, Performance in block 1 during baseline sessions before pairing onset (black, days −2–0: 62.4 ± 3.4%, mean ± s.e.m.) compared to performance on the final days of VNS and optogenetic inhibition of cholinergic basal forebrain neuron pairing (yellow, days 18–20: 65.8 ± 3.4%, P = 0.15, Student’s two-tailed paired t-test, n =6). i, Correlation between change in performance in block 1 and all subsequent blocks (Pearson’s R = −0.26, P = 0.63, n = 6 mice). *P < 0.05.

References

    1. Fu Y-X et al. Temporal specificity in the cortical plasticity of visual space representation. Science 296, 1999–2003 (2002). - PubMed
    1. Gilbert CD, Li W & Piech V Perceptual learning and adult cortical plasticity. J. Physiol 587, 2743–2751 (2009). - PMC - PubMed
    1. Khan AG et al. Distinct learning-induced changes in stimulus selectivity and interactions of GABAergic interneuron classes in visual cortex. Nat. Neurosci 21, 851–859 (2018). - PMC - PubMed
    1. Poort J et al. Learning enhances sensory and multiple non-sensory representations in primary visual cortex. Neuron 86, 1478–1490 (2015). - PMC - PubMed
    1. Schoups A, Vogels R, Qian N & Orban G Practising orientation identification improves orientation coding in V1 neurons. Nature 412, 549–553 (2001). - PubMed

LinkOut - more resources