. 2024 Nov;27(11):2167-2177.
doi: 10.1038/s41593-024-01755-8. Epub 2024 Sep 16.

Tonic and burst-like locus coeruleus stimulation distinctly shift network activity across the cortical hierarchy

Affiliations

Tonic and burst-like locus coeruleus stimulation distinctly shift network activity across the cortical hierarchy

Christina Grimm et al. Nat Neurosci. 2024 Nov.

Abstract

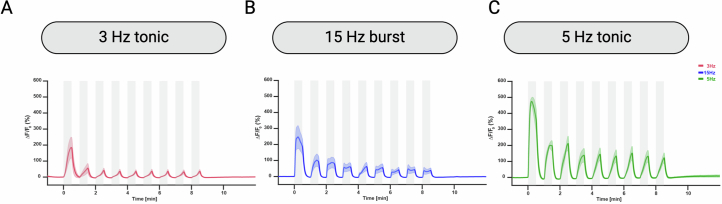
Noradrenaline (NA) release from the locus coeruleus (LC) changes activity and connectivity in neuronal networks across the brain, modulating multiple behavioral states. NA release is mediated by both tonic and burst-like LC activity. However, it is unknown whether the functional changes in target areas depend on these firing patterns. Using optogenetics, photometry, electrophysiology and functional magnetic resonance imaging in mice, we show that tonic and burst-like LC firing patterns elicit brain responses that hinge on their distinct NA release dynamics. During moderate tonic LC activation, NA release engages regions associated with associative processing, while burst-like stimulation biases the brain toward sensory processing. These activation patterns locally couple with increased astrocytic and inhibitory activity and change the brain's topological configuration in line with the hierarchical organization of the cerebral cortex. Together, these findings reveal how the LC-NA system achieves a nuanced regulation of global circuit operations.


Conflict of interest statement

The authors declare no competing interests.

Figures

Fig. 1
Fig. 1. Physiological effects of LC firing intensity and pattern.
a, Schematic of 3-Hz tonic, 15-Hz burst-like and 5-Hz tonic LC blue and red laser light (sham) stimulation protocols for pupillometry in ChR2-expressing animals. The protocol included a 2-min baseline recording followed by 10-s stimulations: (1) 5 Hz at 635 nm as control; (2) 3 Hz at 473 nm; (3) 15 Hz at 473 nm; and (4) 5 Hz at 473 nm. b, Left, representative images during 10-s sham, 3-Hz, 15-Hz and 5-Hz LC stimulation. Right, corresponding pupil traces (n = 24, mean ± s.e.m.). c, Schematic of the optogenetic LC stimulation protocol for pupillometry in ChR2-expressing animals (color-coded according to a). d, Statistical comparison of the pupil response to tonic and burst-like LC stimulation revealed that at 15 Hz changes in pupil diameter were significantly greater than at 3 Hz (mean ± s.d. for 3 Hz = 13.89 ± 6.37; mean ± s.d. for 15 Hz = 17.02 ± 6.13; two-sided paired t-test, t(23) = 4.56, P = 0.00014; n male mice = 12, n female mice = 12). e, Statistical comparison of the pupil response to 3-Hz and 5-Hz tonic LC stimulation. A 5-Hz LC stimulation induced a significantly greater pupil dilation than 3 Hz (mean ± s.d. for 3 Hz = 14.24 ± 6.1; mean ± s.d. for 5 Hz = 16.47 ± 7.3; two-sided paired t-test, t(23) = 3.7, P = 0.0012; n male mice = 12, n female mice = 12). f, Schematic of 30-s optogenetic LC stimulation (ChrimsonR) combined with fiber photometry in the HC. g, Left, ΔF/F traces of GRABNE1m photometry recordings in response to tonic 3-Hz and 15-Hz burst-like LC stimulation (mean ± s.e.m.). Right, 15-Hz burst-like LC stimulation triggered greater NA release compared to 3-Hz tonic LC stimulation (mean ± s.d. for 3 Hz = 5.64 ± 3.30; mean ± s.d. for 15 Hz = 6.82 ± 3.54; two-sided paired t-test, t(11) = 3.42, P = 0.0058; n male mice = 3, n female mice = 9). h, Left, ΔF/F traces of GRABNE1m photometry recordings in response to tonic 3-Hz and 5-Hz LC stimulation (mean ± s.e.m.). Right, 5-Hz tonic LC stimulation triggered greater NA release compared to 3-Hz tonic LC stimulation (mean ± s.d. for 3 Hz = 5.64 ± 3.30; mean ± s.d. for 5 Hz = 7.97 ± 4.22; two-sided paired t-test, t(11) = 6.53, P = 0.000043; n male mice = 3, n female mice = 9). **P < 0.01, ***P < 0.001, ****P < 0.0001. Figure schematics in panels a, c, and f were created with BioRender.com.
Fig. 2
Fig. 2. Local effects of optogenetic LC–NA stimulation.
a, Schematic of tonic and burst-like blue-light, red-light and sham laser stimulation protocols for combined LC optogenetic-fMRI. b, Mean time series extracted from the targeted right LC from sham, 3-Hz tonic, 15-Hz burst-like and 5-Hz tonic stimulation groups (mean ± s.e.m.). c, ROI location for mean time series extraction. LC projections were targeted toward most forebrain regions; hence, no other a priori hypothesis as to the anatomical location of the portrayed ROIs was made. dj, Percentage of changes in BOLD signal of the time series extracted from the medial prefrontal cortex (mPFC) (d), caudate putamen (CPu) (e), SSCtx (f), HC (g), thalamus (TH) (h), AMY (i) and contralateral LC (j) averaged across nine stimulation blocks. The gray-shaded areas represent laser stimulation ON blocks. n sham = 32; n 3 Hz = 15; n 5 Hz = 16; n 15 Hz = 18. Figure schematics in panels ac were created with BioRender.com.
Fig. 3
Fig. 3. Effects of LC–NA activity on neuronal and astrocytic activity.
a, Electrophysiological recordings of the HC in awake, head-restrained mice. Simultaneously, spontaneous Ca2+ transients were recorded in the right LC using GCaMP6f. b, Color-coded raster plots of the activity of hippocampal neurons after intrinsic GCaMP6f activation of the LC. c, Clustering of extracellularly recorded units into putative principal and fast-spiking INTs, and representative spike waveforms. d, Mean firing rate of the principal neuron population (gray) and INT population (black) in the HC represented as ± s.e.m. e, Schematic of 30-s optogenetic LC stimulation (ChrimsonR) combined with GFAP-GCaMP6s fiber photometry recording in the HC. f, ΔF/F traces of astrocytic Ca2+ traces averaged across nine 30-s stimulation blocks of 3-Hz tonic, 15-Hz burst-like and 5-Hz tonic LC stimulation represented as ± s.e.m. n Ca2+ = 4; n ePhys = 3. Pyr, pyramidal neuron. Figure schematics in panels a and e were created with BioRender.com.
Fig. 4
Fig. 4. Brain-wide effect of tonic and burst-like LC stimulation.
a, GLM model setup, including the STIM-NA agreement regressor between the LC ON/OFF laser stimulation protocol (that is, STIM BLOCK) and the NA stimulus responses (that is, NA RELEASE) as obtained from the summation of both parameter estimates (using the logical ‘AND’ function). The agreement regressor (that is, STIM-NA REGRESSOR) was convolved with a standard double-gamma HRF, resulting in an ideal model fit (red trace) of the fMRI data (black trace; taken from the strongest voxel in the targeted LC for visualization purposes). b, Cluster-corrected, thresholded GLM z-statistic activation maps of the 3-Hz tonic, 15-Hz burst and 5-Hz tonic groups compared to sham (z-statistic images, Gaussianized T/F) were thresholded nonparametrically using clusters determined by z > 3.1 and a (corrected) cluster significance threshold of P = 0.05. c, Selective activation clusters during 3-Hz tonic (pink) and 15-Hz burst-like (blue) stimulation of the LC (z-statistic images, Gaussianized T/F) were thresholded nonparametrically using clusters determined by z > 3.1 and a (corrected) cluster significance threshold of P = 0.05. d, Selective activation clusters during 3-Hz tonic (pink) and 5-Hz tonic (green) stimulation of the LC (z-statistic images, Gaussianized T/F) were thresholded nonparametrically using clusters determined by z > 3.1 and a (corrected) cluster significance threshold of P = 0.05. e, Changes in z-scores relative to the activation of cortical hierarchical regions during 3-Hz tonic versus 15-Hz burst-like LC activation (Spearman ρ = 0.7234, P < 0.000). f, Changes in z-scores relative to the activation of cortical hierarchical regions during 3-Hz tonic versus 5-Hz tonic LC activation (Spearman ρ = 0.3610, P = 0.028). g, BOLD network changes were quantified using the PC. h, Mean cortical PCs during LC stimulation in sham (black), 3-Hz tonic (pink), 15-Hz burst (blue) and 5-Hz tonic (green) datasets, corrected for the prestimulation baseline. Data showed significant increase in mean cortical PC from the prestimulation to the stimulation period (P < 0.05, Kruskal–Wallis test, corrected for multiple comparisons). A 5-Hz tonic stimulation resulted in a significantly different mean cortical PC compared to sham stimulation (P < 0.05, Kruskal–Wallis test, corrected for multiple comparison). The central mark indicates the median; the bottom and top edges of the box indicate the 25th and 75th percentiles, respectively. The whiskers extend to the most extreme data points not considered as outliers. The bar plots represent ± s.e.m. n sham = 32; n 3 Hz = 15; n 5 Hz = 16; n 15 Hz = 18. ACAd, anterior cingulate area, dorsal part; ACAv, anterior cingulate area, ventral part; ACC, anterior cingulate cortex; Ald, agranular insular area, dorsal part; Alp, agranular insular area, posterior part; Alv, agranular insular area, ventral part; AUDd, dorsal auditory area; AUDp, primary auditory area; AUDv, ventral auditory area; CB, cerebellum; ECT, ectorhinal area; FRP, frontal pole, cerebral cortex; GU, gustatory area; HY, hypothalamus; ILA, infralimbic area; MOp, primary motor area; MOs, secondary motor area; ORBI, orbital area, lateral part; ORBm, orbital area, medial part; ORBvl, orbital area, ventrolateral part; PERI, perirhinal area; PL, prelimbic area; PTLp, posterior parietal association area; RSPagl, retrosplenial area, lateral agranular part; RSPd, retrosplenial area, dorsal part; RSPv, retrosplenial area, ventral part; SSp-bfd, primary somatosensory area, barrel field; SSp-ll, primary somatosensory area, lower limb; SSp-m, primary somatosensory area, mouth; SSp-n, primary somatosensory area, nose; SSp-t, primary somatosensory area, trunk; SSp-ul, primary somatosensory area, upper limb; SSs, supplemental somatosensory area; TEa, temporal association area; VISal, anterolateral visual area; VISam, anteromedial visual area; VISC, visceral area; VISl, lateral visual area; VISp, primary visual area; VISpl, posterolateral visual area; VISpm, posteromedial visual area. Figure schematics in panels ag were created with BioRender.com.
Extended Data Fig. 1
Extended Data Fig. 1. Physiological effects of 30 s optogenetic LC-NA stimulation.
Related to Fig. 1. a Left: immunohistochemical macro view of ChR2-EYFP targeting to the right (ipsilateral) LC. Dashes represent optical fibre placement. Right: immunohistochemical view of ChR2-EYFP and cFos expression in TH-positive neurons of the right (stimulated) LC. Immunohistochemistry was performed in a separate cohort to evaluate LC targeting (n(male)=11). b Pupil traces at 30 s of 3 Hz tonic (n=9), 15 Hz burst (n=9), and 5 Hz tonic (n=7) LC stimulation (mean±SEM). c GRABNE1m photometry recordings during nine blocks of 30 s 3 Hz tonic, 15 Hz burst, and 5 Hz tonic LC ChrimsonR stimulation. Each stimulation block causes a sharp spike in NA increase across all stimulation protocols. Right: GRABNE1m photometry recordings during 30 s 3 Hz tonic, 15 Hz burst, and 5 Hz tonic LC ChrimsonR stimulation averaged across nine stimulation blocks (mean±SEM). Scale bars, 500µm,50µm. N(male)=2, n(female)=3. Figure schematics in panels b and c were created with Biorender.com.
Extended Data Fig. 2
Extended Data Fig. 2. Cortical ROI parcellation.
Related to Fig. 2. a Location of 38 regions-of-interest (ROIs) in EPI template space across the right cortical hemisphere used for time series extraction. Mean timeseries of 38 cortical ROIs during b 3 Hz tonic, c 15 Hz burst, d 5 Hz tonic, and e sham LC stimulation. Figure schematics in panels ac were created with Biorender.com.
Extended Data Fig. 3
Extended Data Fig. 3. Astrocytic activity upon repeated optogenetic LC-NA stimulation.
Related to Fig. 3. Changes in astrocytic Ca2+ release upon nine blocks of 30 s optogenetic a 3 Hz tonic, b 15 Hz burst, and c 5 Hz tonic LC ChrimsonR stimulation recorded in the hippocampus (mean±SEM). Each stimulation block causes an increase in Ca2+ signals across all stimulation protocols. N(male)=2, n(female)=2. Pink traces represent 3 Hz tonic, green traces 5 Hz tonic, blue traces 15 Hz burst, and grey blocks indicate optogenetic stimulation. Figure schematics in panels ac were created with Biorender.com.
Extended Data Fig. 4
Extended Data Fig. 4. Brain-wide effects of optogenetic LC stimulation.
Related to Fig. 4. a GLM model fit of selected ROIs. b Cluster-corrected, thresholded (z-score>3.1) GLM z-stat activation maps in EPI space of 3 Hz tonic, 15 Hz burst, and 5 Hz tonic groups compared to sham. General linear model (GLM) model analysis including the LC ON/OFF laser stimulation protocol (that is, STIM BLOCK) and the NA stimulus responses (that is, NA RAMP) as separate but highly correlated regressors. Both are convolved with a standard double-gamma HRF resulting in cluster-corrected, thresholded (z-score>3.1) GLM z-stat activation maps of 3 Hz tonic, 15 Hz burst, and 5 Hz tonic groups compared to sham that depend on c the ON OFF stimulation of LC-NA neurons or d on NA release dynamics. e Changes in participation coefficients (PC) relative to activation of cortical hierarchical regions during 3 Hz tonic vs 15 Hz burst-like LC activation (Spearman’s ρ= −0.69, P = 3.4×10⁶). f Changes in participation coefficients (PC) relative to activation of cortical hierarchical regions during 3 Hz tonic vs 5 Hz tonic LC activation (Spearman’s ρ = 0.1, P = 0.65). PFC, prefrontal cortex; mPFC, medial prefrontal cortex; OFC, orbitofrontal cortex; CPu, caudate putamen; Amy, amygdala; HC, hippocampus; SUB, subiculum; SC, superior colliculus; LC, locus coeruleus; MRN, midbrain reticular nucleus; VPM, ventral posteriomedial nucleus of thalamus; MOp, primary motor cortex; SSCtx, somatosensory cortex; CB, cerebellum; NA, noradrenaline; Stim, stimulation. N(sham)=32; n(3Hz)=15; n(5Hz)=16. Figure schematics in panels af were created with Biorender.com.

References

    1. Shine, J. M. Neuromodulatory influences on integration and segregation in the brain. Trends Cogn. Sci.23, 572–583 (2019). - PubMed
    1. Aston-Jones, G. & Cohen, J. D. Adaptive gain and the role of the locus coeruleus-norepinephrine system in optimal performance. J. Comp. Neurol.493, 99–110 (2005). - PubMed
    1. Bouret, S. & Sara, S. J. Network reset: a simplified overarching theory of locus coeruleus noradrenaline function. Trends Neurosci.28, 574–582 (2005). - PubMed
    1. Shine, J. M. et al. Human cognition involves the dynamic integration of neural activity and neuromodulatory systems. Nat. Neurosci.22, 289–296 (2019). - PubMed
    1. Berridge, C. W. & Waterhouse, B. D. The locus coeruleus-noradrenergic system: modulation of behavioral state and state-dependent cognitive processes. Brain Res. Brain Res. Rev.42, 33–84 (2003). - PubMed

LinkOut - more resources