. 2024 Oct;56(10):2228-2237.
doi: 10.1038/s41588-024-01902-8. Epub 2024 Sep 16.

Antagonism between H3K27me3 and genome-lamina association drives atypical spatial genome organization in the totipotent embryo

Affiliations

Antagonism between H3K27me3 and genome-lamina association drives atypical spatial genome organization in the totipotent embryo

Isabel Guerreiro et al. Nat Genet. 2024 Oct.

Abstract

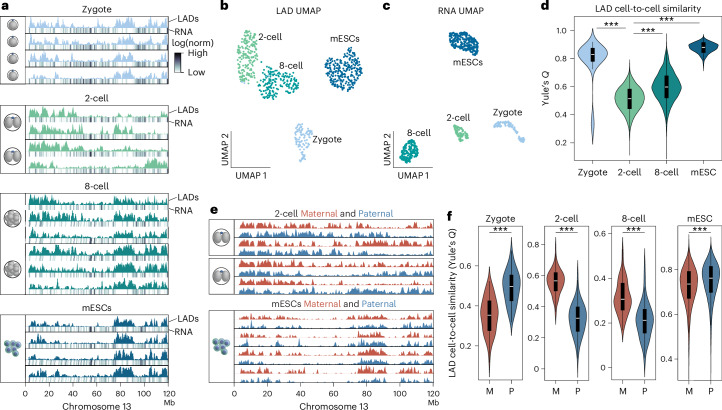
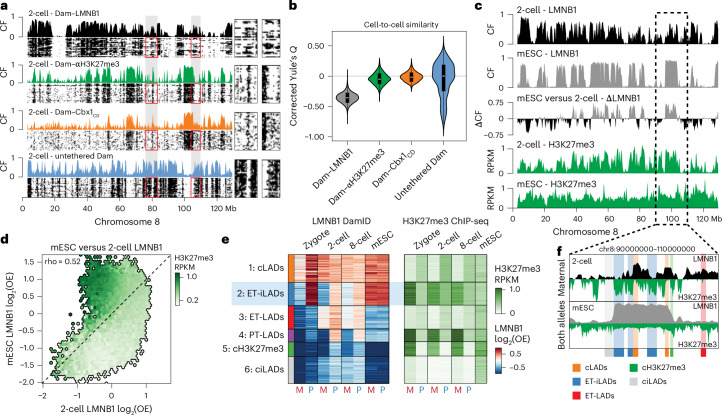
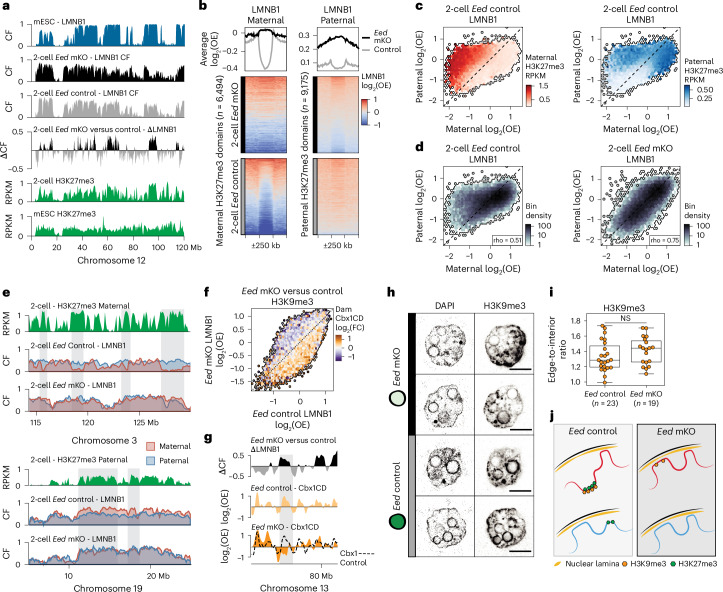
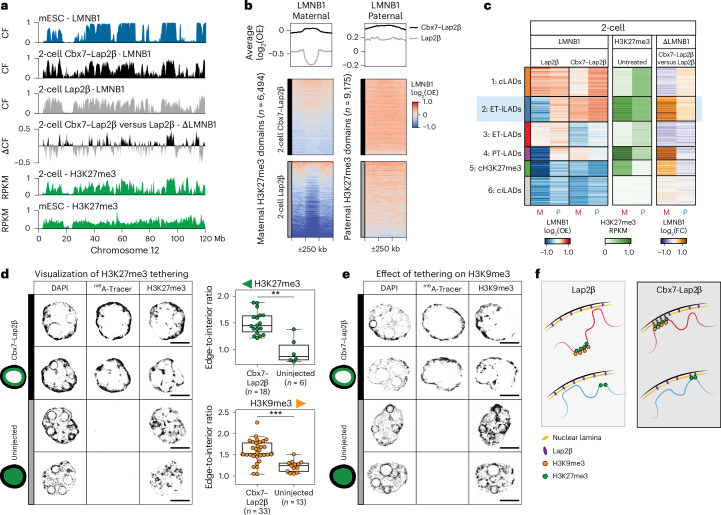
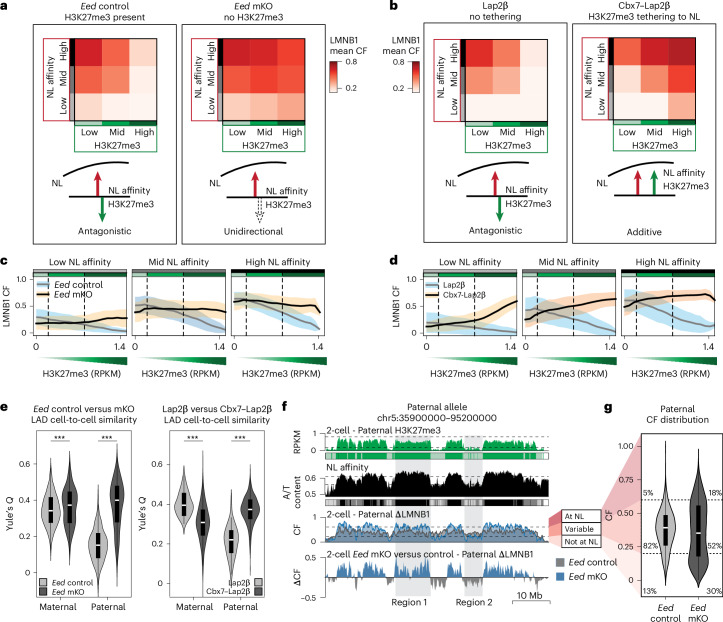
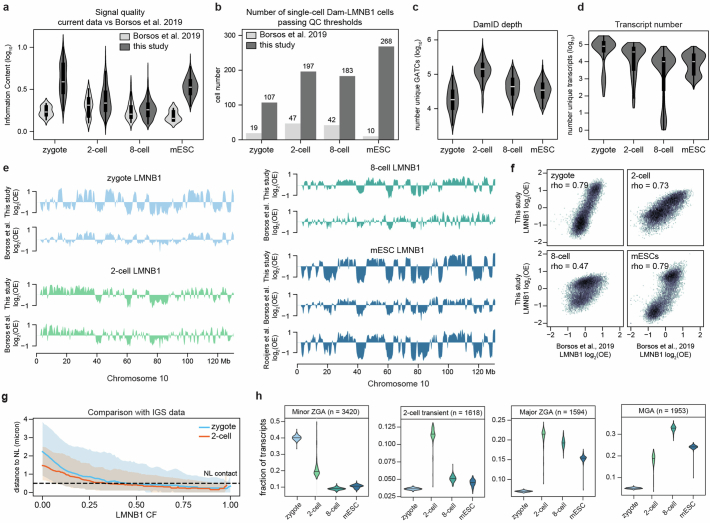
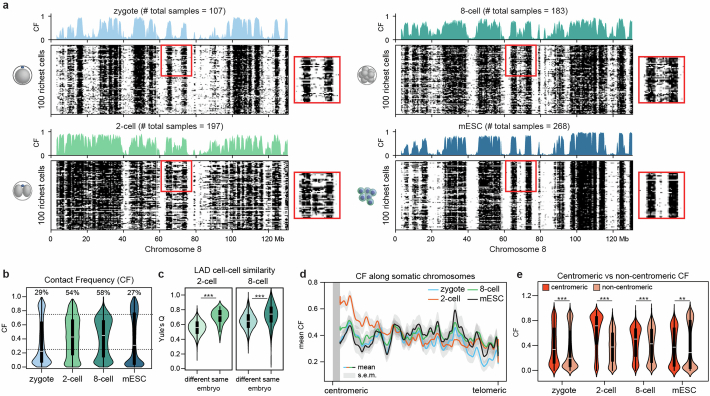
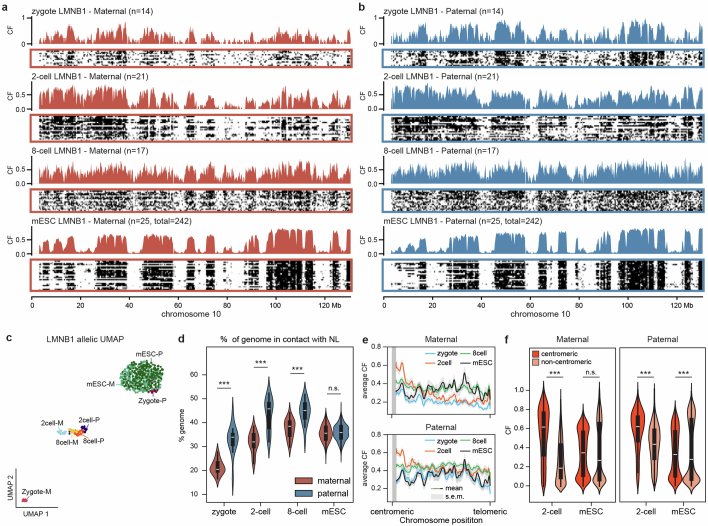
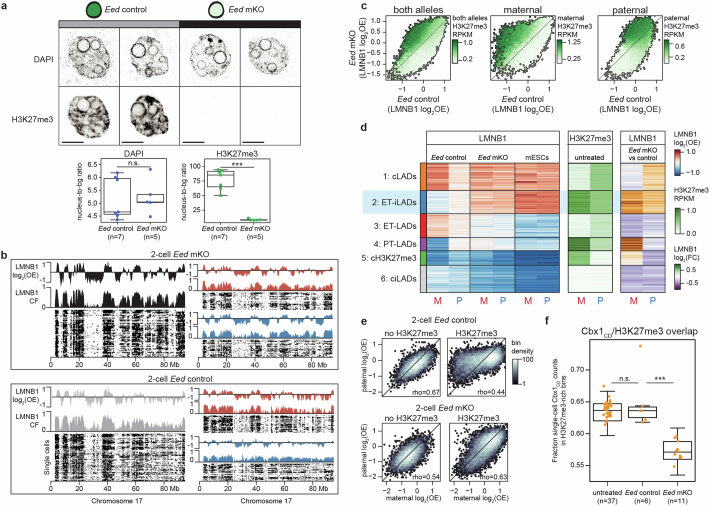
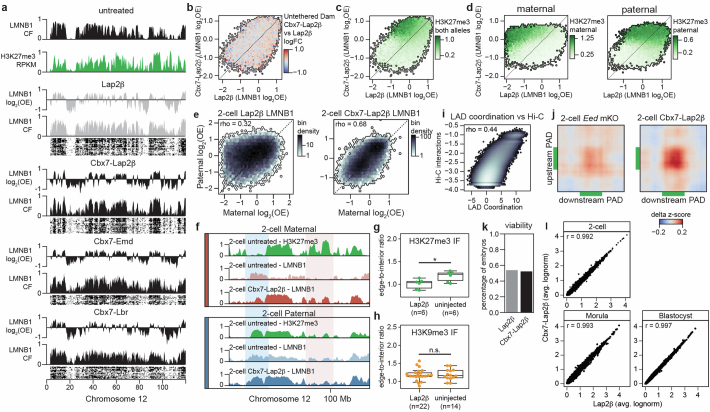
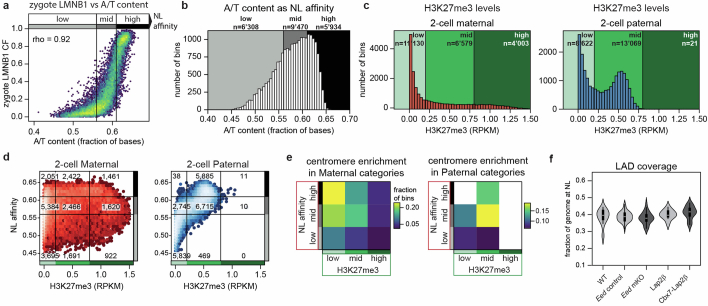
In mammals, early embryonic development exhibits highly unusual spatial positioning of genomic regions at the nuclear lamina, but the mechanisms underpinning this atypical genome organization remain elusive. Here, we generated single-cell profiles of lamina-associated domains (LADs) coupled with transcriptomics, which revealed a striking overlap between preimplantation-specific LAD dissociation and noncanonical broad domains of H3K27me3. Loss of H3K27me3 resulted in a restoration of canonical LAD profiles, suggesting an antagonistic relationship between lamina association and H3K27me3. Tethering of H3K27me3 to the nuclear periphery showed that the resultant relocalization is partially dependent on the underlying DNA sequence. Collectively, our results suggest that the atypical organization of LADs in early developmental stages is the result of a tug-of-war between intrinsic affinity for the nuclear lamina and H3K27me3, constrained by the available space at the nuclear periphery. This study provides detailed insight into the molecular mechanisms regulating nuclear organization during early mammalian development.


Conflict of interest statement

The authors declare no competing interests.

Figures

Fig. 1
Fig. 1. Genome–lamina contacts at the 2-cell stage are highly variable between single cells.
a, Examples of LAD single-cell profiles (RPKM) and corresponding gene expression track (log-transformed depth-normalized (log(norm)) values scaled to maximum value per sample) across the entire chromosome 13 at different developmental stages and in mESCs. Single-cell profiles derived from the same embryo are grouped. b, UMAP based on Dam–LMNB1 single-cell readout (n = 755). c, Single-cell UMAP based on transcriptional readout of the cells in b passing transcriptional thresholds (n = 482). d, Distributions of cell-to-cell similarity (Yule’s Q) of binarized single-cell Dam–LMNB1 data for zygote (n = 253 cell pairs, ***P < 1 × 10−100), 2-cell (n = 17,020 cell pairs), 8-cell (n = 4,950 cell pairs, ***P < 1 × 10−100) and mESC (n = 15,356 cell pairs, ***P < 1 × 10−100). e, 2-cell and mESC example single-cell LAD profiles split in maternal (red) and paternal (blue) alleles. For the 2-cell stage, allele-specific profiles from the same embryo are grouped. f, Distributions of cell-to-cell similarity (Yule’s Q) of binarized allelic single-cell Dam–LMNB1 data for zygote (n = 78 cell pairs, ***P = 8.4 × 10−16), 2-cell stage (n = 210 cell pairs, ***P = 4.8 × 10−62), 8-cell stage (n = 136 cell pairs, ***P = 2.2 × 10−14) and mESC (n = 29,161 cell pairs, ***P < 1 × 10−100). Statistical testing was performed with a two-sided Mann–Whitney U-test. Boxplots in d and f show median values (white line), interquartile range (IQR, black box) and the range of all data points within 1.5× IQR (whiskers). M, maternal; P, paternal.
Fig. 2
Fig. 2. ET-iLADs that specifically detach from the NL in early embryos are enriched in H3K27me3.
a, Binarized single-cell profiles for Dam–LMNB1, Dam–αH3K27me3 and Dam–Cbx1CD in 2-cell embryos across the entire chromosome 8, ordered by decreasing unique number of GATCs. The 30 richest cells are shown per condition. Corresponding CF tracks are shown above each heatmap. Gray boxes highlight example regions with variable genome–lamina association, but uniform enrichment of the other chromatin features. Cut-outs on the right show the same regions at greater magnification. b, Distributions of cell-to-cell similarity scores (corrected Yule’s Q) per construct for Dam–LMNB1 (n = 19,306 cell pairs), Dam–αH3K27me3 (n = 435 cell pairs), Dam–Cbx1CD (n = 666 cell pairs) and untethered Dam (n = 2,926 cell pairs). A value of zero indicates a level of similarity that is expected based on technical noise, greater and smaller values indicate higher and lower similarity, respectively. Boxplots show median values (white line), IQR (black box) and the range of all data points within 1.5× IQR (whiskers). c, LMNB1 CF profiles and differential CF profile between mESC and 2-cell stage along chromosome 8. Publicly available H3K27me3 ChIP-seq data profiles of the 2-cell stage and mESCs are also shown. The dashed box highlights an example with low CF and high H3K27me3 at the 2-cell stage. d, Genome-wide comparison between mESC and 2-cell LMNB1 DamID CF values in 100 kb bins. Color intensity refers to average H3K27me3 RPKM values obtained from publicly available ChIP-seq data. Correlation was determined using Spearman’s rank correlation coefficient (rho = 0.52, P < 1 × 10−100, n = 23,751 bins). e, Clustering of 100 kb genomic bins based on their allelic LMNB1 and H3K27me3 ChIP-seq values at different embryonic stages and in mESCs. Left: LMNB1 CF values from both the maternal (M) and paternal (P) alleles across the different stages. Right: H3K27me3 ChIP-seq values. Blue shading is used to highlight ET-iLADs. f, Genomic region with examples of five of the genomic clusters identified in e. Mirror profiles show LMNB1 values (DamID) are given on the top and H3K27me3 (ChIP-seq) on the bottom for the 2-cell stage (maternal allele) and mESCs (both alleles).
Fig. 3
Fig. 3. H3K27me3 antagonizes genome–lamina association during early development.
a, LMNB1 profiles of control and Eed mKO 2-cell embryos and mESC, differential LMNB1 enrichment of Eed mKO versus control and H3K27me3 profiles (ChIP-seq) over chromosome 12. b, Enrichment plot showing maternal (left) and paternal (right) LMNB1 enrichment of Eed mKO and control 2-cell embryos over H3K27me3 domains from the same allele and surrounding 250 kb. Heatmaps show LMNB1 signal per domain, whereas line plots show average enrichment over all domains. c, Comparison of maternal and paternal LMNB1 log2 observed-over-expected (log2(OE)) in 100 kb bins. The color indicates the average maternal (left, red) and paternal (right, blue) H3K27me3 RPKM values. d, Comparison of paternal and maternal LMNB1 log2(OE) in control (left, rho = 0.51, P < 1 × 10−100, n = 19,869 100 kb bins) or Eed mKO (right, rho = 0.75, P < 1 × 10−100, n = 19,869 100 kb bins) embryos. Correlations were computed using Spearman’s rank-order correlation. e, Example genomic regions where a reduction of LMNB1 allelic asymmetry is observed in regions enriched for maternal-specific H3K27me3 (upper) or paternal-specific H3K27me3 (lower). f, Comparison of LMNB1 log2(OE) in the Eed mKO and control embryos. Color intensity refers to the log2(fold change) in Dam–Cbx1CD (H3K9me3) enrichment between the two conditions. g, Example genomic region where the differential LMNB1 enrichment between the Eed mKO and control is plotted, as well as the Dam–Cbx1CD (H3K9me3) log2(OE) of both conditions separately. The Dam–Cbx1CD of the control is also plotted as a dashed line on the Eed mKO profile for reference. A shaded box highlights a region that gains genome–lamina associating in the Eed mKO while showing a loss in Dam–Cbx1CD enrichment. h, DAPI and immunostaining of H3K9me3 in 2-cell Eed mKO or Eed control embryos (scale bar, 10 μm). i, Quantification of the radial (1 μm) enrichment of H3K9me3 relative to the rest of the nucleus for the immunostaining in h. Significance was computed using Welch’s two-sided t-test (P = 0.23, Eed control n = 23 nuclei, Eed mKO n = 19 nuclei). Data are from one biological replicate. Boxplots show median values (black line), IQR (black box) and the range of all data points within 1.5× IQR (whiskers). j, Model that illustrates the effect of H3K27me3 depletion in Eed mKO embryos. FC, fold change; NS, not significant.
Fig. 4
Fig. 4. H3K27me3 is retained when forced to associate to the lamina.
a, LMNB1 profiles of Lap2β and Cbx7–Lap2β-injected 2-cell embryos, differential LMNB1 enrichment between the two conditions, mESC LMNB1 profile and H3K27me3 profiles (ChIP-seq) over chromosome 12. b, Enrichment plot showing maternal (left) and paternal (right) LMNB1 enrichment for Cbx7–Lap2β and Lap2β conditions over H3K27me3 domains from the same allele and surrounding 250 kb. Heatmaps show LMNB1 signal per domain, and line plots show average enrichment over all domains. c, Heatmap showing allelic LMNB1 values across genomic clusters (as in Fig. 2e) for Lap2β and Cbx7–Lap2β-injected 2-cell embryos. H3K27me3 from ChIP-seq data at the 2-cell stage is shown for comparison. Blue shading is used to highlight ET-iLADs. d,e, DAPI immunostaining of the m6A-Tracer, and immunostaining of H3K27me3 (d) or H3K9me3 (e) in 2-cell Cbx7–Lap2β and Lap2β embryos (scale bar, 10 μm). Detection of m6A-Tracer signal indicates successful injection of the Dam–LMNB1 and Cbx7–Lap2β constructs (Methods). Right of d: quantification of the radial (1 μm) enrichment of H3K27me3 (upper) and H3K9me3 (lower) relative to the rest of the nucleus. Significance was computed using Welch’s two-sided t-test (H3K27me3, **P = 1.6 × 10−3, Cbx7–Lap2β n = 18 nuclei, uninjected n = 6 nuclei; H3K9me3, ***P = 3.6 × 10−7, Cbx7–Lap2β n = 33 nuclei, uninjected n = 13 nuclei). Data are from one biological replicate. Boxplots show median values (black line), IQR (black box) and the range of all data points within 1.5× IQR (whiskers). f, Model that illustrates the effect of H3K27me3 tethering during early development.
Fig. 5
Fig. 5. Antagonism between intrinsic NL affinity and H3K27me3 levels dictates genome–lamina association and leads to high LAD heterogeneity between cells of early embryos.
a,b, Heatmap of average maternal LMNB1 CF values of Eed control and Eed mKO 2-cell embryos (a) or Lap2β and Cbx7–Lap2β-injected embryos (b) across nine categories of varying NL affinity and H3K27me3 level (defined in Extended Data Fig. 7d). c,d, LMNB1 CF values of Eed control and Eed mKO (c) or Lap2β and Cbx7–Lap2β conditions (d) across increasing 2-cell H3K27me3 RPKM values. The line indicates the mean and the shaded area indicates the standard deviation. e, Allele-specific distribution of the cell-to-cell similarity (Yule’s Q) in Eed control and Eed mKO (left: maternal ***P = 3.2 × 10−4, paternal ***P < 1 × 10−100) and Lap2β and Cbx7–Lap2β-injected embryos (right: maternal ***P = 3.1 × 10−13, paternal ***P = 1.7 × 10−23). Eed control, n = 1,275 cell pairs; Eed mKO, n = 465 cell pairs; Lap2β, n = 45 cell pairs; Cbx7–Lap2β, n = 741 cell pairs. Significance between conditions was computed with the two-sided Mann–Whitney U-test. f, Example profile on chromosome 5 of paternal H3K27me3, NL affinity and paternal LMNB1 profiles of Eed control and mKO. Color-coded boxes under H3K27me3 and NL affinity refer to the different levels pictured in a and Extended Data Fig. 7d. Region 1 highlights an example in which genome–lamina association is increased in Eed mKO, whereas region 2 highlights an example in which it is decreased. Both regions show reduced variability. g, Distribution of paternal LMNB1 CF values in Eed control and Eed mKO embryos. Percentages indicate, from top to bottom, the fraction of 100 kb genomic bins (n = 20,715) with high, intermediate and low CF values. Boxplots in e and g indicate median values (white line), IQR (black box) and the range of all data points within 1.5× IQR (whiskers).
Extended Data Fig. 1
Extended Data Fig. 1. Validation of single-cell LAD data during preimplantation stages.
a, Information content (signal quality) plotted for samples from the present study and Borsos et al.. Borsos: zygote, n = 19 cells; 2-cell, n = 47 cells; 8-cell, n = 42 cells; mESC, n = 10 cells. This study: zygote, n = 107 cells; 2-cell, n = 201 cells; 8-cell, n = 215 cells; mESC, n = 268 cells. Cells passing the DamID depth threshold are included. b, Comparison of cell numbers that pass all DamID quality thresholds for the present study and Borsos et al.. c, Distribution of unique number of GATCs per stage. Borsos: zygote, n = 19 cells; 2-cell, n = 47 cells; 8-cell, n = 42 cells; mESC, n = 10 cells. This study: zygote, n = 107 cells; 2-cell, n = 197 cells; 8-cell, n = 183 cells; mESC, n = 268 cells. Cells passing all DamID quality thresholds are included. d, Distribution of unique transcripts per stage. Zygote, n = 246 cells; 2-cell, n = 210 cells; 8-cell, n = 501 cells; mESC, n = 374 cells. All cells are included. e, Combined single-cell profiles normalized to mappability (log2OE) of this work compared to previous studies, over the entire chromosome 10. f, Comparison of single-cell averages from our study and Borsos et al. using mappability normalized values (log2(OE)) in 100-kb bins (n = 23,751). Correlations were computed using Spearman’s rank-order correlation (zygote, rho = 0.79, p < 1e-100; 2-cell, rho = 0.73, p < 1e-100; 8-cell, rho = 0.47, p < 1e-100; mESC, rho = 0.79, p < 1e-100). g, Comparison of zygote and 2-cell LMNB1 CF and distance to the NL as reported in Payne et al. by in situ genome sequencing (IGS). The line shows the median distance of all fragments with a certain CF value, the shaded area shows the inter-quartile range. The dashed line indicates the distance threshold used to designate a genomic region as contacting the NL by Payne et al. h, Distribution of the fraction of total transcripts that correspond to different gene categories per stage, as defined in Park et al.. Minor ZGA, n = 3,420 genes; 2-cell transient, n = 1,618 genes; Major ZGA, n = 1,594 genes; MGA, n = 1,953 genes. ZGA, zygotic genome activation; MGA, mid-preimplantation gene activation. Black line indicates median values. Boxplots included in (a), (c), and (d) indicate median values (white line), inter-quartile range (IQR, black box) and the range of all data points within 1.5 times the IQR (whiskers).
Extended Data Fig. 2
Extended Data Fig. 2. Analysis of cell-to-cell LAD variability in preimplantation stages and mESCs.
a, Heatmaps show single-cell binarized profiles of 100 example cells that passed quality thresholds along the entire chromosome 8 (left panel) ordered by unique number of unique GATCs (DamID depth) for each stage. Tracks on top of the heatmaps show contact frequency (CF) profiles. On the right side of each heatmap is a magnification of the region highlighted with a red rectangle. b, Distribution of CF values in 100-kb bins per stage (n = 23,751 bins). On top, percentages of bins between 0.25 and 0.75 CF values, which are indicative of cell-to-cell variability, are shown. c, Violin plot showing cell-to-cell similarity using Yule’s Q on cell pairs originating from the same embryo or from a different embryo at the 2-cell stage (left) and at the 8-cell stage (right). Two-sided Mann-Whitney U test was performed (2-cell different embryo, n = 16,944; 2-cell same embryo, n = 76, p = 8.0e-28; 8-cell different embryo, n = 4,744, 8-cell same embryo: n = 206, p = 1.2e-24). d, Smoothed mean (1000-Mb Gaussian kernel) of LMNB1 CF values along the length of all autosomal chromosomes scaled to the same size per stage. Shaded areas around the lines indicate the standard error of the mean. e, Violin plot depicting CF values in the first 30 Mb (n = 4,984 100-kb bins) versus the remainder of the chromosome (n = 18,767 100-kb bins) for the zygote (p = 9.3e-57), 2-cell (p < 1e-100), 8-cell (p = 6.2e-22) stages and mESCs (p = 1.3e-3). Statistical significance was tested using a two-sided Mann-Whitney U test. Boxplots included in (b), (c), and (e) indicate median values (white line), inter-quartile range (IQR, black box) and the range of all data points within 1.5 times the IQR (whiskers).
Extended Data Fig. 3
Extended Data Fig. 3. Characterization of single-cell LAD profiles split by parental allele.
a-b, Contact Frequency (CF) tracks and heatmap of binarized single-cell LAD profiles separated into maternal (a) and paternal (b) allele for the zygote, 2-cell, 8-cell and mESCs along the entire chromosome 10. Heatmaps are ordered by unique number of GATCs (DamID depth). A subset of the total number of mESC is shown. c, UMAP based on allelic Dam-LMNB1 single-cell readout. d, Percentage of the genome that is in contact with the NL per allele and per stage. Two-sided Wilcoxon rank-sum test was performed (zygote, n = 14, p = 9.4e-5; 2-cell, n = 26, p = 1.83e-7; 8-cell, n = 21, p = 2.5e-5; mESC, n = 268, p-value = 0.36). e, Smoothed mean (1000-Mb Gaussian kernel) of LMNB1 CF values along the length of all autosomal chromosomes scaled to the same size per stage and split by allele (maternal - top and paternal – bottom). Shaded areas around the lines indicate the standard error of the mean. f, Violin plot depicting CF values separated by allele in the first 30 Mb (n = 4,865 100-kb bins) versus the remaining of the chromosome (n = 18,330 100-kb bins) for 2-cell embryos and mESCs. Two-sided Mann-Whitney U test was performed (2-cell maternal, p < 1e-100; 2-cell paternal, p = 1e-100; mESC maternal, p = 0.60; mESC paternal, p = 2.3e-4). Boxplots included in (d) and (f) indicate median values (white line), inter-quartile range (IQR, black box) and the range of all data points within 1.5 times the IQR (whiskers).
Extended Data Fig. 4
Extended Data Fig. 4. Validation and analysis of single-cell epigenetic marks at the 2-cell stage.
a, Gene expression comparison between cells in which the gene contacts the NL and cells for which the same gene does not contact the NL. Correlation was computed using Pearson’s correlation (zyogte, p < 1e-100, n = 9,415 genes; 2-cell, p < 1e-100, n = 9,143 genes; 8-cell, p < 1e-100, n = 8.879 genes; mESC, p < 1e-100, n = 9,119 genes). Dashed lines show diagonal. b, Left: Heatmap of binarized single-cell profiles for Dam-LMNB1, Dam-αH3K27me3, Dam-Cbx1CD across the entire chromosome 12 ordered by decreasing unique number of GATCs. 30 cells are plotted per construct. Right: Heatmaps showing simulated single-cell samples. This data is used to correct cell-to-cell similarity calculations for construct-specific noise and sparsity levels. c, Correlation heatmap relating DamID (present study) and corresponding publicly available ChIP-seq measurements at the 2-cell stage. d, Example tracks of four example single cells per construct over a selected region in chromosome 8. A region with high LMNB1 variability is highlighted in grey. e, Heatmap with LMNB1 log2(OE), H3K27me3 RPKM H2Aub RPKM, H3K4me3 RPKM, H3K27ac RPKM and H3K9me3 log2(OE), average values per genomic cluster defined in Fig. 2e. f, Heatmap showing scaled gene density of different categories described in Park et al. (2013)50, Polycomb targets53 and coding genes for each cluster. Scaling is done per column to accommodate the vastly different numbers per column. g, Heatmap showing scaled repeat density of each genomic cluster split by repeat family and (h) A/T content as fraction of bases per bin. Scaling is done per column to accommodate the vastly different numbers per column.
Extended Data Fig. 5
Extended Data Fig. 5. Effect of Eed mKO on nuclear lamina association at the 2-cell stage.
a, Top: DAPI and immunostaining of H3K27me3 in 2-cell Eed mKO or Eed control embryos (scale bar = 10μm). Bottom: Quantification of the nucleus-to-background ratio. Two-sided Welch’s T-test was performed to test significance (DAPI, p = 0.89; H3K27me3, p = 4.0e-5; Eed control, n = 7 nuclei; Eed mKO, n = 5 nuclei). Data is from one biological replicate. b, Single-cell heatmaps of binarized LMNB1 profiles of 2-cell Eed mKO (top) and control (bottom) embryos with corresponding CF and log2(OE) values per condition along chromosome 17 of both alleles (left) or separated alleles (right). c, Comparison of LMNB1 values in 100-kb bins between Eed mKO and control conditions for both alleles (left), or maternal and paternal alleles separately (right). The color refers to average combined or allele-specific H3K27me3 values of 2-cell WT embryos. d, Heatmap showing Eed mKO and control LMNB1 log2(OE) values per genomic bin at the 2-cell stage, as well as mESC. 2-cell H3K27me3 (ref. ) and differential LAD values between the two conditions for each of the genomic clusters depicted in Fig. 2e. e, Comparison of maternal and paternal LMNB1 log2(OE) in 100-kb genomic bins containing H3K27me3 (right) or not (left) in either the control 2-cell condition (top) or in the Eed mKO (bottom). Color scale refers to density of genomic bins. Correlations were computed using Spearman’s rank-order correlation. Eed control & no H3K27me3, rho = 0.67, p < 1e-100, n = 6,662 bins. Eed control & H3K27me3, rho = 0.44, p < 1e-100, n = 14,053 bins; Eed mKO & no H3K27me3, rho = 0.54, p < 1e-100, n = 6,662 bins; Eed mKO & H3K27me3, rho = 0.63, p < 1e-100, n = 14,053 bins. f, Boxplot showing fraction of Dam-Cbx1CD counts overlap with H3K27me3-rich (RPKM > 0.2) bins in untreated (n = 37), Eed control (n = 6) and Eed mKO (n = 11) conditions. Two-sided Mann-Whitney U test was performed to test significance (Eed control vs untreated, p = 0.88; Eed control vs Eed mKO, p = 1.6e-4). Boxplots indicate median values (white line), inter-quartile range (IQR, black box) and the range of all data points within 1.5 times the IQR (whiskers).
Extended Data Fig. 6
Extended Data Fig. 6. Effect of H3K27me3-tethering to the NL nuclear lamina.
a, Single-cell heatmaps of binarized LMNB1 profiles of Lap2β, Cbx7-Lap2β, Cbx7-Emd, Cbx7-Lbr 2-cell embryos with corresponding CF and log2(OE) values along chromosome 12. On top, 2-cell LMNB1 CF and H3K27me3 (ref. ) of untreated embryos are show. b, Comparison of LMNB1 values in 100-kb bins for the Cbx7-Lap2β and the Lap2β conditions. The color indicates the average log2(FC) of untethered Dam between Cbx7-Lap2β and Lap2β embryos. c-d, Comparison of LMNB1 values in the Cbx7-Lap2β and Lap2β-injected hybrid embryos for both alleles (c) or maternal and paternal alleles separately (d). The color scale indicates the average allele-specific H3K27me3 values of 2-cell WT embryos. e, Comparison of paternal and maternal LMNB1 CF in Lap2β (left, rho = 0.32, p < 1e-100, n = 21,710 bins) and Cbx7-Lap2β conditions (right, rho = 0.68, p < 1e-100, n = 21,710 bins). Correlations were computed using Spearman’s rank-order correlation. f, Example genomic region with maternal (top) and paternal (bottom) LMNB1 CF for Cbx7-Lap2β and Lap2β conditions and 2-cell WT H3K27me3. Dashed boxes highlight examples of allelic LAD asymmetry in the Cbx7-Lap2β condition: paternal-specific LADs in blue and maternal-specific LADs in red. g-h, Quantification of the radial (1 μm) enrichment of H3K27me3 (g) and H3K9me3 (h) relative to the rest of the nucleus. Significance was computed using Welch’s two-sided t-test (H3K27me3, p = 0.024; H3K9me3, p = 0.96). H3K27me3: Lap2β, n = 6; uninjected, n = 6. H3K9me3: Lap2β, n = 22; uninjected, n = 14. Data is from one biological replicate. Boxplots indicate median values (white line), inter-quartile range (IQR, black box) and the range within 1.5 times the IQR (whiskers). i, Correlation between LAD coordination metric and Hi-C interaction values up to 50 Mb distance (rho = 0.44, p < 1e-100, n = 5,311,617 100-kb bin pairs). j, Average LAD coordination between PAD pairs up to 20 Mb distance. k, Fraction of embryos reaching the blastocyst stage (E3.5) in Cbx7-Lap2β and Lap2β conditions (Cbx7-Lap2β, n = 67; Lap2β, n = 65). Data is from one biological replicate. l, Gene expression comparison between Cbx7-Lap2β and Lap2β embryos at 2-cell, morula and blastocyst stages. No significant differentially expressed genes were detected. Pearson’s correlation was computed (2-cell, p < 2.2e-16, n = 14,862 genes; morula, p < 2.2e-16, n = 15259 genes; blastocyst, p < 2.2e-16, n = 15,259 genes). Correlations in (e) and (g) were computed using Spearman’s rank-order correlation.
Extended Data Fig. 7
Extended Data Fig. 7. A model based on NL affinity and H3K27me3 to explain atypical LADs of the early embryo.
a, Comparison between zygote LMNB1 CF and A/T content in 100-kb bins (n = 21,708). Thresholds used for low, mid and high intrinsic NL affinity are depicted. Correlation is computed with Spearman’s rank-sum correlation (rho = 0.92, p < 1e-100). b, Histogram showing the distribution of A/T content in 100-kb bins of the mouse genome. Low, mid and high intrinsic NL affinity categories are highlighted by using increasingly darker colors of the gray scale. c, Histogram showing 2-cell WT H3K27me3 RPKM distribution in the maternal (left) and paternal (right) alleles. Low, mid and high H3K27me3 categories are highlighted by using increasingly darker colors of green. d, Genome-wide comparison of NL affinity (A/T content) and maternal (red, left) or paternal (blue, right) H3K27me3 RPKM values in 100-kb bins. Categories defined by thresholds set in (b-c) are shown with the corresponding color. Number of genomic bins per category is displayed. e, Heatmap showing the fraction of bins in each category that is <20 Mb from the centromere. f, Distributions of the total fraction of the genome in association with the NL across cells per condition. The total fraction is computed as the average fraction of the maternal and paternal alleles. WT, n = 21 cells; Eed control, n = 51 cells; Eed mKO, n = 31 cells; Lap2β, n = 10 cells; Cbx7-Lap2β, n = 39 cells. Boxplots indicate median values (white line), inter-quartile range (IQR, black box) and the range of all data points within 1.5 times the IQR (whiskers).

Similar articles

Cited by

References

    1. Borsos, M. et al. Genome-lamina interactions are established de novo in the early mouse embryo. Nature569, 729–733 (2019). - PMC - PubMed
    1. Burton, A. & Torres-Padilla, M. E. Chromatin dynamics in the regulation of cell fate allocation during early embryogenesis. Nat. Rev. Mol. Cell Biol.15, 723–734 (2014). - PubMed
    1. Guerreiro, I. & Kind, J. Spatial chromatin organization and gene regulation at the nuclear lamina. Curr. Opin. Genet. Dev.55, 19–25 (2019). - PMC - PubMed
    1. Kind, J. & van Steensel, B. Genome-nuclear lamina interactions and gene regulation. Curr. Opin. Cell Biol.22, 320–325 (2010). - PubMed
    1. van Steensel, B. & Belmont, A. S. Lamina-associated domains: links with chromosome architecture, heterochromatin, and gene repression. Cell169, 780–791 (2017). - PMC - PubMed