. 2024 Sep 17;10(1):96.
doi: 10.1038/s41421-024-00715-7.

Targeting SNRNP200-induced splicing dysregulation offers an immunotherapy opportunity for glycolytic triple-negative breast cancer

Affiliations

Targeting SNRNP200-induced splicing dysregulation offers an immunotherapy opportunity for glycolytic triple-negative breast cancer

Wenxiao Yang et al. Cell Discov. .

Abstract

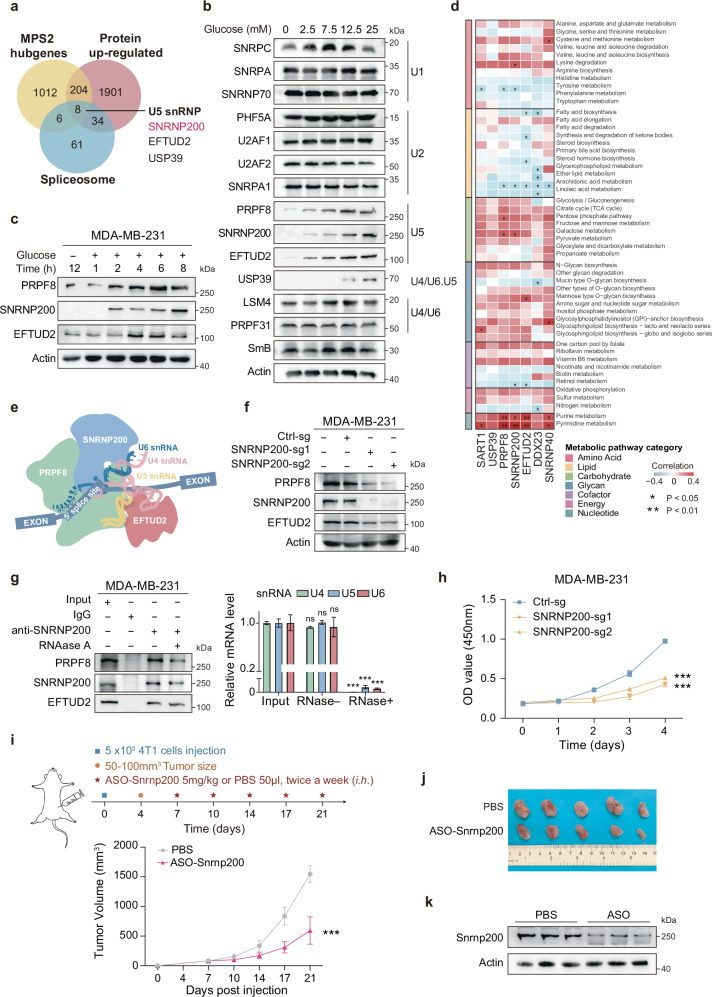
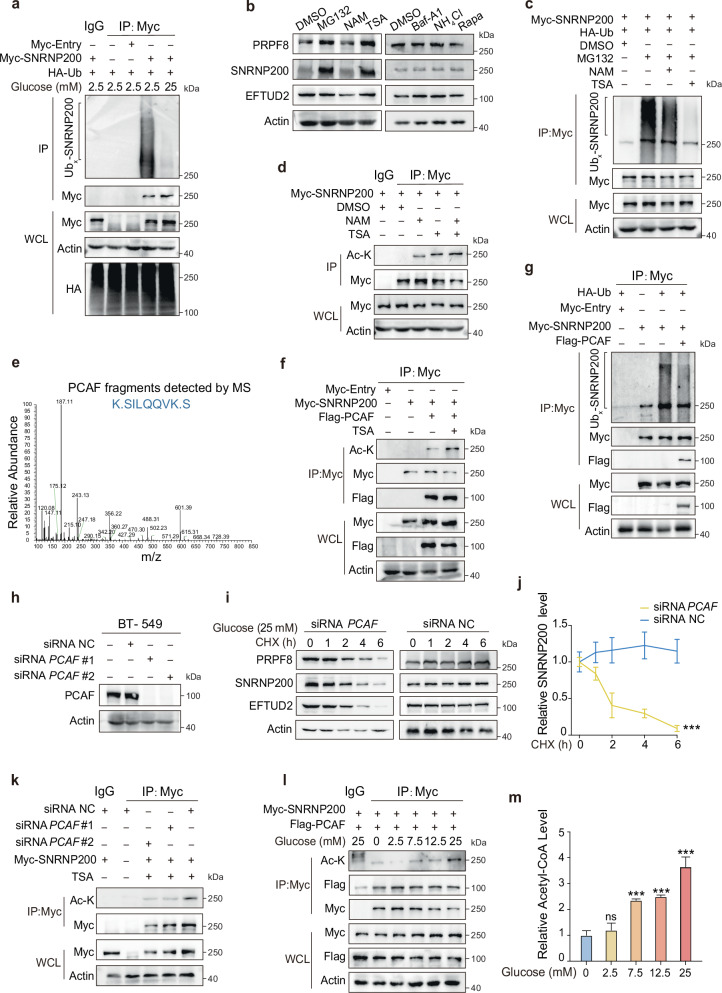
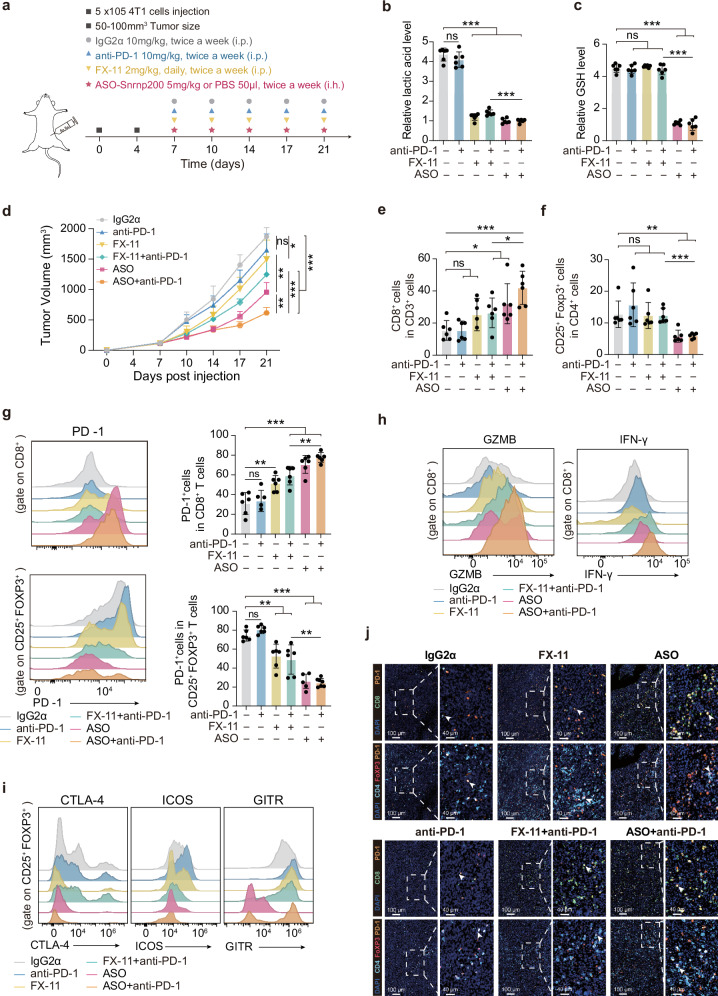
Metabolic dysregulation is prominent in triple-negative breast cancer (TNBC), yet therapeutic strategies targeting cancer metabolism are limited. Here, utilizing multiomics data from our TNBC cohort (n = 465), we demonstrated widespread splicing deregulation and increased spliceosome abundance in the glycolytic TNBC subtype. We identified SNRNP200 as a crucial mediator of glucose-driven metabolic reprogramming. Mechanistically, glucose induces acetylation at SNRNP200 K1610, preventing its proteasomal degradation. Augmented SNRNP200 then facilitates splicing key metabolic enzyme-encoding genes (GAPDH, ALDOA, and GSS), leading to increased lactic acid and glutathione production. Targeting SNRNP200 with antisense oligonucleotide therapy impedes tumor metabolism and enhances the efficacy of anti-PD-1 therapy by activating intratumoral CD8+ T cells while suppressing regulatory T cells. Clinically, higher SNRNP200 levels indicate an inferior response to immunotherapy in glycolytic TNBCs. Overall, our study revealed the intricate interplay between RNA splicing and metabolic dysregulation, suggesting an innovative combination strategy for immunotherapy in glycolytic TNBCs.


Conflict of interest statement

The authors declare no competing interests.

Figures

Fig. 1
Fig. 1. A specific landscape of alternative RNA splicing linked to TNBC metabolic dysregulation.
a Workflow of the analytical process performed in this study. b Volcano plots illustrating the protein profiles of 2147 proteins displaying abnormal protein levels in TNBC (|log2-fold changes|>1, Benjamini‒Hochberg adjusted P < 0.01). A comprehensive set of 372 RNA-related proteins spanning various functional categories was meticulously color-coded for individual representation. c Landscape of AS for TCGA samples (n = 1096), as determined by splicing event PSI scores (on the left) and the expression levels of 109 core spliceosome genes (on the right). Each point corresponds to an individual sample, with color coding denoting their sample types, including normal tissues, non-TNBC, and MPSs. The position of each sample is computed as a t-SNE representation of the higher-dimensional splice event PSI matrix and expression matrix. d Top: global differences in spliceosome gene expression between basal, non-basal, and normal tissues in the FUSCC-TNBC cohort (n = 360). The distribution distances (r.m.s.d.) were calculated between basal tumors and corresponding normal tissues (red), non-basal tumors and corresponding normal tissues (green), and different samples of normal tissues (navy). Bottom: global differences in spliceosome gene expression between MPS subtypes in the FUSCC-TNBC cohort. The distribution distances (r.m.s.d.) were calculated between MPS1 (blue), MPS2 (red), and MPS3 (yellow) tumors and their corresponding normal tissues. P values were obtained from the two-sided Wilcoxon rank-sum test and the two-sided Kruskal–Wallis test (***P < 0.001). The centerline indicates the median, and the bounds of the box indicate the 25th and 75th percentiles. e Heatmap displaying normalized expression levels of 42 core spliceosome genes upregulated in tumors for each individual sample in the FUSCC-TNBC cohort. The sample types, four TNBC transcriptomic subtypes, and three TNBC metabolic subtypes were annotated. f Volcano plot of the 594 annotated metabolites between MPS1 and MPS2. Significantly differentially abundant metabolites are colored blue for upregulated MPS1 and red for upregulated MPS2. g mRNA expression of GAPDH, GSR, GSS, LDHA, LDHB, PFKM, PFKP, and UGP2 in the three MPS subtypes in the FUSCC-TNBC cohort (Wilcoxon test). The centerline indicates the median, and the bounds of the box indicate the 25th and 75th percentiles. IM immunomodulatory subtype, LAR luminal androgen receptor, BLIS basal-like immune-suppressed subtype, MES mesenchymal-like subtype, AMP adenosine monophosphate, F-1,6-BP fructose 1,6-diphosphate, NAD nicotinamide adenine dinucleotide, SAM S-adenosylmethionine, 3’,5’-ADP adenosine 3’,5’-diphosphate.
Fig. 2
Fig. 2. SNRNP200 is a crucial regulator of glycolytic TNBCs, promoting tumor proliferation both in vitro and in vivo.
a Venn diagram depicting the overlap between the MPS2 hub genes and the 42 spliceosome genes whose protein levels were upregulated in TNBC. b MDA-MB-231 cells were cultured in media supplemented with glucose at the indicated concentrations for 16 h. The cell lysates were subjected to immunoblotting. c MDA-MB-231 cells were glucose-starved for 12 h and then stimulated with glucose (25 mM) for the indicated times. The cell lysates were subjected to immunoblotting. d Correlation coefficient heatmap illustrating associations between normalized mRNA expression levels of upregulated U5 snRNP genes in tumors and enrichment scores of metabolic pathways via Spearman’s correlation analysis in the FUSCC-TNBC cohort (*P < 0.05; **P < 0.01). e Diagram depicting the U5 snRNP core components. f Western blot analysis of SNRNP200, EFTUD2, and PRPF8 expression levels in control and SNRNP200-knockdown MDA-MB-231 cells. g MDA-MB-231 cells were immunoprecipitated with an anti-SNRNP200 antibody, with IgG serving as a negative control. The IP data were analyzed by western blot analysis (on the left). qPCR analysis of the U4, U5, and U6 snRNA levels in the input, RNase A, and RNase A+ groups. The relative U4, U5, and U6 snRNA levels were normalized to that of the input using the 2−Ct method (on the right). qPCR analysis data are presented as the mean ± SEM. h CCK-8 proliferation assay in control and SNRNP200-knockdown MDA-MB-231 cells. i Schematic outline showing the Snrnp200-targeted ASO treatment timeline: 4T1 mouse breast cancer cells were subcutaneously injected into BALB/c mice. When the tumors reached 50–100 mm3, the mice were treated with ASO-Snrnp200 (5 mg/kg subcutaneous injection, twice a week) or PBS (50 µL, subcutaneous injection, twice a week) for 2 weeks (n = 5 mice/group). Tumor growth in different groups. The data are presented as the mean ± SEM. j A representative image of 4T1 tumors illustrating the effect of ASO-Snrnp200 treatment (n = 5 mice/group). k Western blot analysis of mouse Snrnp200 protein expression in tumor tissues from 4T1 cell-derived xenografts. The data are representative of three independent biological replicates. For gi, the data were compared using Student’s t-test if the data in each group were normally distributed: ***P < 0.001; ns not significant, P > 0.05.
Fig. 3
Fig. 3. Elevated glucose levels trigger PCAF-mediated acetylation of SNRNP200.
a HEK293T cells were transfected with Myc-tagged SNRNP200 and HA-Ub as indicated and treated with glucose at either 2.5 mM or 25 mM. The cells were harvested for ubiquitylation analysis. b Immunoblot analysis of SNRNP200, EFTUD2, and PRPF8 protein levels in BT-549 cells treated with or without nicotinamide (NAM, 5 mM, 6 h), TSA (10 μM, 16 h), Baf-A1 (200 nM, 16 h), NH4Cl (20 mM, 16 h), or Rapa (1 μM, 16 h). MG132 treatment (10 μM, 12 h) was used as a positive control. c, d After treatment with or without NAM, TSA, or MG132, the ubiquitylation levels (c) and acetylation levels (d) of SNRNP200 in HEK293T cells were measured by immunoblotting with the indicated antibodies. e Endogenous PCAF was immunoprecipitated from HEK293T cells with an anti-SNRNP200 antibody and analyzed by LC-MS. The data show MS2 spectra for a signature peptide of PCAF. f Myc-SNRNP200 was cotransfected with Flag-tagged PCAF into HEK293T cells. Acetylation was determined by immunoblotting. Co-IP assays were performed to determine the interaction between SNRNP200 and PCAF. g Flag-tagged PCAF was cotransfected with Myc-tagged SNRNP200 and HA-tagged ubiquitin. The ubiquitylation of SNRNP200 was determined by IP-western blotting with an anti-HA antibody. h Western blot analysis of PCAF expression levels in control and PCAF-depleted BT-549 cells. i, j BT-549 cells maintained in 25 mM glucose were transfected with siPCAF or the control and treated with CHX as previously described. The endogenous SNRNP200, EFTUD2, and PRPF8 proteins were analyzed by immunoblotting (i) and quantified against actin (j). The data for the relative SNRNP200 levels are presented as the mean ± SEM. k BT-549 cells were transfected with siPCAF or the control. The acetylation levels of SNRNP200 were analyzed by immunoblotting. l BT-549 cells were treated with glucose at the indicated concentrations. The acetylation levels of SNRNP200 were analyzed by immunoblotting. Co-IP assays were performed to determine the dynamic interactions between PCAF and SNRNP200. m Acetyl-CoA levels were measured in BT-549 cells treated with glucose at the indicated concentrations. The relative acetyl-CoA levels are presented as the mean ± SEM. For j and m, the data were compared using Student’s t-test: ns not significant, P > 0.05; ***P < 0.001.
Fig. 4
Fig. 4. The acetylation of SNRNP200 at lysine 1610 safeguards it from proteasomal degradation.
a Endogenous SNRNP200 was immunoprecipitated from HEK293T cells and analyzed by LC-MS. The data show MS2 spectra for a signature peptide acetylated at K1610. b Alignment of the SNRNP200 protein sequence across different species. c A secondary structure model of SNRNP200 was visualized via SWISS-MODEL. The K1610 residue is highlighted with a different color. d HEK293T cells were transfected with Myc-tagged SNRNP200 WT, K1610R, or K1610Q plasmids for 36 h with or without TSA. The acetylation levels of SNRNP200 were quantified against immunoprecipitated Myc-tag and are presented as the mean ± SEM. e HEK293T cells were transfected with the indicated plasmids and treated with glucose at either 2.5 mM or 25 mM. Ubiquitylation analysis was revealed by immunoblotting. f HDAC1, HDAC2, and HDAC5 were overexpressed in HEK293T cells treated with or without TSA. The acetylation levels of SNRNP200 were determined by immunoblotting. Co-IP assays were performed to determine the interaction between SNRNP200 and HDAC5. g HEK293T cells were maintained in a medium supplemented with either 2.5 mM or 25 mM glucose. The SNRNP200 ubiquitylation levels were determined via IP-western blotting. Co-IP assays were performed to determine the dynamic interactions between SNRNP200 and HDAC5. h BT-549 cells were transfected with siRNF123 or the control. The levels of ubiquitinated SNRNP200 were analyzed by immunoblotting. i, j BT-549 cells maintained in 2.5 mM glucose were transfected with siRNF123 or the control and treated with CHX as previously described. The endogenous SNRNP200, EFTUD2, and PRPF8 proteins were analyzed by immunoblotting (i) and quantified against actin (j). The data for the relative SNRNP200 levels are presented as the mean ± SEM. k Working model illustrating the mutually exclusive acetylation and ubiquitylation of SNRNP200 in glycolytic TNBCs. For d and j, the data were compared using Student’s t-test: ns not significant, P > 0.05; *P < 0.05; **P < 0.01.
Fig. 5
Fig. 5. SNRNP200 enhances RNA splicing in genes encoding metabolic enzymes with weak 5’ splice sites.
a Enrichment networks of intron-retained transcripts in control and SNRNP200-knockdown MDA-MB-231 cells were analyzed and visualized by Metascape. Representative terms with kappa similarities above 0.3 formed a network and were depicted using Cytoscape software. b Sashimi plots depicting the RIs of GAPDH (top) and GSS (bottom). The number of RI reads is indicated (control sgRNA in blue, SNRNP200 sgRNA in red). c Representative RT-PCR validation of SNRNP200-regulated RI events in MDA-MB-231 cells. The structure of each isoform is illustrated in the diagrams. Individual data points are presented (n = 3; *P < 0.05; *P < 0.01; **P < 0.001; Student’s t-test). d A 5’ splice site strength analysis of RI events was carried out. Non-retained introns (NRIs) within the same set of genes were used for comparison (Wilcoxon rank-sum test). e Motif enrichment analysis of the same set of genes revealed that the most frequently identified motifs aligned with the consensus 5’ splice site sequences for both the RI and NRI. f The GC compositions of the RI and NRI were calculated by dividing the GC content of each intron by the average of its adjacent exons and compared by the Wilcoxon rank-sum test.
Fig. 6
Fig. 6. SNRNP200 enhances glycolysis and glutathione metabolism via RNA splicing.
a Volcano plot of the polar metabolites profiled in control and SNRNP200-knockdown MDA-MB-231 cells. Significantly differentially abundant metabolites are color-coded by individual category. b Volcano plot of the lipid profiles of control and SNRNP200-knockdown MDA-MB-231 cells. Metabolites with significant differences are color-coded according to their respective categories. Furthermore, the proportions of five distinct lipid categories in SNRNP200-knockdown MDA-MB-231 cells were assessed. The data were statistically analyzed using the chi-square test (***P < 0.001). c Images of the RIs of ALDOA, GAPDH, and GSS. d Western blot analysis of the expression levels of SNRNP200, ALDOA, GAPDH, and GSS in control and SNRNP200-knockdown MDA-MB-231 and BT-549 cells. e Comparison of the ECAR between control and SNRNP200-knockdown MDA-MB-231 cells. f Diagram summarizing metabolic genes involved in glycolysis, the TCA cycle, and glutamate metabolism. The diagram visually depicts normalized metabolite levels (boxes) and their respective upstream metabolic enzymes (circles) undergoing intron retention induced by SNRNP200 ablation. UDP uridine 5’-diphosphate, G-1-P glucose 1-phosphate, G-6-P glucose 6-phosphate, Gal-1-P galactose 1-phosphate, Ri-5-P ribulose 5-phosphate, R-5-P ribose 5-phosphate, PEP phosphoenolpyruvate, α-KG alpha-ketoglutarate, G-3-P glycerol 3-phosphate, 1,3-BPG glyceric acid 1,3-biphosphate, NADP nicotinamide adenine dinucleotide phosphate, FA fatty acids, GL glycerolipids, GP glycerophospholipids, SP sphingolipids, ST sterol lipids.
Fig. 7
Fig. 7. ASO-Snrnp200 synergistic immunotherapy amplifies the antitumor response in glycolytic tumors.
a Schematic outline showing Snrnp200-targeted ASO treatment or LDH inhibition combined with anti-PD-1 antibody treatment of tumors: 5 × 105 4T1 mouse breast cancer cells were subcutaneously injected into BALB/c mice. When the tumors reached 50–100 mm3, the mice were treated with ASO-Snrnp200 (5 mg/kg subcutaneous injection, twice a week, n = 6 mice/group), FX-11 (2 mg/kg daily i.p. injection, daily), or PBS (50 µL, i.p. injection, daily) for 2 weeks combined with an isotype control or anti-PD-1 antibody (10 mg/kg, i.p. injection, twice a week). b, c Relative lactic acid (b) and GSH (c) levels in the six treatment groups. The data are presented as the mean ± SEM. d Tumor growth in different groups. The data are presented as the mean ± SEM. e, f Primary tumors from 4T1 model mice were harvested for flow cytometry to determine the percentages of CD8+ T cells among CD3+ T cells (e) and of Treg cells among CD4+ T cells (f). g The expression of PD-1 by CD8+ T cells (top) and Treg cells (bottom) in the tumor microenvironment was examined. Representative histograms and summary data are shown. The data are presented as the mean ± SEM. h Representative histogram plots showing GZMB+ and IFN-γ+ cells among CD8+ T cells. i Representative histogram plots showing CTLA4+, ICOS+, and GITR+ cells among Treg cells. j Representative multiplexed immunohistochemistry images of PD1+CD8+ T cells (top) and PD1+CD4+FOXP3+ T cells (bottom) in the TME. Scale bars, 100 μm or 40 μm. For bg, the data were compared using Student’s t-test if the data in each group were normally distributed (n = 6 mice/group; *P < 0.05; **P < 0.01; ***P < 0.001; ns not significant, P > 0.05).
Fig. 8
Fig. 8. There is limited immunotherapeutic efficacy in TNBC patients with elevated SNRNP200 levels.
a Overview of the I-SPY2 clinical trial (ClinicalTrials.gov: NCT01042379), which included 114 TNBC patients, with 29 receiving pembrolizumab plus chemotherapy and 85 receiving chemotherapy. b Bar chart illustrating SNRNP200 expression in 41 glycolytic TNBC patients with confirmed responses, categorized as pCR vs nonpCR. SNRNP200 expression was dichotomized by the median, and patient responses were stratified in both the immunotherapy and chemotherapy arms of the I-SPY2 clinical trial. c Expression of SNRNP200, normalized enrichment scores of MPS2-upregulated metabolic pathways, and proportions of representative infiltrating immune cells in the pembrolizumab group (MPS2, n = 15). d Overview of two scRNA-seq datasets, comprising a first cohort of 13 TNBC patients treated with pembrolizumab (BioKey study, ClinicalTrials.gov: NCT03197389) and a second cohort of 7 treatment-naïve TNBC patients (GSE176078). e Uniform manifold approximation and projection (UMAP) map of 70,190 cells color-coded for the indicated cell type. pDC plasmacytoid dendritic cell. PVLs perivascular-like cells. f UMAP map of 22,017 cancer cells grouped on the basis of AUCell values, with cells categorized as SG+ and SG. g Proportion of SG+ cancer cells in patients who responded or did not respond to immunotherapy. h Heatmap depicting normalized enrichment scores of MPS2-upregulated metabolic pathways in the indicated cell types. i Schematic cartoon depicting the mechanism by which targeting SNRNP200 promotes an antitumor immune response in glycolytic tumors. For b, g, the data were analyzed using the chi-squared test (*P < 0.05; ***P < 0.001; ns not significant, P > 0.05).

References

    1. Bianchini, G., De Angelis, C., Licata, L. & Gianni, L. Treatment landscape of triple-negative breast cancer—expanded options, evolving needs. Nat. Rev. Clin. Oncol.19, 91–113 (2022). 10.1038/s41571-021-00565-2 - DOI - PubMed
    1. Leon-Ferre, R. A. & Goetz, M. P. Advances in systemic therapies for triple negative breast cancer. BMJ381, e071674 (2023). 10.1136/bmj-2022-071674 - DOI - PubMed
    1. Jiang, Y. Z. et al. Genomic and transcriptomic landscape of triple-negative breast cancers: subtypes and treatment strategies. Cancer Cell35, 428–440.e5 (2019). 10.1016/j.ccell.2019.02.001 - DOI - PubMed
    1. Gong, Y. et al. Metabolic-pathway-based subtyping of triple-negative breast cancer reveals potential therapeutic targets. Cell Metab.33, 51–64.e9 (2021). 10.1016/j.cmet.2020.10.012 - DOI - PubMed
    1. Gong, T. Q. et al. Proteome-centric cross-omics characterization and integrated network analyses of triple-negative breast cancer. Cell Rep.38, 110460 (2022). 10.1016/j.celrep.2022.110460 - DOI - PubMed

LinkOut - more resources