

Bayesian spatio-temporal modeling of the Brazilian fire spots between 2011 and 2022
- PMID: 39285167
- PMCID: PMC11405523
- DOI: 10.1038/s41598-024-70082-6
Bayesian spatio-temporal modeling of the Brazilian fire spots between 2011 and 2022
Abstract
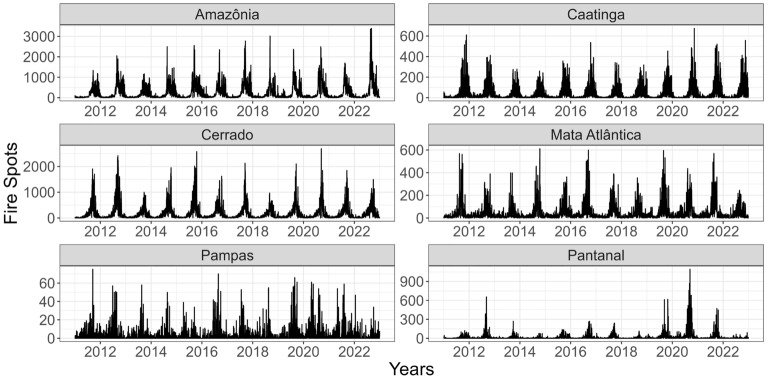
Wildfires are among the most common natural disasters in many world regions and actively impact life quality. These events have become frequent due to climate change, other local policies, and human behavior. Fire spots are areas where the temperature is significantly higher than in the surrounding areas and are often used to identify wildfires. This study considers the historical data with the geographical locations of all the "fire spots" detected by the reference satellites covering the Brazilian territory between January 2011 and December 2022, comprising more than 2.2 million fire spots. This data was modeled with a spatio-temporal generalized linear mixed model for areal unit data, whose inferences about its parameters are made in a Bayesian framework and use meteorological variables (precipitation, air temperature, humidity, and wind speed) and a human variable (land-use transition and occupation) as covariates. The meteorological variables humidity and air temperature showed the most significant impact on the number of fire spots for each of the six Brazilian biomes.
Keywords: Bayesian modeling; Brazilian wildfires; Spatio-temporal modeling; Wildfires risk factors.
© 2024. The Author(s).
Conflict of interest statement
The authors declare no competing interests.
Figures


References
-
- Marasini, J. B. Plantas alimentícias não convencionais em Urubici, SC. (2018).
-
- Lemos, A. L. F. & Silva, J. D. A. Desmatamento na Amazônia Legal: Evolução, causas, monitoramento e possibilidades de mitigação através do Fundo Amazônia. Floresta e Ambiente18, 98–108 (2024). 10.4322/floram.2011.027 - DOI
-
- Noutcheu, R., Oliveira, F. M., Wirth, R., Tabarelli, M., & Leal, I. R. (2024). Chronic human disturbance and environmental forces drive the regeneration mechanisms of a Caatinga dry tropical forest. Persp. Ecol. Conser.
-
- Hidasi-Neto, J., Gomes, N. M. A. & Pinto, N. S. A vegetação nativa do Cerrado é um refúgio para as aves na trajetória atual da mudança climática. Austral Ecol.49(1), e13336 (2024). 10.1111/aec.13336 - DOI
-
- Gonçalves, A. D. S. Arquivos pessoais de cientistas e conservacionistas: A experiência do Instituto Nacional da Mata Atlântica (INMA). Estudos Históricos (Rio de Janeiro)36, 5–22 (2023). 10.1590/s2178-149420230202 - DOI
LinkOut - more resources
Full Text Sources
