. 2024 Sep 16;15(1):8113.
doi: 10.1038/s41467-024-52432-0.

Post-transcriptional reprogramming by thousands of mRNA untranslated regions in trypanosomes

Affiliations

Post-transcriptional reprogramming by thousands of mRNA untranslated regions in trypanosomes

Anna Trenaman et al. Nat Commun. .

Abstract

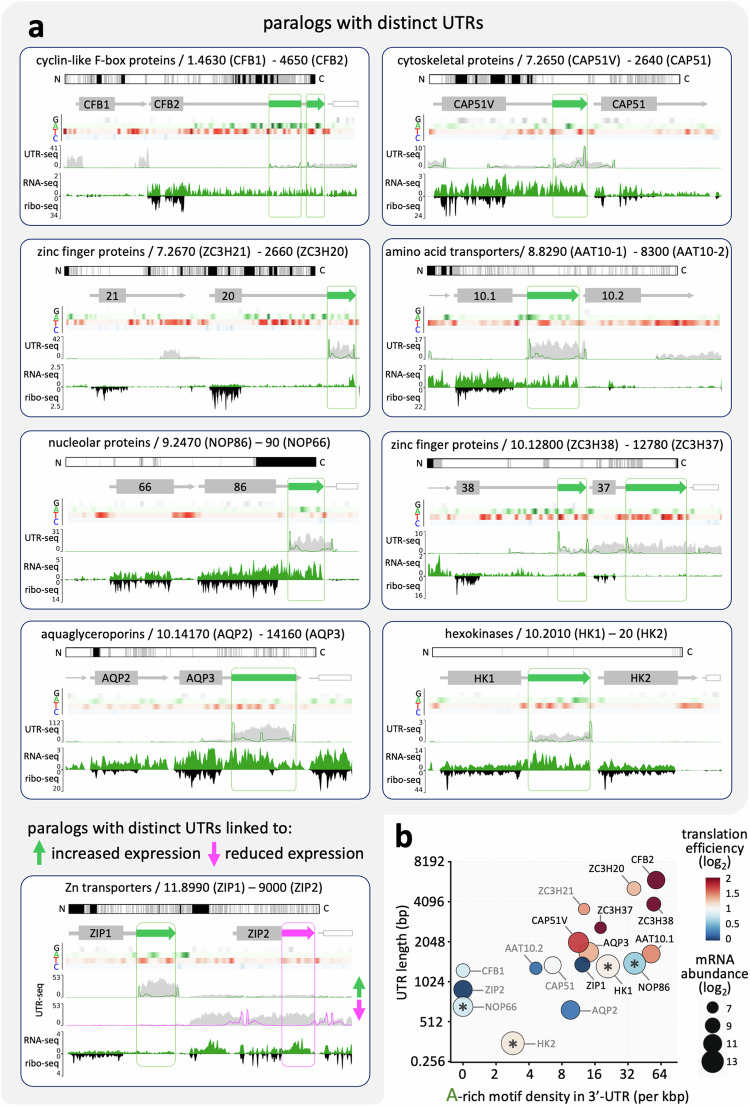
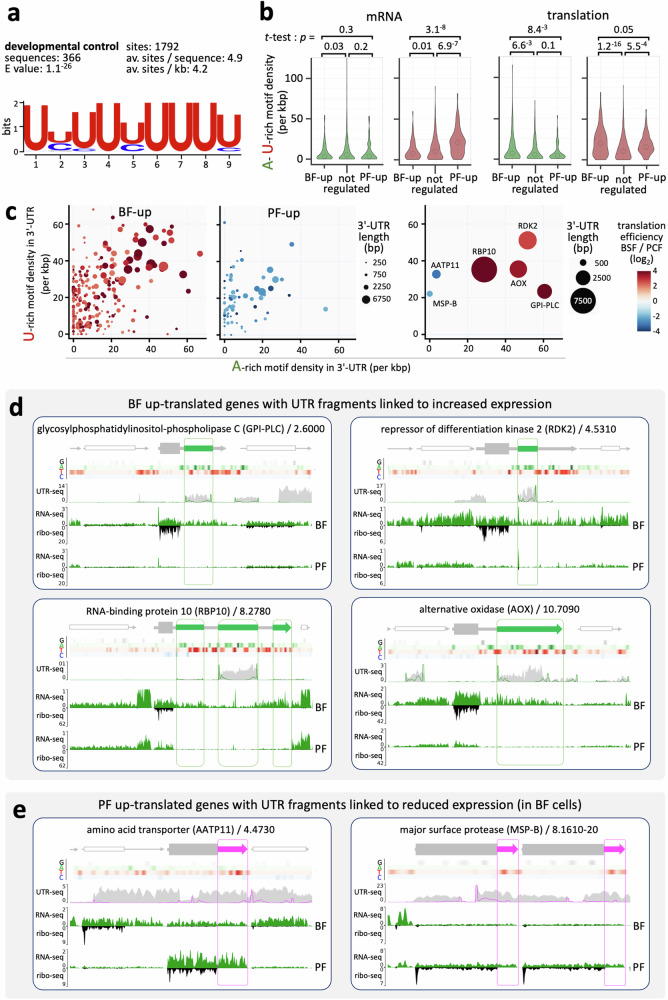
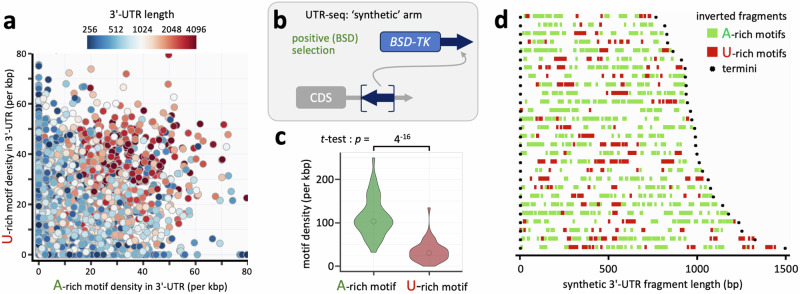
Although genome-wide polycistronic transcription places major emphasis on post-transcriptional controls in trypanosomatids, messenger RNA cis-regulatory untranslated regions (UTRs) have remained largely uncharacterised. Here, we describe a genome-scale massive parallel reporter assay coupled with 3'-UTR-seq profiling in the African trypanosome and identify thousands of regulatory UTRs. Increased translation efficiency was associated with dosage of adenine-rich poly-purine tracts (pPuTs). An independent assessment of native UTRs using machine learning based predictions confirmed the robust correspondence between pPuTs and positive control, as did an assessment of synthetic UTRs. Those 3'-UTRs associated with upregulated expression in bloodstream-stage cells were also enriched in uracil-rich poly-pyrimidine tracts, suggesting a mechanism for developmental activation through pPuT 'unmasking'. Thus, we describe a cis-regulatory UTR sequence 'code' that underpins gene expression control in the context of a constitutively transcribed genome. We conclude that thousands of UTRs post-transcriptionally reprogram gene expression profiles in trypanosomes.


Conflict of interest statement

The authors declare no competing interests.

Figures

Fig. 1
Fig. 1. A massive parallel 3’-UTR reporter assay.
a The pRPaiUTR reporter construct. A blasticidin S-deaminase (BSD) and thymidine kinase (TK) fusion gene, with positive or negative regulatory 3’-UTRs cloned immediately downstream of the stop codon, was placed under the control of a tetracycline-inducible rDNA promoter and flanked by homology regions (X1 is HYGΔ and X2 is rDNA) to integrate the full construct at the tagged rDNA spacer locus in the 2T1 T. brucei strain; both RNA polymerase I and RNA polymerase II are used to drive protein coding gene transcription in T. brucei. A constitutively expressed NPT cassette under the control of a bloodstream VSG expression site (ES) promoter was also included to allow selection of recombinants in the absence of tetracycline. b Dose response curves reveal relative blasticidin (BSD) resistance and ganciclovir (GCV) sensitivity when reporter expression is increased (green); see Supplementary Fig. 1a. c The cassette immediately downstream of the BSD-TK stop-codon facilitated high-efficiency library construction. pRPaiUTR was digested with BbsI and T semi-filled, while T. brucei genomic DNA was partially digested with Sau3AI and fragments of 1–3 kbp were G semi-filled prior to ligation. The FseI sites and index sequences facilitated assessment of library complexity and fragment orientation. d The massive parallel reporter assay. The plasmid library was used to assemble a T. brucei library, which was induced with tetracycline, selected with BSD or GCV, and subjected to UTR-seq. e We sampled the library at days 4, 6 and 8 (lighter to darker shading), extracted genomic DNA, amplified cloned library fragments by PCR, deep-sequenced the products, mapped reads to annotated 3’-UTRs, and compared the outputs using principal component analysis. f Mapped reads adjacent to 48,509 Sau3AI sites in the T. brucei genome were quantified. Data for the plasmid library and sequences recovered following 6 days of selection are shown.
Fig. 2
Fig. 2. Enrichment of 3’-UTR sequences following positive selection.
a The Circos plot shows an approx. 25 Mbp map of the T. brucei genome, incorporating eleven mega-base chromosomes, and encoding approx. 9000 genes. Polycistrons are indicated on the outer circle. Enrichment for DNA fragments inserted in the sense orientation in relation to the reporter, following blasticidin selection for positive control (green background), or ganciclovir selection for negative control (magenta background), is indicated. Scale is log2-fold-change relative to plasmid control, with values clipped when > 4. b The maps show UTR-seq read-density for three exemplar genes. The grey lines with arrowheads indicate the UTRs and transcription from left to right. Sense paired, indexed reads highlight the boundaries of hit fragments, and are indicated by the green lines, with total reads indicated in grey. c The boxplot shows length data after updating the T. brucei 3’-UTR annotations. Boxes indicate the interquartile range (IQR), the whiskers show the range of values within 1.5*IQR and a horizontal line indicates the median. The notches represent the 95% confidence interval for each median. n = 8115 (5’-UTR), 8258 (CDS), 8022 (3’-UTR).
Fig. 3
Fig. 3. Identification of thousands of regulatory 3’-UTRs.
a The violin plot shows relative enrichment of inter-CDS fragments cloned in their native or inverted orientation. Blasticidin selection for positive control; green, n = 1941 fragments. Ganciclovir selection for negative control; magenta, n = 2282 fragments. The open circles indicate median values, while t-tests were two-sided. b 3’-UTR associated fragments were ranked based on indexed read fold-change between the positive and negative selection screens. Previously published regulatory 3’-UTRs (see Supplementary Data 1) that feature as hits are highlighted. c The maps show UTR-seq read-density for two exemplar positive regulatory 3’-UTR fragments. Sense paired, indexed reads are indicated by the green lines, with total reads indicated in grey. UTR hit fragments are indicated as green boxes; with arrows indicating direction of transcription from left to right. RNA-seq (solid green) and ribosome profiling data (black) are also shown. The upper protein-map shows the relationship between the paralogs (PGKB-C) with identical amino acids shown in white, different amino acids in grey and additional segments in one of the proteins in black. d The maps show read-density for two exemplar negative regulatory 3’-UTRs. Sense indexed reads are indicated by the magenta line and UTR hit fragments are indicated as magenta boxed arrows. The paralogs compared in this case are NT8.1-2. Other details as for (c). e The map shows read-density for the hexose transporter locus with both positive and negative regulatory 3’-UTR fragments. Other details as for (c, d). f The boxplot shows length data for putative positive (n = 844) and negative (n = 468) regulatory 3’-UTRs associated with hit fragments that also include downstream mRNA processing sequences. Boxes indicate the interquartile range (IQR), the whiskers show the range of values within 1.5*IQR and a horizontal line indicates the median. The notches represent the 95% confidence interval for each median. The t-test was two-sided.
Fig. 4
Fig. 4. Poly-purine tracts are enriched in the 3’-UTRs of highly translated mRNAs.
a The boxplot shows nucleobase composition for positive (n = 833) and negative (n = 464) regulatory hit fragments of > 20 b in length, that also include downstream mRNA processing sequences. Boxes indicate the IQR, the whiskers show the range of values within 1.5*IQR and a horizontal line indicates the median. The notches represent the 95% confidence interval for each median, while t-tests were two-sided. b The poly-purine tract (pPuT) motif shown was enriched in positive regulatory hit fragments relative to the negative fragments. c The plot shows fold-enrichment of hit fragments in the screen relative to published measures of translation efficiency. The t-test was two-sided. d The plot shows number of A-rich motifs shown in b in 3’-UTRs relative to published measures of translation efficiency. n = 4220; FIMO settings ‘p < 0.01’. e The plot shows published measures of translation efficiency relative to density of A-rich motifs (FIMO setting ‘p < 0.01’), 3’-UTR length (all > 250 b), and mRNA abundance. n = 3608. f The maps show UTR-seq read-density for four exemplar positive regulatory 3’-UTRs. Tracks showing nucleobase density are included. Other details as for Fig. 3c. Numbers of pPuT motifs in each UTR and translation efficiency (TE) measures are also indicated.
Fig. 5
Fig. 5. Poly-purine tracts are enriched in the UTRs of highly expressed paralogs.
a The maps show UTR-seq read-density for nine tandem paralog pairs, all with positive regulatory 3’-UTR hit fragments, > 10 A-rich motifs (FIMO setting ‘p < 0.01’) in the 3’-UTR of one paralog, and with < 33% the number of A-rich motifs in the other paralog. Tracks showing nucleobase density are included. Other details as for Fig. 3c, d. b The plot shows published measures of translation efficiency and mRNA abundance relative to density of A-rich motifs (FIMO setting ‘p < 0.01’) and 3’-UTR length for the paralog pairs in a. The darker text labels indicate those genes with hit-fragments in the positive selection screen. *, translation efficiency measures appear similar for NOP66/86 and for hexokinases because the coding sequences are largely identical. The 3’-UTRs are distinct, however, and reveal differential expression (a).
Fig. 6
Fig. 6. Predicting translation efficiency using UTR sequences alone.
a The plots show nucleobase composition for 5’-UTRs of >49 b, CDSs of >199 b, and 3’-UTRs of > 99 b, relative to published measures of translation efficiency. b Machine learning model evaluation based on 3’-UTR sequences. The upper plot shows translation efficiency values for the test set (n = 2020 genes) compared with the model predictions. A linear regression line is shown. The lower plot shows the SHAP values for each gene and for the top eight features that contribute to the predictions. The colour scale reflects relative contribution to high (red) or low (blue) translation efficiency. The dots are jittered in the y-axis to illustrate the distribution of the SHAP values. Am2, A-tracts longer than 5 allowing 2 mismatches; Cm2, C-tracts longer than 5 allowing 2 mismatches; AGm2, AG-tracts longer than 5 allowing 2 mismatches. c Machine learning model evaluation based on 5’-UTR and 3’-UTR sequences. n = 2016 genes. Other details as in panel b.
Fig. 7
Fig. 7. Poly-purine and -pyrimidine rich 3’-UTRs in bloodstream up-translated mRNAs.
a The motif shown was enriched in 3’-UTRs that displayed >5-fold upregulated translation in bloodstream-form cells relative to control UTRs ( < 10% difference between life-cycle stages; n = 1450). b The violin plots on the left show motif density for 3’-UTRs of >250 b that displayed >4-fold upregulated mRNA abundance in bloodstream-form cells (BF-up; n = 139), or insect-stage, procyclic form cells (PF-up; n = 73), relative to control UTRs ( < 10% difference between life-cycle stages; n = 999). The violin plots on the right show motif density for 3’-UTRs of >250 b that displayed >4-fold upregulated translation in bloodstream-form cells (BF-up; n = 278), or insect-stage, procyclic form cells (PF-up; n = 81), relative to control UTRs ( < 10% difference between life-cycle stages; n = 818). Data are shown for the A-rich poly-purine motif in Fig. 4b, and for the U-rich poly-pyrimidine motif in Fig. 7a, (FIMO settings ‘p < 0.01’). Open circles indicate median values while t-tests were one-sided. c The plots show density of A-rich motifs and U-rich motifs (FIMO settings ‘p < 0.01’), and 3’-UTR length and also published ratios of translation efficiency for the bloodstream form up-translated and procyclic form up-translated sets of transcripts described in (b). The plot on the right shows data for those six exemplar 3’-UTRs detailed in (d, e), four from the BF-up set and two from the PF-up set. d The maps show UTR-seq read-density for four exemplar 3’-UTRs associated with bloodstream form up-translated genes and with positive regulatory hit fragments in the screen. Tracks showing nucleobase density are included. Other details as for Fig. 3c. e The maps show UTR-seq read-density for two exemplar 3’-UTRs associated with insect-stage up-translated genes and with negative regulatory hit fragments in the screen. Tracks showing nucleobase density are included; other details as for Fig. 3d.
Fig. 8
Fig. 8. Synthetic positive regulatory 3’-UTRs are enriched in poly-purine tracts.
a The plot shows 3’-UTR length relative to density of A-rich motifs and U-rich motifs (FIMO settings ‘p < 0.01’). n = 4891; UTRs of > 250 b. b The schematic shows assessment of hit fragments in the positive selection arm of the MPRA that were derived from native 3’-UTRs, but inverted relative to their native orientation. The t-test was one-sided. c The violin plot shows motif density for all significantly enriched synthetic fragments of > 500 b. n = 43. Data are shown for the A-rich poly-purine motif in Fig. 4b, and for the U-rich poly-pyrimidine motif in Fig. 7a (FIMO settings ‘p < 0.01’). Open circles indicate median values. d The maps show the distribution of A-rich and U-rich motifs in those hit fragments of between 750 and 1500 b in length.
Fig. 9
Fig. 9. A model for UTR-based post-transcriptional expression control in T. brucei.
a Poly-purine tracts (pPuTs) in 3’-UTRs drive increased translation in a dosage- and density-dependent manner. b pPuTs and poly-pyrimidine tracts (pPyTs) in 3’-UTRs interact such that pPyTs mask pPuTs and reduce gene expression in procyclic form (PF, insect stage) cells. Changes in secondary structure, possibly due to temperature differences, could be responsible for pPuT (un)masking. 5’-UTR sequences may behave similarly.

References

    1. Clayton, C. Regulation of gene expression in trypanosomatids: living with polycistronic transcription. Open Biol.9, 190072 (2019). 10.1098/rsob.190072 - DOI - PMC - PubMed
    1. de Freitas Nascimento, J., Kelly, S., Sunter, J. & Carrington, M. Codon choice directs constitutive mRNA levels in trypanosomes. Elife7, e32467 (2018). - PMC - PubMed
    1. Fadda, A. et al. Transcriptome-wide analysis of trypanosome mRNA decay reveals complex degradation kinetics and suggests a role for co-transcriptional degradation in determining mRNA levels. Mol. Microbiol94, 307–326 (2014). 10.1111/mmi.12764 - DOI - PMC - PubMed
    1. Jeacock, L., Faria, J. & Horn, D. Codon usage bias controls mRNA and protein abundance in trypanosomatids. Elife7, e32496 (2018). - PMC - PubMed
    1. Jensen, B. C. et al. Extensive stage-regulation of translation revealed by ribosome profiling of Trypanosoma brucei. BMC Genomics15, 911 (2014). 10.1186/1471-2164-15-911 - DOI - PMC - PubMed

Publication types

MeSH terms

Associated data

LinkOut - more resources