. 2024 Sep 17;10(1):407.
doi: 10.1038/s41420-024-02176-z.

Neural stem cells derived from α-synuclein-knockdown iPS cells alleviate Parkinson's disease

Affiliations

Neural stem cells derived from α-synuclein-knockdown iPS cells alleviate Parkinson's disease

Chie-Hong Wang et al. Cell Death Discov. .

Abstract

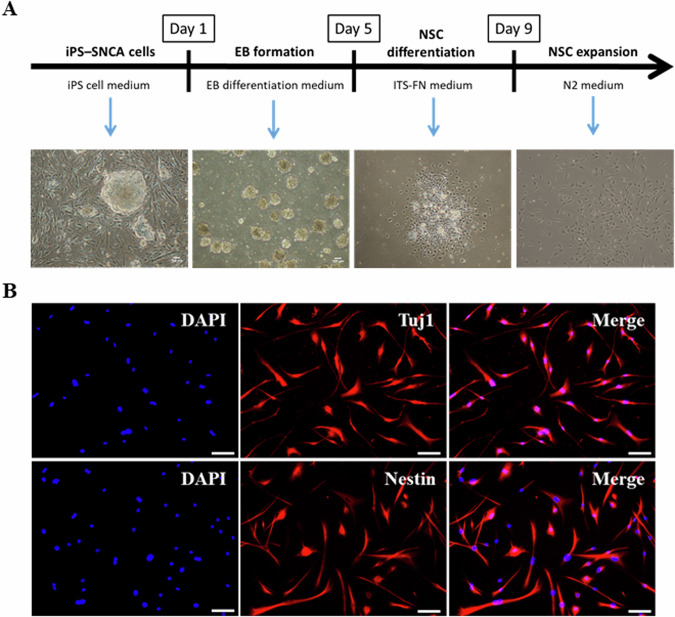
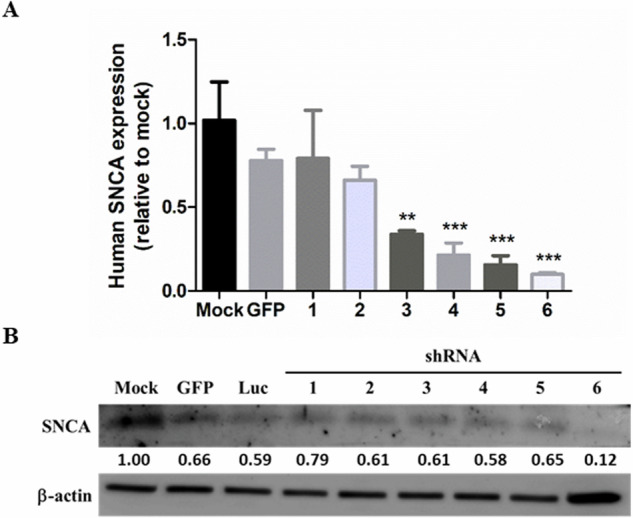
Stem cells have the potential to replace damaged or defective cells and assist in the development of treatments for neurodegenerative diseases, including Parkinson's disease (PD) and Alzheimer's disease. iPS cells derived from patient-specific somatic cells are not only ethically acceptable, but they also avoid complications relating to immune rejection. Currently, researchers are developing stem cell-based therapies for PD using induced pluripotent stem (iPS) cells. iPS cells can differentiate into cells from any of the three germ layers, including neural stem cells (NSCs). Transplantation of neural stem cells (NSCs) is an emerging therapy for treating neurological disorders by restoring neuronal function. Nevertheless, there are still challenges associated with the quality and source of neural stem cells. This issue can be addressed by genetically edited iPS cells. In this study, shRNA was used to knock down the expression of mutant α-synuclein (SNCA) in iPS cells that were generated from SNCA A53T transgenic mice, and these iPS cells were differentiated to NSCs. After injecting these NSCs into SNCA A53T mice, the therapeutic effects of these cells were evaluated. We found that the transplantation of neural stem cells produced from SNCA A53T iPS cells with knocking down SNCA not only improved SNCA A53T mice coordination abilities, balance abilities, and locomotor activities but also significantly prolonged their lifespans. The results of this study suggest an innovative therapeutic approach that combines stem cell therapy and gene therapy for the treatment of Parkinson's disease.


Conflict of interest statement

The authors declare no competing interests.

Figures

Fig. 1
Fig. 1. Generation of iPS cells from mouse embryonic fibroblasts.
A Schematic illustration of the iPS cell reprogramming protocol. MEFs isolated for SNCA A53T mice were transduced with lentiviral vectors encoding Yamanaka factors. Afterward, the ES cell-like colonies were seeded onto mitomycin C-treated feeder cells and maintained in an iPS medium. B Representative images of AP-positive iPS colonies. The photos were documented by a phase-contrast microscope at 40× and 100× magnification, respectively. Scale bar: 200 μm. C Immunofluorescent staining of pluripotency markers SSEA1 and Nanog in iPS cells (red: SSEA1 and Nanog). Nuclei were stained with DPAI (blue). Digital images were taken with a fluorescence microscope (scale bar: 100 μm). D Analysis of the iPS cells for differentiation potential. The iPS cells were induced to spontaneously differentiate into three germ layers through embryoid bodies (EBs) formation. Differentiated cells expressed the markers for endoderm (GATA4), mesoderm (SMA), and ectoderm (Tuj1). Nuclei were stained with DPAI (blue). Digital images were taken with a fluorescence microscope (scale bar: 50 μm).
Fig. 2
Fig. 2. Differentiation of the iPS cells into neural stem cells.
A Schematic illustration of the neural stem cell differentiation protocol. Digital images were taken with a phase-contrast microscope (scale bar: 100 μm). B Immunofluorescence staining for NSC markers Tuj1 (red, upper panel) and Nestin (red, lower panel) in NSCs. Nuclei were stained with DPAI (blue). Digital images were taken with a fluorescence microscope (scale bar: 20 μm).
Fig. 3
Fig. 3. Evaluation of the knockdown efficiencies of SNCA shRNAs.
A The expression levels of human SNCA mRNA in GBM8901 cells transfected with shRNAs against GFP and SNCA. The GBM8901 cells were transfected for 48 h and collected for real-time PCR analysis. The data were collected from at least three independent experiments. Bars represent mean and SD. Differences between the control group (mock) and experimental groups (GFP and shRNA-1 to shRNA-6) were evaluated by one-way analysis of variance and the Newman-Keuls Multiple Comparison Test. P < 0.05 indicates statistical significance (***P < 0.001). (shRNA-6 vs Mock, GFP, shRNA-1 and shRNA-2: P < 0.001; shRNA-5 vs Mock, shGFP, shRNA-1 and shRNA-2: P < 0.001; shRNA-4 vs Mock, GFP, shRNA-1 and shRNA-2: P < 0.001; shRNA-3 vs Mock GFP and shRNA-1: P < 0.001; shRNA-3 vs shRNA-2: P < 0.01; shRNA-2 vs Mock: P < 0.05). B Representative western blot images of SNCA in GBM8901 cells. Western blot analyses of human SNCA in GBM8901 cells following transfection with either shRNA against GFP, luciferase, or SNCA. The shRNAs against GFP and luciferase were used as negative controls. The signal was quantified by ImageJ software.
Fig. 4
Fig. 4. Exploration of the therapeutic effects of NSCs and NSC-shSNCA cells on behavioral tests.
A Schematic illustration of the behavior analysis protocol. At the age of 5 months, six training sessions were conducted for SNCA A53T transgenic mice over 2 weeks. Following the last training, mice were transplanted with NSCs or NSC-shSNCA cells. In a control group (mock), mice were injected with normal saline. NSCs and NSC-shSNCA cells were assessed for their therapeutic effects by B beam walking (mock vs NSC: week 15 to week 13, P < 0.001; mock vs NSC-shSNCA: week 7, P < 0.01, week 5 and 9 to 15, P < 0.001; NSC vs NSC-shSNCA: week 13, P < 0.05, week 15, P < 0.001), C rotarod (mock vs NSC: week 5 to week 15, P < 0.001; mock vs NSC-shSNCA: week 5 to week 15, P < 0.001; NSC vs NSC-shSNCA: NS), D total traveled distance (mock vs NSC: week 13, P < 0.05; mock vs NSC-shSNCA: NS; NSC vs NSC-shSNCA: NS), E locomotion time (mock vs NSC: week 13, P < 0.01, week 15, P < 0.05; mock vs NSC-shSNCA: week 15, P < 0.01; NSC vs NSC-shSNCA: NS), and F rest time (mock vs NSC: week 13 and 15, P < 0.01; mock vs NSC-shSNCA: week 15, P < 0.01; NSC vs NSC-shSNCA: NS). The behavioral assessment was conducted 1 day (week 0) before transplantation and every 7 days thereafter for 22 weeks. Data are presented as mean ± SEM values (BF). Behavioral data were compared by two-way analysis of variance (ANOVA) for time and treatment effects followed by a post hoc Bonferroni test (corrected for multiple comparisons). G Overall survival curves for transplanted mice in the behavior tests. Survival analysis was done using the Kaplan-Meier estimator and the log-rank test for group comparison. Variables with a significant P-value in the univariate analysis were exposed to a multivariate analysis using Cox regression proportional hazard model. GraphPad Prism 5.01 (San Diego, CA, USA) was used for analysis with a significance level of P < 0.05. NS stands for not statistically significant.
Fig. 5
Fig. 5. Exploration of the TH-positive and apoptotic cells in PD mice brains.
A Representative images of TH-positive cells in the SN region. Brain samples were collected from C57BL/6J mice (WT) and mice in the behavior tests (mock, NSC, and NSC-shSNCA). Frozen sections of the SN region were prepared and stained with the dopaminergic neuron marker, TH (red). B The TH-positive cells were quantified by ImageJ software. At least three sections in each group were evaluated. One-way ANOVA followed by the Newman-Keuls test for equal variances was used to evaluate the differences. C Representative images of apoptotic cells in the SN region. Frozen sections of the SN region from the aforementioned samples were stained with a TUNEL assay kit. The apoptotic cells were visualized by green fluorescence. D The apoptotic cells were quantified by ImageJ software. At least three sections in each group were evaluated. One-way ANOVA followed by the Newman-Keuls test for equal variances was used to evaluate the differences. Bars represent mean and SD. GraphPad Prism 5.01 (San Diego, CA, USA) was used for analysis with a significance level of P < 0.05 (**P < 0.01).
Fig. 6
Fig. 6. Schematic illustration of genetically edited iPS cell-derived NSCs rescue Parkinson’s disease.
In this study, we isolated MEFs from SNCA A53T mice and reprogrammed these cells into iPS cells. After knocking down the expression of SNCA, these iPS cells were differentiated into NSCs and transplanted into SNCA A53T mice. Our animal study demonstrated that mice treated with NSCs exhibited improved balancing, coordination, and locomotion activities. Furthermore, the mice treated with NSC-shSNCA cells showed prolonged lifespans.

References

    1. Masato A, Plotegher N, Boassa D, Bubacco L. Impaired dopamine metabolism in Parkinson’s disease pathogenesis. Mol Neurodegener. 2019;14:35. - PMC - PubMed
    1. Zhang W, Phillips K, Wielgus AR, Liu J, Albertini A, Zucca FA, et al. Neuromelanin activates microglia and induces degeneration of dopaminergic neurons: implications for progression of Parkinson’s disease. Neurotox Res. 2011;19:63–72. - PMC - PubMed
    1. Yates D. Taking a closer look at PD pathology. Nat Rev Neurosci. 2019;20:511. - PubMed
    1. Armstrong MJ, Okun MS. Diagnosis and treatment of Parkinson disease: a review. JAMA. 2020;323:548–60. - PubMed
    1. Pahwa R, Lyons KE. Levodopa-related wearing-off in Parkinson’s disease: identification and management. Curr Med Res Opin. 2009;25:841–9. - PubMed

LinkOut - more resources