. 2024 Sep 16;14(1):21555.
doi: 10.1038/s41598-024-72938-3.

Profiling of metabolic dysregulation in ovarian cancer tissues and biofluids

Affiliations

Profiling of metabolic dysregulation in ovarian cancer tissues and biofluids

Tsuyoshi Ohta et al. Sci Rep. .

Abstract

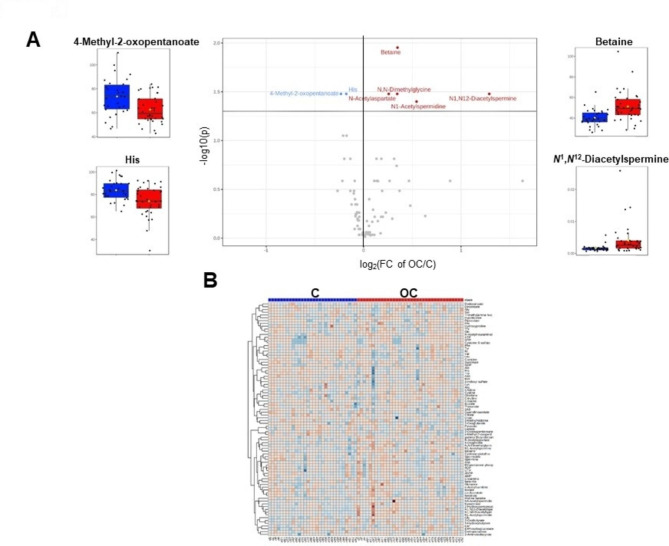
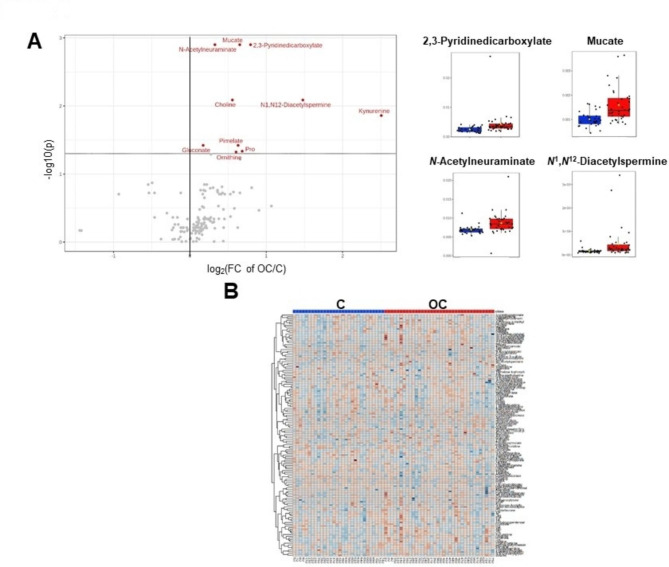
Ovarian cancer (OC) is the most lethal gynecologic cancer, mainly due to late diagnosis with widespread peritoneal spread at first presentation. We performed metabolomic analyses of ovarian and paired control tissues using capillary electrophoresis-mass spectrometry and liquid chromatography-mass spectrometry to understand its metabolomic dysregulation. Of the 130 quantified metabolites, 96 metabolites of glycometabolism, including glycolysis, tricarboxylic acid cycles, urea cycles, and one-carbon metabolites, showed significant differences between the samples. To evaluate the local and systemic metabolomic differences in OC, we also analyzed low or non-invasively available biofluids, including plasma, urine, and saliva collected from patients with OC and benign gynecological diseases. All biofluids and tissue samples showed consistently elevated concentrations of N1,N12-diacetylspermine compared to controls. Four metabolites, polyamines, and betaine, were significantly and consistently elevated in both plasma and tissue samples. These data indicate that plasma metabolic dysregulation, which the most reflected by those of OC tissues. Our metabolomic profiles contribute to our understanding of metabolomic abnormalities in OC and their effects on biofluids.

Keywords: Biofluids; Cancer tissues; Metabolomic dysfunction; Normal tissue; Ovarian cancer.


Conflict of interest statement

Masahiro Sugimoto received annual value of remuneration from Saliva Tech Co. Ldt. and Human Metabolome Technologies Inc. Masahiro Sugimoto and Makoto Sunamura received annual profit from share from Saliva Tech Co. Ldt. The other authors declare no conflict of interest.

Figures

Fig. 1
Fig. 1
Metabolomic profile of paired tumor (T) and normal (N) tissues. (A) Volcano plot of metabolite concentrations (µmol/g). X-axis indicates the log2-fold change (FC) of the averaged values of (T/N). Y-axis indicates the –log10(P-value) (Wilcoxon test corrected by FDR). Metabolites showing Y > 1.3, i.e., P < 0.05, were colored red or blue. Resentative metabolites were shown in box plots. (B) Heatmap of each metabolite’s higher (red) and lower (blue) concentration. Normalization by the sum, log transformation, and auto-scaling were used as options for data processing. Elucidation distance was used for clustering. (C) Pathway analysis. No normalization was used for data processing. X and Y-axes indicate the pathway impact and –log10(P-value). Ten representative pathways were labeled. (1) Pyruvate metabolism. (2) Glycolysis / Gluconeogenesis. (3) Propanoate metabolism. (4) Amino sugar and nucleotide sugar metabolism. (5) Citrate cycle (TCA cycle). (6) Glycine, serine and threonine metabolism. (7) Pentose and glucuronate interconversions. (8) Primary bile acid biosynthesis. (9) Cysteine and methionine metabolism. (10) Selenocompound metabolism.
Fig. 2
Fig. 2
Pathway visualization of metabolomic concentrations in paired ovarian tumor (OT) and normal tissues (NT). Individual data were visualized in dot plots. The left and right plots are the data of NT and OT. The metabolites showing P < 0.05 (Wilcoxon test corrected by FDR) were colored pink (higher in OT) and light blue (lower in OT). The Y-axis indicates the metabolite concentration (µmol/g).
Fig. 3
Fig. 3
Metabolomic profiles in plasma collected from the patients with ovarian cancer (OC) and controls (C). (A) Volcano plot of metabolite concentrations (µmol/g). X-axis indicates the log2-fold change (FC) of the averaged values of (OC/C). Y-axis indicates the –log10(P-value) (Wilcoxon test corrected by FDR). Representative metabolites were shown in box plots. (B) Heatmap visualization.
Fig. 4
Fig. 4
Metabolic profiles in urine. (A) Volcano plot of metabolite concentrations (no unit). X-axis indicates the log2-fold change (FC) of the averaged values of (OC/C). Y-axis indicates the –log10(P-value) (Wilcoxon test corrected by FDR). Representative metabolites were shown in box plots. (B) Heatmap visualization. Urinary metabolite concentration was calculated by dividing the creatinine concentration of each sample.
Fig. 5
Fig. 5
Metabolic profiles in saliva. (A) Volcano plot of metabolite concentrations (µmol/g). X-axis indicates the log2-fold change (FC) of the averaged values of (OC/C). Y-axis indicates the –log10(P-value) (Wilcoxon test corrected by FDR). Resentative metabolites were shown in box plots. (B) Heatmap visualization.
Fig. 6
Fig. 6
Metabolites consistently elevated in tissue and multiple biofluids. (A) The number of significantly different metabolites between plasma and tissues (FDR-corrected P-value < 0.05). (B) The number of significantly different metabolites in saliva, plasma, and urine samples (FDR-corrected P-value < 0.05). (C) ROC curves to discriminate OT from NT (tissue) and OC from C (biofluids). AUC, 95% confidential intervals, and P-values are described.

References

    1. Hanahan, D. & Weinberg, R. A. Hallmarks of cancer: The next generation. Cell144(5), 646–674. 10.1016/j.cell.2011.02.013 (2011). 10.1016/j.cell.2011.02.013 - DOI - PubMed
    1. Benjamin, D. I., Cravatt, B. F. & Nomura, D. K. Global profiling strategies for mapping dysregulated metabolic pathways in cancer. Cell Metab.16(5), 565–577. 10.1016/j.cmet.2012.09.013 (2012). 10.1016/j.cmet.2012.09.013 - DOI - PMC - PubMed
    1. Azad, R. K. & Shulaev, V. Metabolomics technology and bioinformatics for precision medicine. Brief. Bioinform. 20(6), 1957–1971. 10.1093/bib/bbx170 (2019). PMID: 29304189; PMCID: PMC6954408. 10.1093/bib/bbx170 - DOI - PMC - PubMed
    1. Jacob, M., Lopata, A. L., Dasouki, M. & Abdel Rahman, A. M. Metabolomics toward personalized medicine. Mass Spectrom Rev.38(3), 221–238. 10.1002/mas.21548 (2019). 10.1002/mas.21548 - DOI - PubMed
    1. Shulaev, V. Metabolomics technology and bioinformatics. Brief. Bioinform.7(2), 128–139. 10.1093/bib/bbl012 (2006). 10.1093/bib/bbl012 - DOI - PubMed

LinkOut - more resources