. 2024 Sep 17;31(1):91.
doi: 10.1186/s12929-024-01083-w.

CCL5 is essential for axonogenesis and neuronal restoration after brain injury

Affiliations

CCL5 is essential for axonogenesis and neuronal restoration after brain injury

Man-Hau Ho et al. J Biomed Sci. .

Abstract

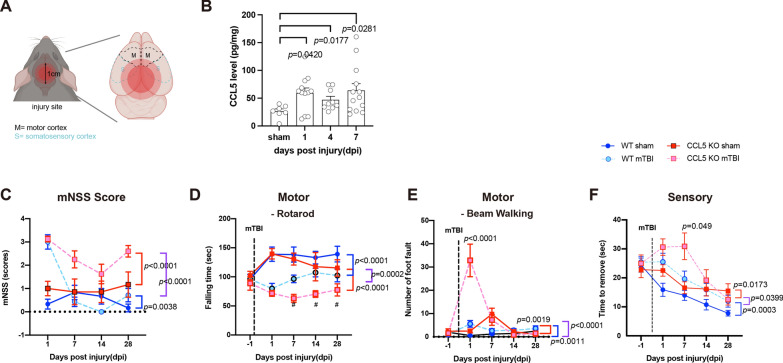
Background: Traumatic brain injury (TBI) causes axon tearing and synapse degradation, resulting in multiple neurological dysfunctions and exacerbation of early neurodegeneration; the repair of axonal and synaptic structures is critical for restoring neuronal function. C-C Motif Chemokine Ligand 5 (CCL5) shows many neuroprotective activities.

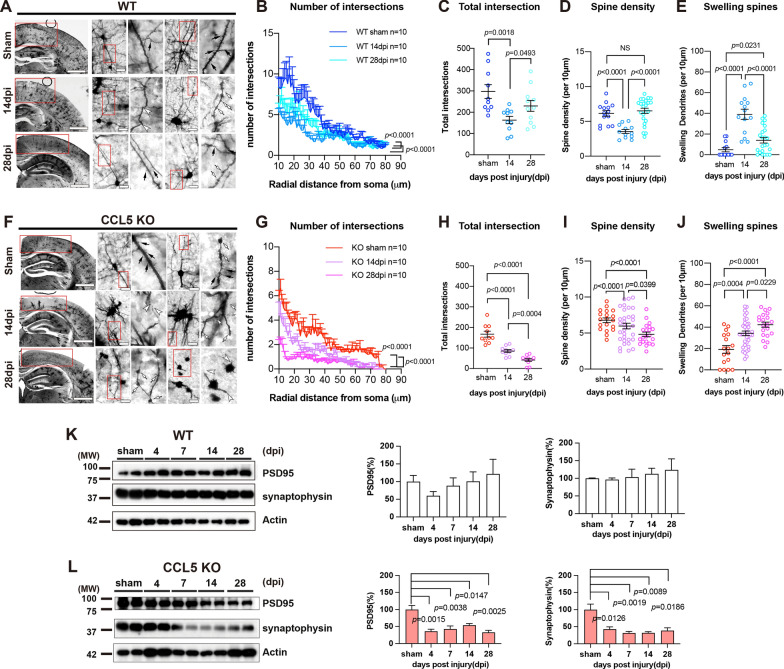
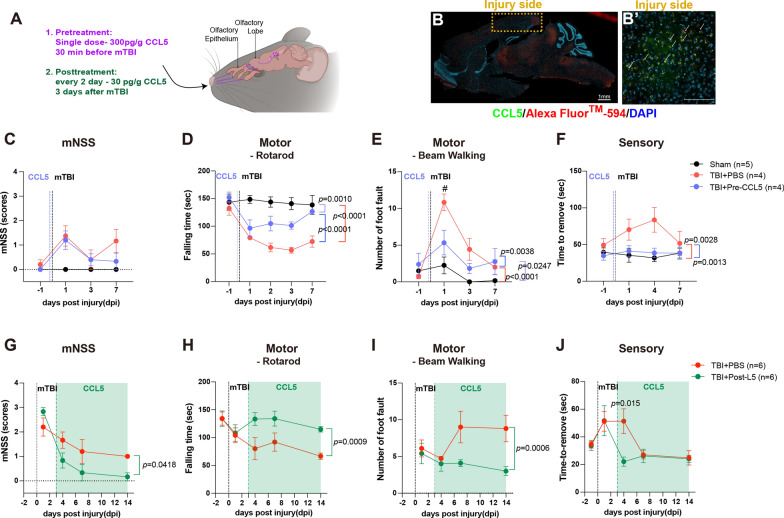
Method: A close-head weight-drop system was used to induce mild brain trauma in C57BL/6 (wild-type, WT) and CCL5 knockout (CCL5-KO) mice. The mNSS score, rotarod, beam walking, and sticker removal tests were used to assay neurological function after mTBI in different groups of mice. The restoration of motor and sensory functions was impaired in CCL5-KO mice after one month of injury, with swelling of axons and synapses from Golgi staining and reduced synaptic proteins-synaptophysin and PSD95. Administration of recombinant CCL5 (Pre-treatment: 300 pg/g once before injury; or post-treatment: 30 pg/g every 2 days, since 3 days after injury for 1 month) through intranasal delivery into mouse brain improved the motor and sensory neurological dysfunctions in CCL5-KO TBI mice.

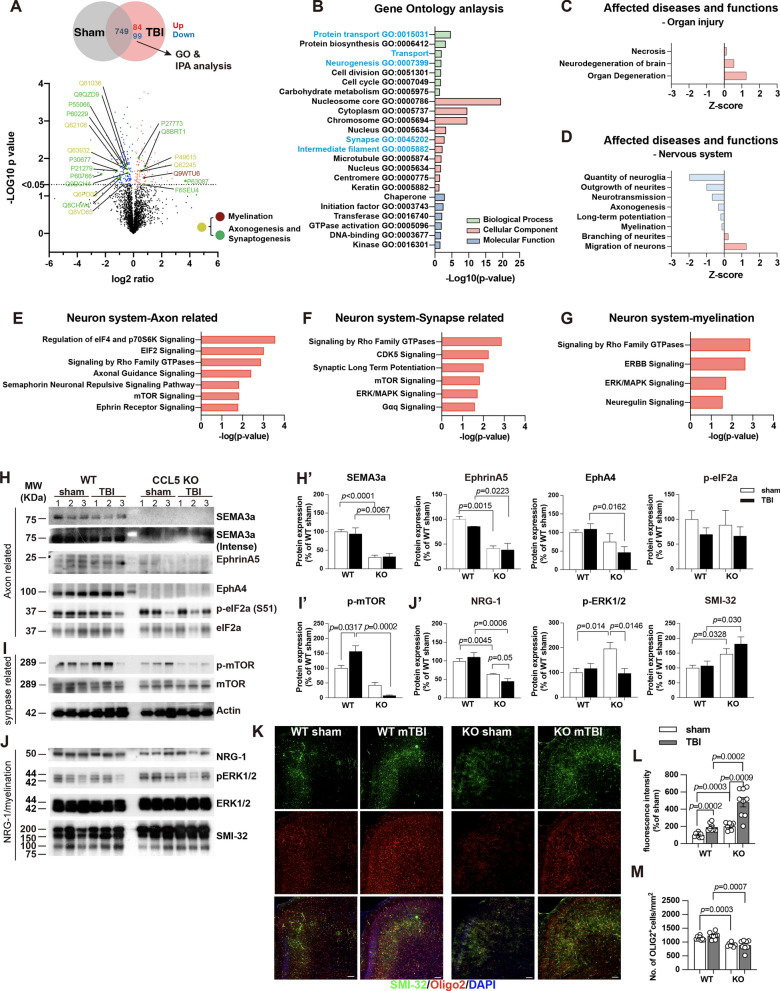
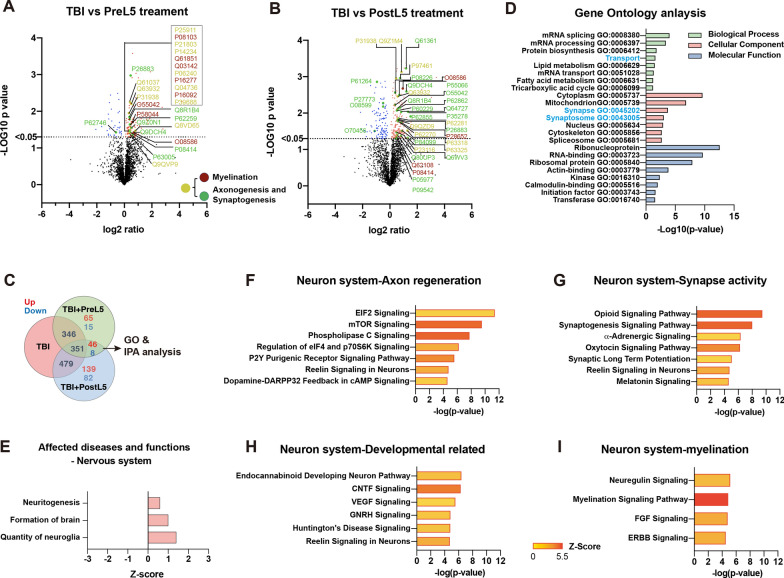
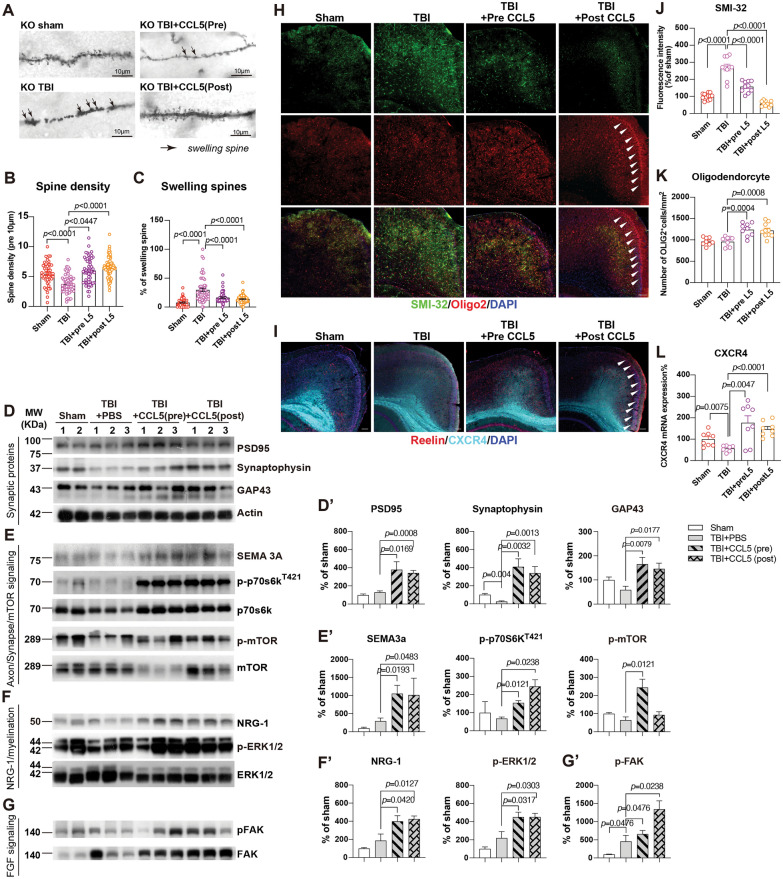
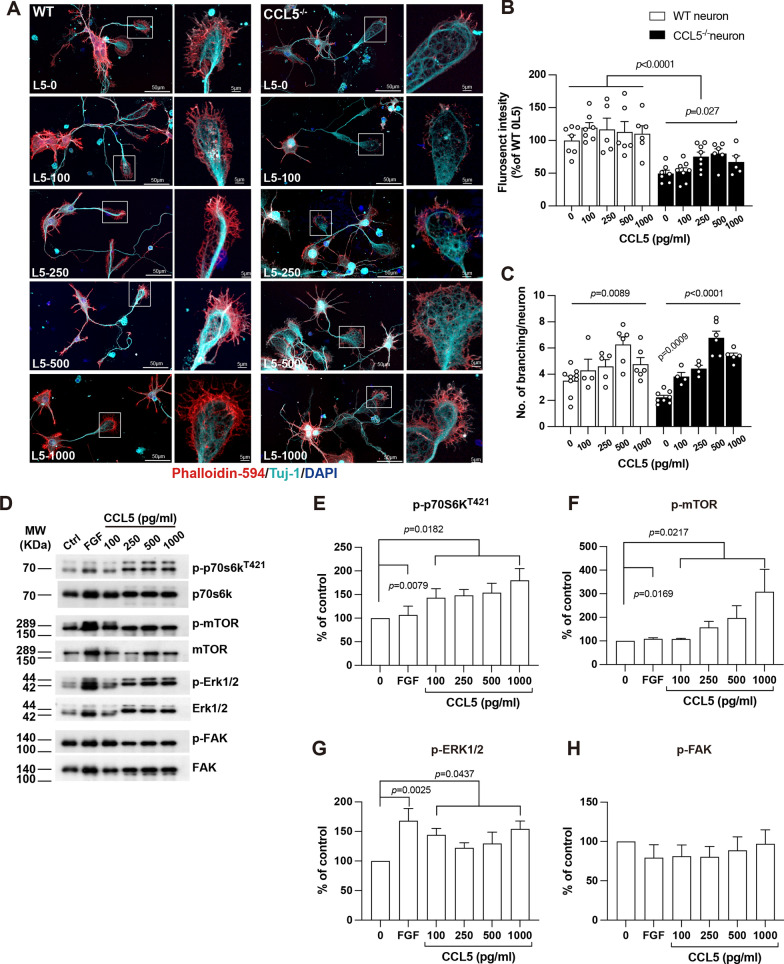
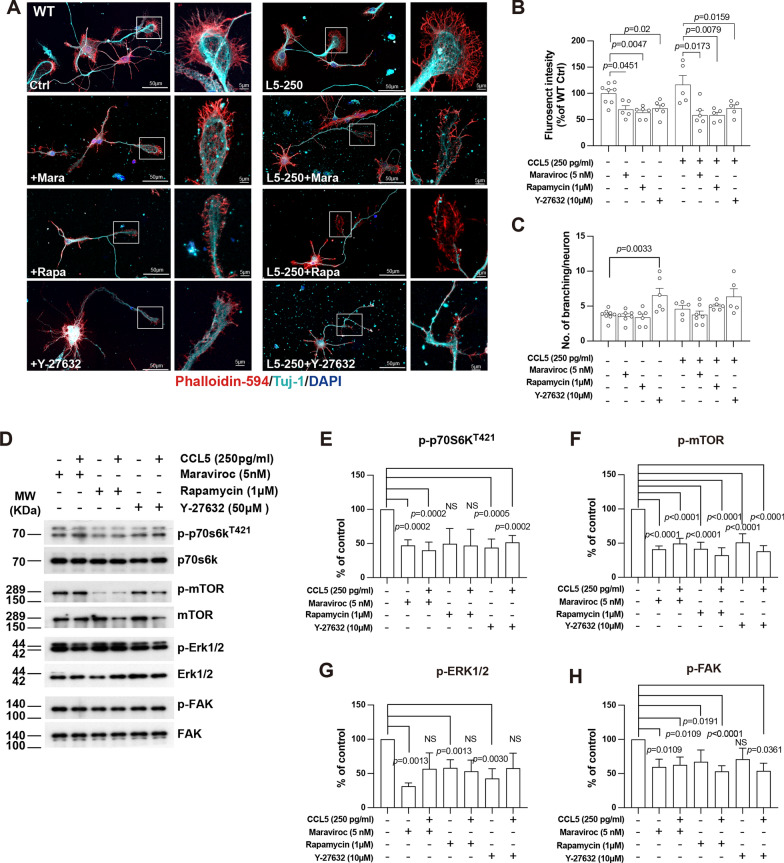
Results: Proteomic analysis using LC-MS/MS identified that the "Nervous system development and function"-related proteins, including axonogenesis, synaptogenesis, and myelination signaling pathways, were reduced in injured cortex of CCL5-KO mice; both pre-treatment and post-treatment with CCL5 augmented those pathways. Immunostaining and western blot analysis confirmed axonogenesis and synaptogenesis related Semaphorin, Ephrin, p70S6/mTOR signaling, and myelination-related Neuregulin/ErbB and FGF/FAK signaling pathways were up-regulated in the cortical tissue by CCL5 after brain injury. We also noticed cortex redevelopment after long-term administration of CCL5 after brain injury with increased Reelin positive Cajal-Rerzius Cells and CXCR4 expression. CCL5 enhanced the growth of cone filopodia in a primary neuron culture system; blocking CCL5's receptor CCR5 by Maraviroc reduced the intensity of filopodia in growth cone and also CCL5 mediated mTOR and Rho signalling activation. Inhibiting mTOR and Rho signaling abolished CCL5 induced growth cone formation.

Conclusions: CCL5 plays a critical role in starting the intrinsic neuronal regeneration system following TBI, which includes growth cone formation, axonogenesis and synaptogensis, remyelination, and the subsequent proper wiring of cortical circuits. Our study underscores the potential of CCL5 as a robust therapeutic stratagem in treating axonal injury and degeneration during the chronic phase after mild brain injury.

Keywords: Axon injury; Axonogenesis; CCL5; Myelination; Traumatic brain injury.


Conflict of interest statement

The authors declare that they have no conflict of interest.

Figures

Fig. 1
Fig. 1
Weight drop induced mild traumatic brain injury and caused cortical function impairment in mice. A An illustration of the weight-drop-induced motor and sensory cortex injury site. B The protein levels of CCL5 in the cortex after 1-, 4-, and 7 days of injury (dpi) were detected by ELISA assay (sham vs. 1 dpi, p = 0.0420; sham vs. 4 dpi, p = 0.0177; sham vs. 7dpi, p = 0.0281. Data were presented as mean ± SEM and analyzed by t-test following Mann-Whitney test). C The mNSS score of both WT and CCL5-KO mice showed mild brain injury. (WT sham vs. TBI, p = 0.0038; KO sham vs. TBI, p < 0.0001; WT-TBI vs. KO-TBI, p < 0.0001). The motor function of 4 groups of mice included falling time from the accelerating Rotarod (WT sham vs. TBI, p < 0.0001; KO sham vs. TBI, p < 0.0001; WT-TBI vs. KO-TBI, p = 0.0002) (D) and foot faults with beam walking (WT sham vs. TBI, p = 0.0011; KO sham vs. TBI, p = 0.0019; WT-TBI vs. KO-TBI, p < 0.0001) (E). Sensory function was analyzed by limb sticker removal (WT sham vs. TBI, p = 0.0003; KO sham vs. TBI, p = 0.0173; WT-TBI vs. KO-TBI, p = 0.0399) (F). Data was analyzed from both paws. (n = 7–9 animals in C–F) Data in C–F were analyzed by two-way ANOVA and presented as mean ± SEM. The time of induced brain injury (mild traumatic brain injury, mTBI)
Fig. 2
Fig. 2
The recovery of axonal injury was impaired in the CCL5-KO cortex after mild TBI. Golgi staining revealed the axon and spine structures in WT and CCL5-KO mouse cortex with sham treatment and mild TBI – 14 and − 28 days of injury (dpi). A, F The representative images of neurites and spine structures in WT and CCL5-KO mouse cortex; boxed regions were enlarged on the right. Black arrowheads point to the normal dendritic spines, and white arrows point to swollen neurites and spines. Scale bar = 1 mm and 20 μm. B, G The number of intersections (WT sham vs. 14 dpi, p < 0.0001; WT 14 dpi vs. 28 dpi, p < 0.0001; KO sham vs. 14 dpi, p < 0.0001; KO 14 dpi vs. 28 dpi, p < 0.0001. Data were analyzed by two-way ANOVA and presented as mean ± SEM), C, H total intersections (WT sham vs. 14 dpi, p = 0.0018; WT 14 dpi vs. 28 dpi, p = 0.0493; KO sham vs. 14 dpi, p < 0.0001; KO 14 dpi vs. 28 dpi, p = 0.0004.), D, I spine density (WT sham vs. 14 dpi, p < 0.0001; WT 14 dpi vs. 28 dpi, p < 0.0001; WT sham vs. 28 dpi, no significant difference, NS; KO sham vs. 14 dpi, p < 0.0001; KO 14dpi vs. 28 dpi, p = 0.0399; KO sham vs. 28 dpi, p < 0.0001.), and E, J swollen spines (WT sham vs. 14 dpi, p < 0.0001; WT 14 dpi vs. 28 dpi, p < 0.0001; WT sham vs. 28 dpi, p = 0.0231; KO sham vs. 14 dpi, p = 0.0004; KO 14dpi vs. 28dpi, p = 0.0229; KO sham vs. 28 dpi, p < 0.0001.) were quantified in different groups of mice (n = 10 in each group). Data in C–E and H–J were analyzed by unpaired t-test and presented as mean ± SEM. K, L The expression of synaptic proteins – PSD95 and synaptophysin in different groups of WT and CCL5-KO mouse cortex, including sham, 4, 7, 14, and 28 dpi, was analyzed by western blot. Quantification of results from 3 independent mouse samples in each group is listed above the images of protein blots in 2 K–L. (KO PSD95: sham vs. 4 dpi, p = 0.0015; sham vs. 7 dpi, p = 0.0038; sham vs. 14 dpi, p = 0.0147; sham vs. 28 dpi, p = 0.0025. KO Synaptophysin: sham vs. 4 dpi, p = 0.0126; sham vs. 7 dpi, p = 0.0019; sham vs. 14 dpi, p = 0.0089; sham vs. 28 dpi, p = 0.0186. Data were presented as mean ± SEM and analyzed by t-test following Mann-Whitney test)
Fig. 3
Fig. 3
LC-MS/MS analysis identified a reduction of axonogenesis and myelination signaling pathways in CCL5-KO mice with mild brain injury. A Venn diagram comparing DEPs (differentially expressed proteins) and volcano plot of significant DEPs between sham and mild TBI CCL5-KO mouse cortex. DEPs: p-value < 0.05 in comparison to sham control, respectively. Colored points represent log2 ratio > 0 upregulated protein (red) and log2 ratio < 0 downregulated protein (blue). Selected axonogenesis and myelination pathway-related proteins are highlighted as indicated (Red: myelinations, Green: axonogenesis and synaptogenesis, Yellow: overlapping). Results from Gene Ontology (GO) enrichment analysis of 183 identified proteins (84 up regulated, 99 down regulated) against a background list of all known mouse protein symbols. B Identified GO terms from the three GO groups are shown (Green bar: biological process, Red bar: cellular component, Blue bar: molecular function. Blue character: neuron function related). The strength of enrichment of each GO term was indicated by the Log10 p-value (X-axis). C, D IPA analysis identified affected diseases and function in organ injury (C) and nervous system (D) categories. Z-score values indicated that functions are predicted to be activated (red) or inhibited (blue). Selected IPA canonical pathways in the nervous system identified significant DEPs related to axon (E), synapse (F), and myelination signaling pathways (G). Protein blots analyzed the expression of identified proteins in sham and mTBI groups of WT and CCL5-KO mouse cortical tissue, including H, H' axon guidance-related Sema3a (WT sham vs. KO sham, p < 0.0001; WT TBI vs. KO TBI, p = 0.0067), EphrinA5 (WT sham vs. KO sham, p = 0.0015; WT TBI vs. KO TBI, p = 0.0223), EphA4 (WT TBI vs. KO TBI, p = 0.0162), and p-EIF2/EIF2; I, I' synapse-related p-mTOR/mTOR (WT sham vs. TBI, p = 0.0319; WT TBI vs. KO TBI, p = 0.0002), and J, J' myelination-related: NRG-1 (WT sham vs. KO sham, p = 0.0045; KO sham vs. KO TBI, p = 0.05; WT TBI vs. KO TBI, p = 0.0006), p-Erk/Erk (WT sham vs. KO sham, p = 0.014; KO sham vs. KO TBI, p = 0.0146), and SMI32 (WT sham vs. KO sham, p = 0.0328; WT TBI vs. KO TBI, p = 0.030). K, The immunostaining of unmyelinated neuritis with SMI32 antibody (green) and oligodendrocyte by Oligo2 antibody (red) in different groups of mouse cortex. DAPI, blue, for nucleus. Scale = 100 μm. The quantification of L SMI-32 and M Oligo-2 in sham and mTBI groups of WT and KO mice (SMI32: WT sham vs. KO sham, p = 0.0003; WT sham vs. TBI, p = 0.0002; KO sham vs. TBI, p < 0.0009; WT TBI vs. KO TBI, p = 0.0002) (Oligo2: WT sham vs. KO sham, p = 0.0003; WT TBI vs. KO TBI, p = 0.0007). Data were analyzed by unpaired t-test
Fig. 4
Fig. 4
Cortical neuron dysfunctions were improved by intranasally delivering CCL5 into CCL5-KO mice. A An illustration of intranasal delivery (i.n.) of recombinant CCL5 into mice. Recombinant CCL5 was administered into mice either (1) 30 min before injury with a single dosage of 300 pg/g or (2) 3 days after injury with 30 pg/g every 2 days until 28 dpi. B Recombinant CCL5 conjugated with Alexa Fluor™ 594 was detected by Alexa Fluor™ 594 (red) and CCL5 specific antibody (green) in mouse cortex. Images of CCL5 at the injury site in the cortex were enlarged on the right B' (Scale bar = 1 mm in B and 100 µm in B’). DAPI labeled the nucleus. C-J A Black dashed line points to the time of brain injury. The Purple dashed line indicates the treatment with CCL5 before the weight drop impact in C-F; the green dashed line and green area indicate the post-treatment with CCL5 from 3 dpi until 28 dpi in G-J. C, G The mNSS score of the CCL5-KO sham group and mice treated with PBS (control) and CCL5 (300 pg/g, single dose) before mTBI or PBS (control) and CCL5 (30 pg/g, every two days) (G: PBS vs Post-L5, p = 0.0418) after mTBI. Motor function of CCL5-KO mice with i.n. PBS or CCL5 was analyzed by Rotarod (D, H) (D: sham vs PBS, p < 0.0001; sham vs Pre-L5, p = 0.0010; PBS vs Pre-L5, p < 0.0001. H: PBS vs Post-L5, p=0.0009), and beam walking (E, I), which was improved in both i.n. CCL5 treated groups. (E: sham vs PBS, p < 0.0001; sham vs Pre-L5, p = 0.0247; PBS vs Pre-L5, p = 0.0038. I: PBS vs Post-L5, p = 0.0006). F, J Sensory function was analyzed by sicker removal test (F: sham vs PBS, p = 0.0028; sham vs Pre-L5, NS; PBS vs Pre-L5, p = 0.0013. J: PBS vs Post-L5 at 4 dpi, p = 0.015, by t-test). The time to remove stickers in CCL5-KO mice was reduced after being treated with CCL5. (n = 4 ~ 5 in C-F; n = 6 in G-J). Data in D-I was analyzed by two-way ANOVA between groups and presented as mean ± SEM
Fig. 5
Fig. 5
Both pretreatment and post-treatment with CCL5 enhanced neurite and synapse growth and myelination-related signaling pathways in injured cortical tissue. A Volcano plot of significant DEPs between mTBI and TBI + CCL5 pretreatment (PreL5) CCL5-KO mouse cortex. B Volcano plot of significant DEPs between mTBI and TBI + CCL5 post-treatment (PostL5) CCL5-KO mouse cortex. DEPs: p-value < 0.05 in comparison to TBI, respectively. Colored points represent: log2 ratio > 0 upregulated protein (red) and log2 ratio < 0 downregulated protein (blue). Selected axonogenesis, neuritogenesis, synaptogenesis, and myelination pathway-related proteins are highlighted as indicated (Red: myelinations, Green: axonogenesis, neuritogenesis, and synaptogenesis, Yellow: overlapping). C Venn diagram comparing DEPs between the TBI group, TBI + CCL5 pretreatment (PreL5), and TBI + CCL5 post-treatment (PostL5) groups. 54 identified proteins (46 up regulated, 8 down regulated) were affected by both treatments. D Identified GO terms from each of the three GO groups (Green bar: biological process, Red bar: cellular component, Blue bar: molecular function. Blue character: neuron function-related) were shown. The strength of enrichment of each GO term was indicated by the Log10 p-value (X-axis). E IPA analysis identified affected diseases and functions in the nervous system category (Z-score value indicated that functions are predicted to be activated (red). Selected IPA canonical pathways in the nervous system identified significant DEPs related to axon (F), synapse (G), neuron development (H), and myelination (I) related signaling pathways in both PreL5 and PostL5 treatments. The Z-score in different identified pathways was shown as a gradient of yellow to red. See also Supplementary Figs. 3, 4, and 5
Fig. 6
Fig. 6
CCL5 treatment enhanced synaptogenesis and myelination by activating the mTOR signaling pathway and the NGR-ERBB signaling pathway after mTBI. Golgi staining of cortical neurons in sham, TBI, TBI with CCL5 pretreatment (PreL5), and TBI with CCL5 post-treatment (PostL5) groups of mice. A The representative images of neurites and dendritic spines in different groups of mice. Black arrows point to swollen spines. Scale bar = 10 µm. The spine density (B) and the number of swollen spines (C) were quantified in different groups of mice (n = 10 in each group). (B: sham vs TBI, p < 0.0001; TBI vs Pre-L5, p = 0.0447; TBI vs Post-L5, p < 0.0001). (C: sham vs TBI, p < 0.0001; TBI vs Pre-L5, p < 0.0001; TBI vs Post-L5, p < 0.0001) D The expression of synaptic proteins – PSD95 and synaptophysin in KO mice cortex after mTBI with/without CCL5 administration. (D’: PSD95: TBI vs Pre-L5, p = 0.0169; TBI vs Post-L5, p = 0.0008; Synaptophysin: sham vs TBI, p = 0.004; TBI vs Pre-L5, p = 0.0032; TBI vs Post-L5, p = 0.0013; GAP43: TBI vs Pre-L5, p = 0.0079; TBI vs Post-L5, p = 0.0177). Western blot analyzed the expression of E axon-related signaling proteins - Sema3, EIF2, and mTOR phosphorylation. (E’: SEMA3a: TBI vs Pre-L5, p = 0.0193; TBI vs Post-L5, p = 0.0483; p-p70S6T421: TBI vs Pre-L5, p = 0.0121; TBI vs Post-L5, p = 0.0238; p-mTOR: TBI vs Pre-L5, p = 0.0121). F myelination-related proteins - Neuregulin, Erk, and SMI32 (F’: NRG-1: TBI vs Pre-L5, p = 0.0420; TBI vs Post-L5, p = 0.0127; p-ERK1/2: TBI vs Pre-L5, p = 0.0317; TBI vs Post-L5, p = 0.0303); and G FGF signaling - FAK phosphorylation (G’: p-FAK: sham vs TBI, p = 0.0476; TBI vs Pre-L5, p = 0.0476; TBI vs Post-L5, p = 0.0238) in injured cortex in different groups. (n = 4 ~ 5 in each group) H The immunostaining of unmyelinated axon - SMI-32 and oligo-2 in 4 groups of CCL5-KO mouse cortex; arrows point to the Oligo-2 positive cells under the pial surface around the injured cortex. The quantification results were in (J) SMI-32 and (K) oligodendrocytes. (J: sham vs TBI, p < 0.0001; TBI vs Pre-L5, p < 0.0001; TBI vs Post-L5, p < 0.0001). (K: TBI vs Pre-L5, p = 0.0004; TBI vs Post-L5, p = 0.0008). I The immunostaining of Reelin (red, arrows) and CXCR4 (Cyan) in mouse cortex in different groups of mice; the q-PCR quantitative result of CXCR4 in mouse cortex L (L: sham vs TBI, p = 0.0075; TBI vs Pre-L5, p = 0.0047; TBI vs Post-L5, p < 0.0001). Data were analyzed by unpaired t-test. See also Supplementary Fig. 6
Fig. 7
Fig. 7
CCL5 increased growth cone formation through activating the mTOR and FAK pathway. A Phalloidin (red) labeled the filopodia in axon growth cones of WT or CCL5-KO neurons after treating with CCL5 (0, 100, 250, 500, 1000 pg/ml). Tuj-1 labeled neurites, and DAPI labeled the nucleus. Phalloidin labeled growth cones in different groups were enlarged in the boxed regions: scale bar = 50 μm and 5 μm. The fluorence intensity of Phalloidin and neurite branching in different groups was quantified in B, C. (B: KO neuron treated with CCL5, p = 0.027; WT vs. KO neuron, p < 0.0001). (C: WT neuron treated with CCL5, p = 0.0089; KO neuron treated with CCL5, p < 0.0001; WT contol vs. KO contol, p = 0.0009 by t-test). D The activation of p70s6k/mTOR, NRG-1, FAK, and Erk signaling proteins in neurons after treatment with CCL5 (0, 100, 250, 500, 1000 pg/ml) in westen blot analysis. FGF was taken as positive control. Quantification data were in E-H. E The activation of p70s6k by CCL5 p = 0.0182; the activation of p70s6k by FGF p = 0.0079. F The activation of mTOR by CCL5 p = 0.0217; the activation of mTOR by FGF p = 0.0169. G The activation of ERK1/2 by CCL5 p = 0.0437; the activation of ERK1/2 by FGF p = 0.0025. Data was analyzed by one-way ANOVA in same group and two-way ANOVA between groups. Data between control and FGF treatment was analyzed by t-test
Fig. 8
Fig. 8
Inhibiting CCR5 receptor and mTOR signaling pathway reduced CCL5’s effect on growth cone formation. A Phalloidin (red) labeled the filopodia in axon growth cones of WT neurons treating with CCL5 (250 pg/ml), CCR5 inhibitor-Maraviroc (5 nM), mTOR inhibitor-Rapamycin (1 µM) and ROCK inhibitor-Y27632 (50 µM). Tuj-1 labeled neurites, and DAPI labeled the nucleus. Phalloidin and growth cones in different groups were enlarged in the boxed regions: scale bar = 50 μm and 5 μm. The fluorence intensity of Phalloidin and number of branching in different groups was quantified in B, C. (B: control vs. Maraviroc, p = 0.0451; control vs. Rapamycin (Rapa), p = 0.0047; control vs. Y-27632, p = 0.02. CCL5 vs. CCL5 + Maraviroc, p = 0.0173; CCL5 vs. CCL5 + Rapamycin, p = 0.0079; CCL5 vs. CCL5 + Y-27632, p = 0.0159.). (C: control vs. Y-27632, p = 0.0033, by t-test). D The activation of p70s6k/mTOR, NRG-1, FAK, and Erk signaling proteins in neurons after cotreatment with CCL5 (250 pg/ml) and CCR5 inhibitor-Maraviroc, Y27632 or Rapamycin (1 µM) in western blot analysis. FGF was taken as positive control. Quantification data were in E-H. E The quantification of p70s6k activation. (Control vs. Maraviroc, p = 0.0002; control vs. CCL5 + Maraviroc, p = 0.0002; control vs. Y-27632, p = 0.0005; control vs. CCL5 + Y-27632, p = 0.0002. ) F The quantification of mTOR activation. (Control vs. Maraviroc, p < 0.0001; control vs. CCL5 + Maraviroc, p < 0.0001; control vs. Rapa, p < 0.0001; control vs. CCL5 + Rapa, p < 0.0001; control vs. Y-27632, p < 0.0001; control vs. CCL5 + Y-27632, p < 0.0001.). G The quantification of ERK1/2 activation. (Control vs. Maraviroc, p = 0.0013; control vs. Rapa, p = 0.0013; control vs. Y-27632, p = 0.0030.) H The quantification of FAK activation. (Control vs. Maraviroc, p < 0.0109; control vs. CCL5 + Maraviroc, p = 0.0109; control vs. Rapa, p = 0.0191; control vs. CCL5 + Rapa, p < 0.0001; control vs. CCL5 + Y-27632, p = 0.0361.). Data was analyzed by unpaired t-test. NS: no significant difference

Similar articles

Cited by

References

    1. Ajoy R, Lo YC, Ho MH, Chen YY, Wang Y, Chen YH, Jing-Yuan C, Changou CA, Hsiung YC, Chen HM, Chang TH, Lee CY, Chiang YH, Chang WC, Hoffer B, Chou SY. CCL5 promotion of bioenergy metabolism is crucial for hippocampal synapse complex and memory formation. Mol Psychiatry. 2021;26(11):6451–68. - PMC - PubMed
    1. Albert V, Subramanian A, Agrawal D, Bhoi SK, Pallavi P, Mukhopadhayay AK. RANTES levels in peripheral blood, CSF and contused brain tissue as a marker for outcome in traumatic brain injury (TBI) patients. BMC Res Notes. 2017;10(1):139. - PMC - PubMed
    1. Babcock AA, Kuziel WA, Rivest S, Owens T. Chemokine expression by glial cells directs leukocytes to sites of axonal injury in the CNS. J Neurosci. 2003;23(21):7922–30. - PMC - PubMed
    1. Bianchi ME, Mezzapelle R. The chemokine receptor CXCR4 in cell proliferation and tissue regeneration. Front Immunol. 2020;11:2109. - PMC - PubMed
    1. Bodnar CN, Roberts KN, Higgins EK, Bachstetter AD. A systematic review of closed Head Injury models of mild traumatic brain Injury in mice and rats. J Neurotrauma. 2019;36(11):1683–706. - PMC - PubMed