. 2024 Sep 16;23(1):343.
doi: 10.1186/s12933-024-02417-6.

Cardiometabolic benefits of fenofibrate in heart failure related to obesity and diabetes

Affiliations

Cardiometabolic benefits of fenofibrate in heart failure related to obesity and diabetes

Jiwon Park et al. Cardiovasc Diabetol. .

Abstract

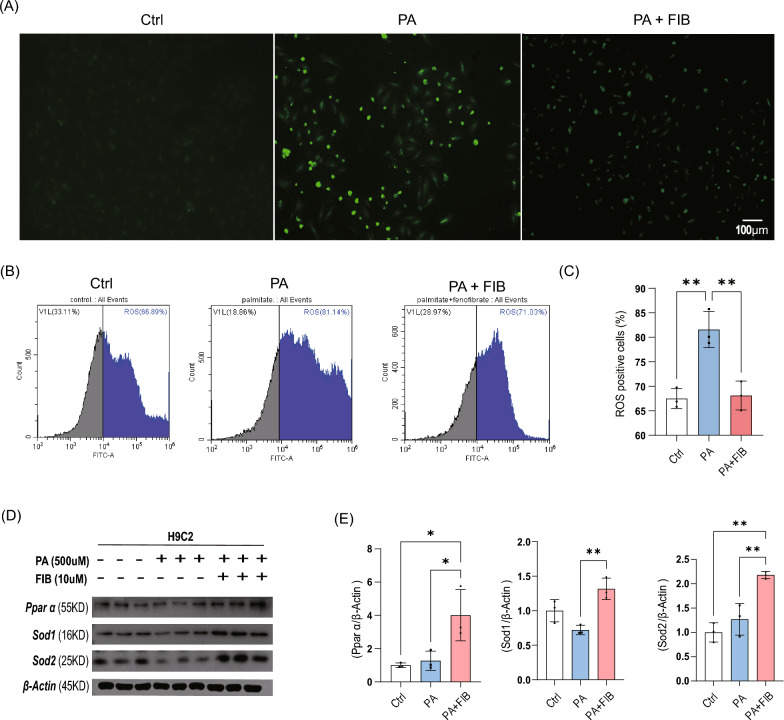
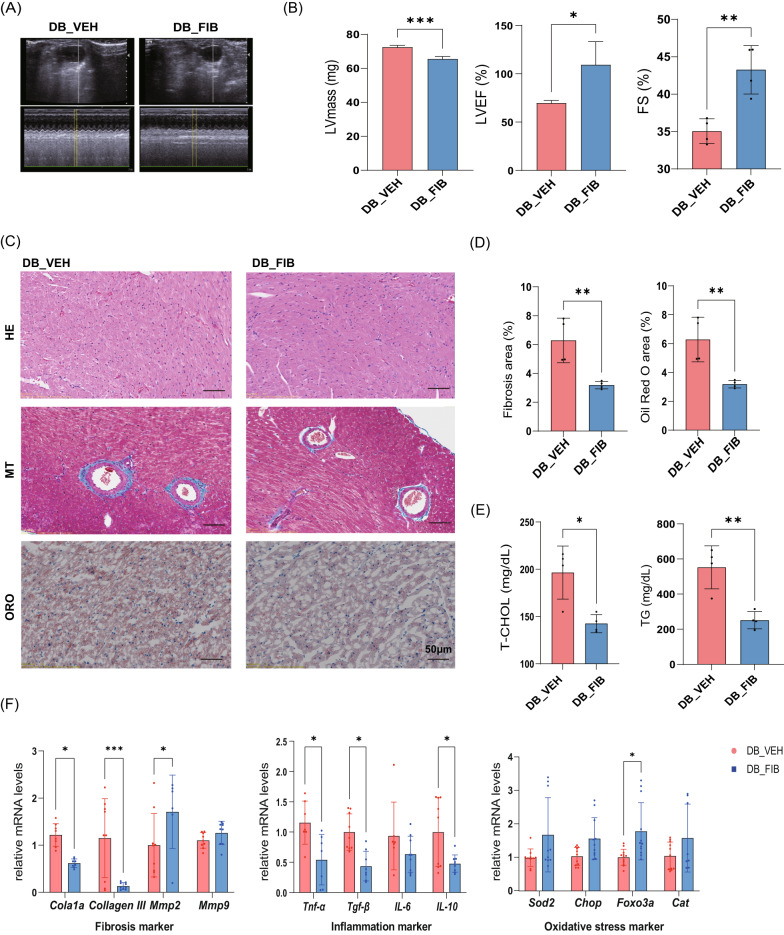
Background: Heart failure (HF) is a serious and common condition affecting millions of people worldwide, with obesity being a major cause of metabolic disorders such as diabetes and cardiovascular disease. This study aimed to investigate the effects of fenofibrate, a peroxisome proliferator-activated receptor alpha (PPARα) agonist, on the obese- and diabetes-related cardiomyopathy.

Methods and results: We used db/db mice and high fat diet-streptozotocin induced diabetic mice to investigate the underlying mechanisms of fenofibrate's beneficial effects on heart function. Fenofibrate reduced fibrosis, and lipid accumulation, and suppressed inflammatory and immunological responses in the heart via TNF signaling. In addition, we investigated the beneficial effects of fenofibrate on HF hospitalization. The Korean National Health Insurance database was used to identify 427,154 fenofibrate users and 427,154 non-users for comparison. During the 4.22-year follow-up, fenofibrate use significantly reduced the risk of HF hospitalization (hazard ratio, 0.907; 95% CI 0.824-0.998).

Conclusions: The findings suggest that fenofibrate may be a useful therapeutic agent for obesity- and diabetes-related cardiomyopathy.

Keywords: Diabetic cardiomyopathy; Fenofibrate; Heart failure.


Conflict of interest statement

The authors declare no competing interests.

Figures

Fig. 1
Fig. 1
A Effect of palmitate and fenofibrate on H9C2 cell viability Cell viability was measured using MTT Assay, and concentrations were 0.5 mM, 1 mM, and 10 mM, respectively. Measurements were carried out for 3 days (n = 3 per group). B Fenofibrate was treated with 10 μM, 50 μM, and 100 μM based on the Palmitate 0.5 mM set in (A) for 3 days (n = 3 per group). A, B Then normalized to controls. C, D Apoptosis was measured using flow cytometry. Each group had three samples, and all experiments were repeated three times. All controls were treated with 0.05% DMSO. *P < 0.05. E H9C2 cells were stained with Oil Red O dye. Control (without treatment). Stimulation with PA (500 μM). Fenofibratre was treated at 10 μM with PA (500 μM), scale bar: 100 μm. F Using Image J (n = 3 per group), the area stained with oil red o was measured. Data correspond to mean ± SEM per group to measure the percentage of lipid accumulation. ****P 0.0001, ***P < 0.001, **P < 0.01, *P < 0.05. Significant differences were determined by using a two-way ANOVA
Fig. 2
Fig. 2
A Staining H9C2 with H2-DCFDA, scale bar: 100 μm. B Multiple gating of cells arrested with H9C2 together with H2-DCFDA by flow cytometry (n = 3 per group). C ROS value statistical values expressed as percentage (value of area where ROS level shifted to the right) (n = 3 per group). D Western blot was performed to determine the expression of proteins. Pparα, Sod1, and Sod2 proteins were detected by co-addition of palmitate and fenofibrate to H9C2 (n = 3 per group). E Quantitative values were adjusted to β-actin. Values quantified as relative expression values of Ppar α, Sod1, and Sod2. Data are expressed as mean ± SEM. **P < 0.01, *P < 0.05 compared to control group. Two-way ANOVA was used to determine significant differences (n = 3 per group). Significant differences were determined by using a two-way ANOVA
Fig. 3
Fig. 3
A db/db vehicle and fenofibrate mice M-mode and 2D echocardiography Mice were anesthetized and cardiac function was assessed using echocardiography (n = 4 per group). B Numerical LV mass, LVEF, FS for cardiac function using echocardiography. C Each group underwent Hematoxylin and Eosin (H&E) staining, Masson’s trichrome and oil red o staining of sections cut relative to the artrium (n = 4 per group). D Percentage of fibrosis (collagen content) in healthy heart muscle as measured by Masson’s trichrome in muscle sections, scale bar: 100 μm. Data correspond to mean ± SEM per group (n = 4 per group). E Serum T-CHO, TG were measured (n = 4 per group). F The mRNA expression of heart failure indicators, inflammatory markers, and oxidative stress-related genes. Results were expressed as mean SD where β-actin was used as a loading control. Data were normalized using beta-actin expression (n = 4 per group) via t-test. ***P < 0.001, **P < 0.01, *P < 0.05 compared with control. Significant differences were determined by using a two-way ANOVA
Fig. 4
Fig. 4
A Volcano plot of whole transcriptome analysis from Deseq2 in db/db mice heart tissue. B GO/KEGG enrichment analysis of DEGs in the fenofibrate group and Vehicle group. red; down-regulated DEG, blue; down-regulated DEG. C Gene set enrichment analysis (GSEA) for oxidative phosphorylation, mitochondrial gene expression, cytokine production, tnf signaling. To adjust for cluster size, the NES (Normalized Enrichment Score) calculates the density of changed genes in the dataset using random expectations, normalized by the number of genes detected in a specific gene cluster. D Differentially expressed IPA networks in the fenofibrate(n = 4) and vehicle groups(n = 4) were investigated
Fig. 5
Fig. 5
Mouse A systolic and B diastolic function assessed by echocardiography. Mice were anesthetized and cardiac function was assessed using echocardiography (n = 5 for control, n = 3 for HFD + STZ, n = 4 for FIB). C Masson’s trichrome staining of mice heart, scale bar: 100 μm. D, E Representative western blotting (top to bottom): Sirt3, SOD2, and loading control α-tubulin (n = 3 per group). F UMAP plot for the integrated data of single cell RNA sequencing analysis (n = 2 per group). G Bar plot showing module score related to cardiac muscle contraction. H The Apold1 gene expression in endothelial cells in heart. I GSEA plot of TNF signaling pathway. J Dot plot of Lrp1 gene expression in cardiac cells in heart. Ctrl Control; HFD high fat diet; STZ streptozotocin; FIB fenofibrate; MQ macrophage; EC endothelial cell; CM cardiomyocyte; MC Mesothelial cell; SMC smooth muscle cells. Data are presented as mean ± SEM. ****P 0.0001, ***P < 0.001, **P < 0.01, *P < 0.05 compared with Control. Significant differences were determined by using a two-way ANOVA

References

    1. Malik A, Brito D, Vaqar S, Chhabra L. Congestive heart failure. 2017. - PubMed
    1. Jones NR, Hobbs FR, Taylor CJ. Prognosis following a diagnosis of heart failure and the role of primary care: a review of the literature. BJGP Open. 2017. 10.3399/bjgpopen17X101013. - PMC - PubMed
    1. Taylor CJ, Roalfe AK, Iles R, Hobbs FR. Ten-year prognosis of heart failure in the community: follow-up data from the Echocardiographic Heart of England Screening (ECHOES) study. Eur J Heart Fail. 2012;14(2):176–84. - PubMed
    1. Shah KS, Xu H, Matsouaka RA, Bhatt DL, Heidenreich PA, Hernandez AF, Devore AD, Yancy CW, Fonarow GC. Heart failure with preserved, borderline, and reduced ejection fraction: 5-year outcomes. J Am Coll Cardiol. 2017;70(20):2476–86. - PubMed
    1. Lavie CJ, Milani RV, Ventura HO. Obesity and cardiovascular disease: risk factor, paradox, and impact of weight loss. J Am Coll Cardiol. 2009;53(21):1925–32. - PubMed

Publication types

MeSH terms