. 2024 Sep 16;21(1):72.
doi: 10.1186/s12987-024-00571-3.

Rapid imaging of intravenous gadolinium-based contrast agent (GBCA) entering ventricular cerebrospinal fluid (CSF) through the choroid plexus in healthy human subjects

Affiliations

Rapid imaging of intravenous gadolinium-based contrast agent (GBCA) entering ventricular cerebrospinal fluid (CSF) through the choroid plexus in healthy human subjects

Yuanqi Sun et al. Fluids Barriers CNS. .

Abstract

Background: Pathways for intravenously administered gadolinium-based-contrast-agents (GBCAs) entering cerebrospinal-fluid (CSF) circulation in the human brain are not well-understood. The blood-CSF-barrier (BCSFB) in choroid-plexus (CP) has long been hypothesized to be a main entry-point for intravenous-GBCAs into CSF. Most existing studies on this topic were performed in animals and human patients with various diseases. Results in healthy human subjects are limited. Besides, most studies were performed using MRI methods with limited temporal resolution and significant partial-volume effects from blood and CSF.

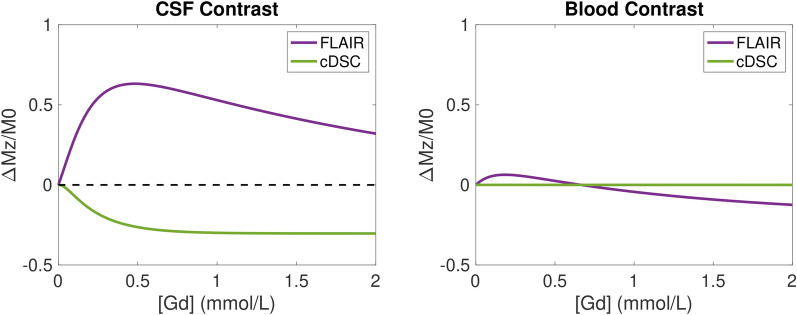
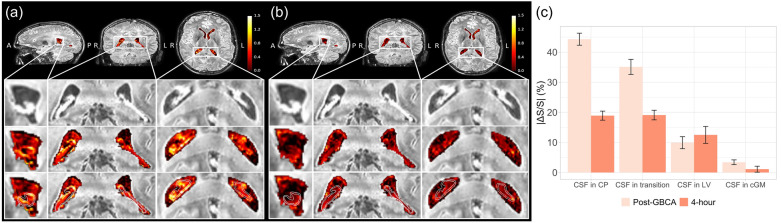
Methods: This study employs the recently developed dynamic-susceptibility-contrast-in-the-CSF (cDSC) MRI approach to measure GBCA-distribution in the CSF immediately and 4 h after intravenous-GBCA administration in healthy subjects. With a temporal resolution of 10 s, cDSC MRI can track GBCA-induced CSF signal changes during the bolus phase, which has not been investigated previously. It employs a long echo-time (TE = 1347 ms) to suppress tissue and blood signals so that pure CSF signal is detected with minimal partial-volume effects. GBCA concentration in the CSF can be estimated from cDSC MRI. In this study, cDSC and FLAIR MRI were performed immediately and 4 h after intravenous GBCA administration in 25 healthy volunteers (age 48.9 ± 19.5 years; 14 females). Paired t-tests were used to compare pre-GBCA and post-GBCA signal changes, and their correlations with age were evaluated using Pearson-correlation-coefficients.

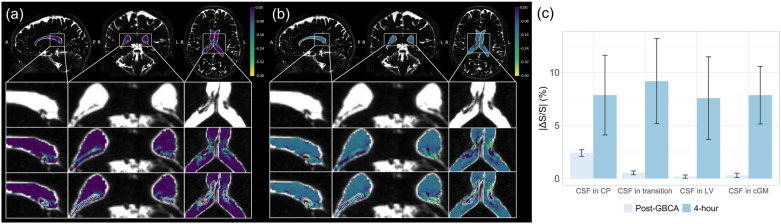
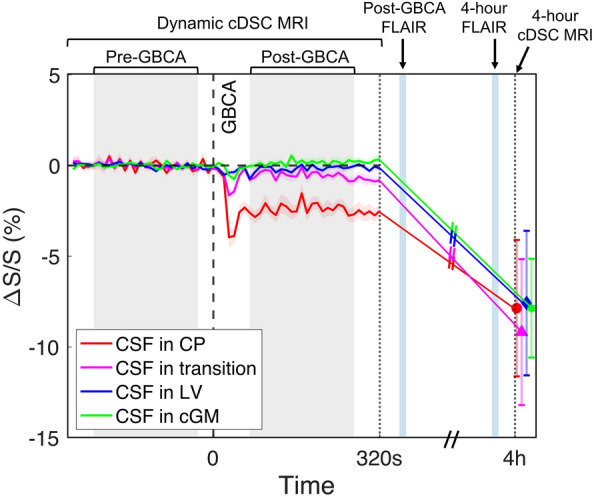
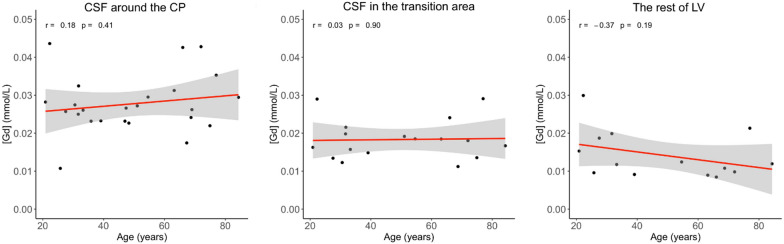
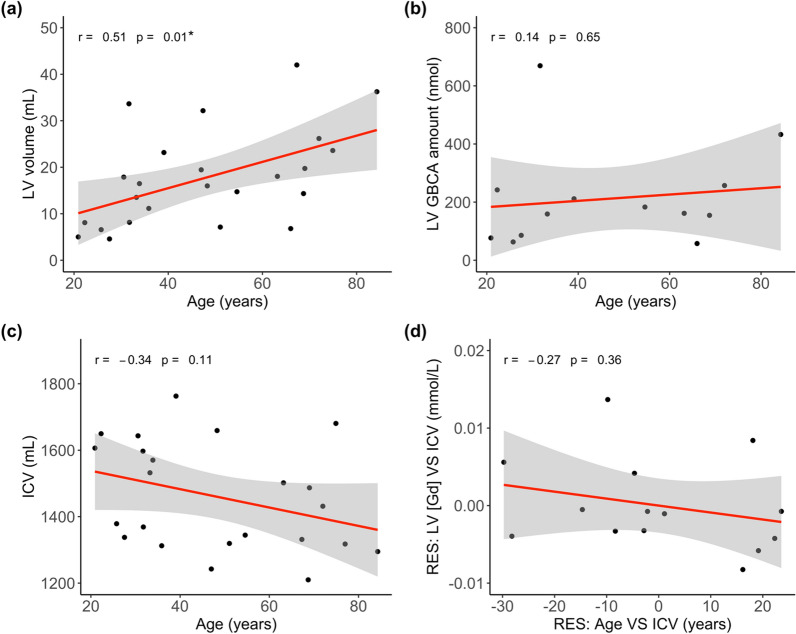
Results: At ~ 20 s post-GBCA, GBCA-induced cDSC signal changes were detected in the CSF around CP (ΔS/S = - 2.40 ± 0.30%; P < .001) but not in the rest of lateral ventricle (LV). At 4 h, significant GBCA-induced cDSC signal changes were observed in the entire LV (ΔS/S = - 7.58 ± 3.90%; P = .002). FLAIR MRI showed a similar trend. GBCA-induced CSF signal changes did not correlate with age.

Conclusions: These results provided direct imaging evidence that GBCAs can pass the BCSFB in the CP and enter ventricular CSF immediately after intravenous administration in healthy human brains. Besides, our results in healthy subjects established a basis for clinical studies in brain diseases exploiting GBCA-enhanced MRI to detect BCSFB dysfunction.

Keywords: BCSFB; Blood-CSF-barrier; Contrast; Lymphatic; MRI; Partial-volume.


Conflict of interest statement

The authors declare no competing financial interests.

Figures

Fig. 1
Fig. 1
Theoretical simulations of the trend of MRI signals in FLAIR and cDSC MRI. Fractional difference of post versus pre-GBCA magnetization normalized by the equilibrium magnetization (ΔMz/M0) was plotted as a function of GBCA concentration ([Gd], mmol/L) for the FLAIR and cDSC MRI pulse sequences. a MRI signal difference in the CSF (CSF Contrast). b MRI signal difference in the blood (Blood Contrast). Note that in cDSC MRI, a very long echo time (TE = 1347 ms) was used to suppress blood signal, and therefore the blood contrast in cDSC in the simulations was minimal. FLAIR: fluid-attenuated inversion recovery; cDSC: dynamic-susceptibility-contrast-in-the-CSF; GBCA: gadolinium-based-contrast-agent; CSF: cerebrospinal fluid
Fig. 2
Fig. 2
Representative manual segmentation of the choroid plexus (CP, red), and the transition area between the choroid plexus and CSF (green) identified on the post-GBCA FLAIR MRI images (69 years old, male). The regions in the white boxes on the first row are magnified on the second and third rows. The images on the second and third rows are identical with the CP and transition area outlined with red and green, respectively on the third-row images. A: anterior; P: posterior; R: right; L: left. FLAIR: fluid-attenuated inversion recovery; GBCA: gadolinium-based-contrast-agent; CSF: cerebrospinal fluid
Fig. 3
Fig. 3
Dynamic signal changes in the CSF around the choroid plexus (CP) measured by cDSC MRI. a Representative maps of relative signal changes (ΔS/S) averaged over 50–250 s after intravenous GBCA administration in the lateral ventricle (including the CP) from a healthy human subject (33 years old, female) are shown. Results were overlaid on the pre-GBCA cDSC MRI images. The regions in the white boxes on the first row are magnified on the second to fourth rows. The second row shows the original pre-GBCA cDSC MRI images. The third row displays cDSC MRI images overlaid with ΔS/S in the lateral ventricle. On the fourth row images, the CP and transition area between CP and CSF were outlined with white contours. A: anterior; P: posterior; R: right; L: left. The scale bar indicates the range of ΔS/S. Note that the cDSC MRI method has a negative contrast for GBCA-induced signal changes in the CSF. b Representative maps of ΔS/S approximately 4 h after intravenous GBCA administration in the lateral ventricle (including the CP) from the same healthy human subject are shown. Results were overlaid on the pre-GBCA cDSC MRI images. c Average absolute ΔS/S in the CSF immediately and 4 h after intravenous GBCA administration measured by cDSC MRI from all healthy human subjects (n = 25). The CSF signal changes in four ROIs were calculated: the choroid plexus (CP), transition area between CP and CSF (transition), the rest of lateral ventricle (LV), and the perivascular space of occipital cortical grey matter (cGM). The error bars represent inter-subject standard errors. Quantitative results are reported in Tables 2 and 3. Note that absolute ΔS/S is displayed here for easier comparison with subsequent results. cDSC: dynamic-susceptibility-contrast-in-the-CSF; GBCA: gadolinium-based-contrast-agent; CSF: cerebrospinal fluid
Fig. 4
Fig. 4
Average time courses of the dynamic signal changes in the CSF (ΔS/S) before and after intravenous GBCA administration measured by the cDSC MRI approach from all healthy human subjects (n = 25) are displayed. The CSF signal changes in four ROIs were calculated: the choroid plexus (CP), transition area between CP and CSF (transition), the rest of lateral ventricle (LV), and the perivascular space of occipital cortical grey matter (cGM). The shaded areas around the time courses represent inter-subject standard errors. The vertical dashed lines indicate the time when GBCA was injected. The shaded areas indicate the pre- and post-GBCA periods over which ΔS/S was averaged and reported in Table 2. The first vertical dotted line indicates the end of the dynamic cDSC MRI scans. The second vertical dotted line indicates the time when the follow-up dynamic cDSC scan (4 h after GBCA injection) was performed. The light blue vertical lines indicate when the FLAIR MRI scans were performed. FLAIR: fluid-attenuated inversion recovery; cDSC: dynamic-susceptibility-contrast-in-the-CSF; GBCA: gadolinium-based-contrast-agent; CSF: cerebrospinal fluid
Fig. 5
Fig. 5
GBCA induced signal changes in the choroid plexus (CP) measured by FLAIR MRI. a Representative maps of relative signal changes (ΔS/S) in the lateral ventricle (including the CP) approximately 6 min after intravenous GBCA administration from a healthy human subject (31 years old, female) are shown. The signal changes were overlaid on the post-GBCA FLAIR MRI images. The scale bar indicates the range of ΔS/S. Note that the FLAIR MRI method has a positive contrast for GBCA-induced signal changes in the CSF. The regions in the white boxes on the first row are magnified on the second to fourth rows. The images on the second to fourth rows are identical anatomically with the CP and transition area between CP and CSF outlined with white contours on the fourth row images. A: anterior; P: posterior; R: right; L: left. b Representative maps of relative signal changes (ΔS/S) in the lateral ventricle (including the CP) approximately 4 h after intravenous GBCA administration from the same healthy human subject are shown. The signal changes were overlaid on the post-GBCA FLAIR MRI images. c Average absolute ΔS/S immediately and 4 h after intravenous GBCA administration measured by FLAIR MRI from all healthy human subjects (n = 25). The signal changes in four ROIs were calculated: the choroid plexus (CP), transition area between CP and CSF (transition), the rest of lateral ventricle (LV), and the perivascular space of occipital cortical grey matter (cGM). The error bars represent inter-subject standard errors. Quantitative results are reported in Table 4. FLAIR: fluid-attenuated inversion recovery; GBCA: gadolinium-based-contrast-agent; CSF: cerebrospinal fluid
Fig. 6
Fig. 6
Correlation with age from GBCA concentration in the CSF around the choroid plexus (CP), transition area and the rest of lateral ventricle (LV) during the 50–250 s post-GBCA period in all subjects (n = 25) while controlling for GBCA dosage in each subject (based on body weight). r: Pearson correlation coefficient. GBCA: gadolinium-based-contrast-agent; CSF: cerebrospinal fluid
Fig. 7
Fig. 7
Correlation analysis with the volume of lateral ventricle (LV) and intracranial volume (ICV) in all subjects (n = 25). a Correlation between age and the volume of LV. b Correlation between age and GBCA amount in the LV (= GBCA concentration × volume of LV). GBCA concentration in the LV during the 50–250 s post-GBCA period was used. c Correlation between age and ICV. d Partial correlation between age and GBCA concentration ([Gd]) in the LV with ICV as a covariate. The x-axis and y-axis are residuals from the correlation between age and ICV, and from the correlation between LV [Gd] and ICV, respectively. GBCA concentration in the LV during the 50–250 s post-GBCA period was used. r: Pearson correlation coefficient. GBCA: gadolinium-based-contrast-agent; CSF: cerebrospinal fluid

Similar articles

Cited by

References

    1. Ringstad G, Vatnehol SAS, Eide PK. Glymphatic MRI in idiopathic normal pressure hydrocephalus. Brain. 2017;140(10):2691–705. 10.1093/brain/awx191 - DOI - PMC - PubMed
    1. Eide PK, Vatnehol SAS, Emblem KE, Ringstad G. Magnetic resonance imaging provides evidence of glymphatic drainage from human brain to cervical lymph nodes. Sci Rep. 2018;8(1):7194. 10.1038/s41598-018-25666-4 - DOI - PMC - PubMed
    1. Eide PK, Ringstad G. Delayed clearance of cerebrospinal fluid tracer from entorhinal cortex in idiopathic normal pressure hydrocephalus: a glymphatic magnetic resonance imaging study. J Cereb Blood Flow Metab. 2019;39(7):1355–68. 10.1177/0271678X18760974 - DOI - PMC - PubMed
    1. Zhou Y, Cai J, Zhang W, Gong X, Yan S, Zhang K, Luo Z, Sun J, Jiang Q, Lou M. Impairment of the glymphatic pathway and putative meningeal lymphatic vessels in the aging human. Ann Neurol. 2020;87(3):357–69. 10.1002/ana.25670 - DOI - PubMed
    1. Eide PK, Pripp AH, Ringstad G. Magnetic resonance imaging biomarkers of cerebrospinal fluid tracer dynamics in idiopathic normal pressure hydrocephalus. Brain Commun. 2020;2(2):187.10.1093/braincomms/fcaa187 - DOI - PMC - PubMed

LinkOut - more resources