. 2024 Sep 16;15(1):308.
doi: 10.1186/s13287-024-03923-w.

Metabolic modulation to improve MSC expansion and therapeutic potential for articular cartilage repair

Affiliations

Metabolic modulation to improve MSC expansion and therapeutic potential for articular cartilage repair

Ching Ann Tee et al. Stem Cell Res Ther. .

Erratum in

Abstract

Background: Articular cartilage degeneration can result from injury, age, or arthritis, causing significant joint pain and disability without surgical intervention. Currently, the only FDA cell-based therapy for articular cartilage injury is Autologous Chondrocyte Implantation (ACI); however, this procedure is costly, time-intensive, and requires multiple treatments. Mesenchymal stromal cells (MSCs) are an attractive alternative autologous therapy due to their availability and ability to robustly differentiate into chondrocytes for transplantation with good safety profiles. However, treatment outcomes are variable due to donor-to-donor variability as well as intrapopulation heterogeneity and unstandardized MSC manufacturing protocols. Process improvements that reduce cell heterogeneity while increasing donor cell numbers with improved chondrogenic potential during expansion culture are needed to realize the full potential of MSC therapy.

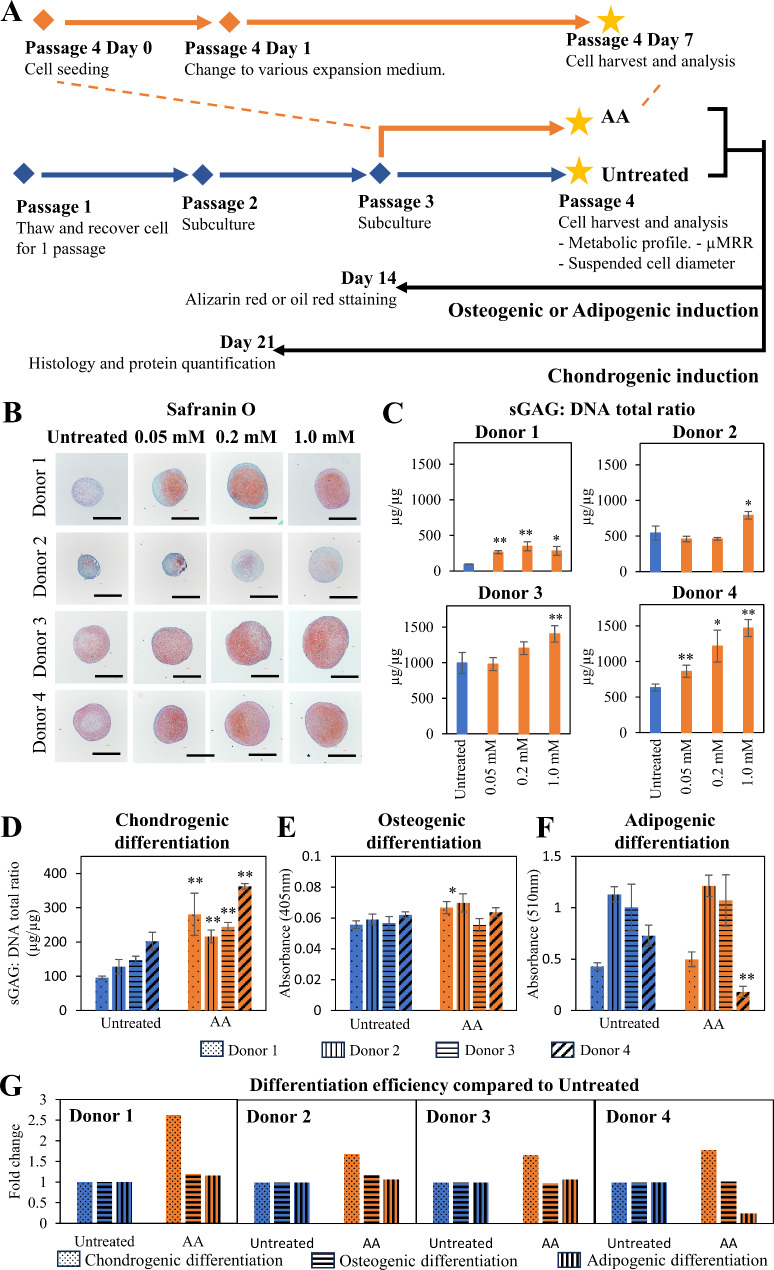
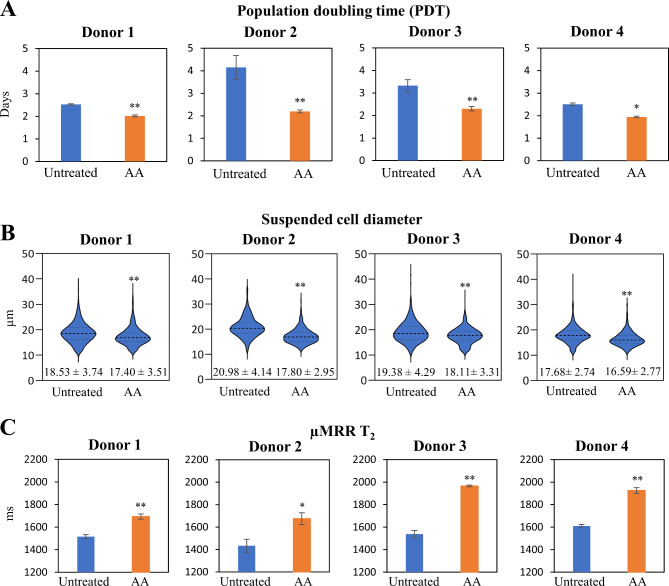
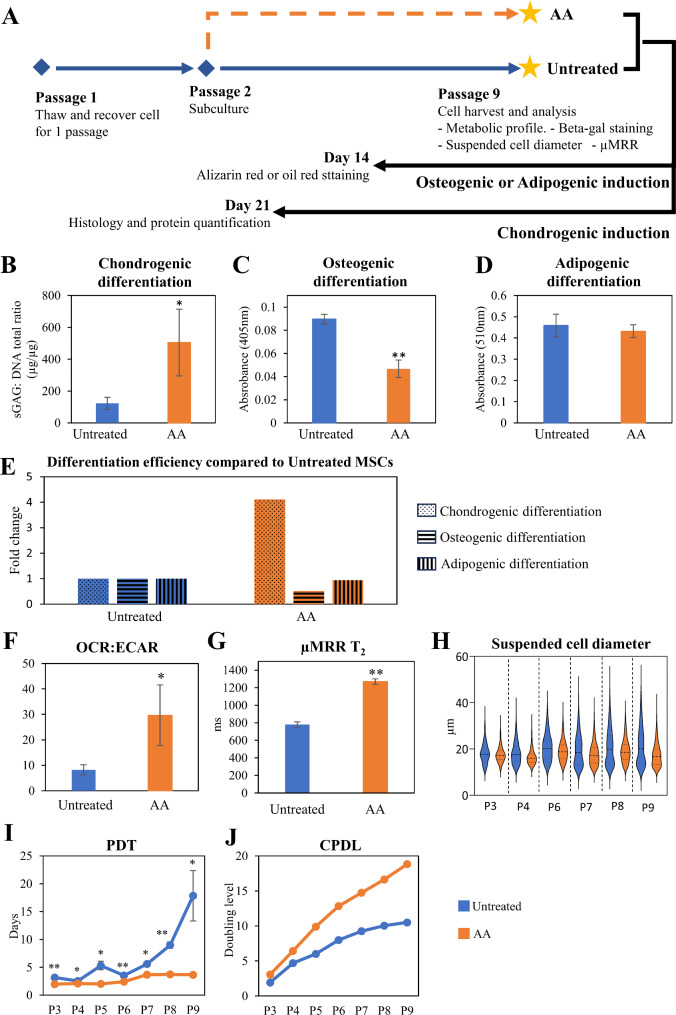
Methods: In this study, we investigated the potential of MSC metabolic modulation during expansion to enhance their chondrogenic commitment by varying the nutrient composition, including glucose, pyruvate, glutamine, and ascorbic acid in culture media. We tested the effect of metabolic modulation in short-term (one passage) and long-term (up to seven passages). We measured metabolic state, cell size, population doubling time, and senescence and employed novel tools including micro-magnetic resonance relaxometry (µMRR) relaxation time (T2) to characterize the effects of AA on improved MSC expansion and chondrogenic potential.

Results: Our data show that the addition of 1 mM L-ascorbic acid-2-phosphate (AA) to cultures for one passage during MSC expansion prior to initiation of differentiation improves chondrogenic differentiation. We further demonstrate that AA treatment reduced the proportion of senescent cells and cell heterogeneity also allowing for long-term expansion that led to a > 300-fold increase in yield of MSCs with enhanced chondrogenic potential compared to untreated cells. AA-treated MSCs with improved chondrogenic potential showed a robust shift in metabolic profile to OXPHOS and higher µMRR T2 values, identifying critical quality attributes that could be implemented in MSC manufacturing for articular cartilage repair.

Conclusions: Our results suggest an improved MSC manufacturing process that can enhance chondrogenic potential by targeting MSC metabolism and integrating process analytic tools during expansion.

Keywords: Articular cartilage; Cell expansion; Critical quality attributes; In-process monitoring tools; Mesenchymal stromal cells; Metabolic modulation.


Conflict of interest statement

The authors declare that they have competing interest.

Figures

Fig. 1
Fig. 1
Effect of AA treatment in MSC priming during expansion on subsequent chondrogenic differentiation. (A) Schematic diagram of the experiment setup. MSCs frozen at P1 were recovered and sub-cultured until passage 3. Passage 3 MSCs were seeded and allowed to adhere overnight before the media was changed to expansion media containing 0 (Untreated), 0.05, 0.2 or 1.0 mM AA. MSCs were harvested at Passage 3 on Day 7 for subsequent analysis. (B) Histology of chondrogenic pellets after 3 weeks of chondrogenic differentiation following 1 passage of 0 (Untreated), 0.05, 0.2 and 1.0 mM of AA treatment. Formation of glycosaminoglycan (sGAG) indicated by Safranin O staining. 40x magnification; scale bar: 500 μm. Images are representative of 5 replicates per donor. (C) Quantification of sGAG in digested pellets normalized to total DNA per pellet. (D, E, F) Trilineage differentiation capacity of MSCs following 1 passage of 0 (Untreated) or 1.0mM AA (AA) treatment. (D) Chondrogenic differentiation is indicated by the ratio of total sGAG to total DNA in chondrogenic pellet; (E) osteogenic differentiation is represented by the amount of Alizarin red stain for calcium deposits, and (F) adipogenic differentiation is represented by the amount of oil red stain for oil droplets. (G) Comparison between chondrogenic, osteogenic and adipogenic differentiation efficiency in relative to Untreated following 1 passage of 0 (Untreated) or 1.0 mM AA (AA) treatment. Experiments were performed in 3–4 technical replicates. Data are presented as mean ± standard deviation. * P < 0.05 and ** P < 0.01 compared to Untreated
Fig. 2
Fig. 2
Effect of AA treatment in MSC priming during expansion on MSC metabolic profile. (A) MSC glycolytic function represented by real-time extracellular acidification rate (ECAR) plot of Untreated and AA-treated MSCs from Donor 1 in response to glucose, oligomycin and 2-deoxyglucose (2-DG) in Seahorse XF Glycolysis Stress test. (B) Energy map of Untreated and AA-treated MSCs presenting both ECAR and oxygen consumption rate (OCR) at the basal level. (C) OCR: ECAR ratio of Untreated and AA-treated MSCs at the basal level. (D) Glucose consumption and (E) lactate production rates were measured from the changes in the glucose and lactate concentrations in fresh and spent media, normalized to the total number of cells and hours of incubation. Experiments were performed in 3 technical replicates. Data are presented as mean ± standard deviation. * P < 0.05 and ** P < 0.01 compared to Untreated
Fig. 3
Fig. 3
Effect of AA treatment on MSC proliferation and potential critical quality attributes. (A) Population doubling time (PDT) of Untreated and AA-treated MSCs at Passage 4. 7 days of 1 mM AA treatment led to a reduction and highly similar PDT across 4 donors (Donor 1: 2.04 ± 0.035 days; Donor 2: 1.94 ± 0.034 days; Donor 3: 2.30 ± 0.096 days; Donor 4: 2.20 ± 0.061 days), compared to Untreated MSCs (Donor 1: 2.53 ± 0.026 days; Donor 2: 4.15 ± 0.530 days; Donor 3: 3.33 ± 0.260 days; Donor 4: 2.51 ± 0.054 days) that showed heterogeneity in PDT as measured by final cell yield at P4 with cell counting using Trypan blue. From initial cell seeding density of 0.2 × 104 cells/cm2, AA treatment resulted in higher cell yield (Donor 1: 1.69 ± 0.05 × 104 cells/cm2; Donor 2: 1.82 ± 0.08 × 104 cells/cm2; Donor 3: 1.64 ± 0.14 × 104 cells/cm2; Donor 4: 2.41 ± 0.10 × 104 cells/cm2) as compared to Untreated MSCs (Donor 1: 1.01 ± 0.01 × 104 cells/cm2; Donor 2: 0.66 ± 0.10 × 104 cells/cm2; Donor 3: 0.86 ± 0.10 × 104 cells/cm2; Donor 4: 1.39 ± 0.06 × 104 cells/cm2). (B) Suspended cell diameter of Untreated and AA-treated MSCs. Measurements were calculated from 400–500 cells. Data are presented in violin plots with the first dotted line as the 75th percentile; the second dotted line as the mean and the last dotted line as the 25th percentile; the value below each violin plots as mean ± standard deviation. (C) Micro-magnetic Resonance Relaxometry (µMRR) T2 relaxation time of Untreated and AA-treated MSCs. µMRR measurements were performed in 3 technical replicates. Data are presented as mean ± standard deviation. * P < 0.05 and ** P < 0.01 compared to Untreated
Fig. 4
Fig. 4
Effect of long-term AA supplementation in MSC manufacturing. (A) Schematic diagram of the experiment setup. MSCs frozen at P1 were thawed and recovered for 1 passage in standard expansion media. From passage 2 to 9, AA was supplemented with standard expansion media in the experimental group (AA), whereas the Untreated control was cultured in standard expansion media without AA. MSCs were harvested at passage 9 for subsequent analysis. (B) Chondrogenic differentiation is indicated by the ratio of total sGAG to total DNA in chondrogenic pellets; (C) osteogenic differentiation is represented by the amount of Alizarin red stain for calcium deposits; and (D) adipogenic differentiation is represented by the amount of oil red stain for oil droplets. (E) Comparison between chondrogenic, osteogenic and adipogenic differentiation efficiency of AA-treated MSCs in relative to Untreated. (F) Metabolic profile of Untreated and AA treated MSCs, presented as OCR: ECAR at passage 9 (P9) (G) µMRR T2 relaxation time of Untreated and AA treated MSCs at P9. (H) Suspended cell diameter of Untreated and AA-treated MSCs from P3 to P9. Measurements were calculated from 400–500 cells. Data are presented in violin plots with the first dotted line as the 75th percentile, the second dotted line as the mean and the last dotted line as the 25th percentile. (I) Population doubling time (PDT) and (J) cumulative population doubling level (CPDL) of Untreated and AA-treated MSCs from P3 to P9. With an initial cell seeding density of 2.0 × 103 cells/cm2, expansion to 7 passages yielded 9.24 ± 0.27 × 103 cells/cm2 and 2.76 ± 0.49 × 103 cells/cm2 from AA treated and Untreated groups at P9, respectively. Experiments were performed in 3 technical replicates. Data are presented as mean ± standard deviation. * P < 0.05 and ** P < 0.01 compared to Untreated

References

    1. Nejadnik H, Hui JH, Feng Choong EP, Tai B-C, Lee EH. Autologous bone marrow–derived mesenchymal stem cells versus autologous chondrocyte implantation: an observational cohort study. Am J Sports Med. 2010;38(6):1110–6. - PubMed
    1. Teo AQA, Wong KL, Shen L, Lim JY, Toh WS, Lee EH, et al. Equivalent 10-year outcomes after implantation of autologous bone marrow–derived mesenchymal stem cells versus autologous chondrocyte implantation for chondral defects of the knee. Am J Sports Med. 2019;47(12):2881–7. - PubMed
    1. Wakitani S, Nawata M, Tensho K, Okabe T, Machida H, Ohgushi H. Repair of articular cartilage defects in the patello-femoral joint with autologous bone marrow mesenchymal cell transplantation: three case reports involving nine defects in five knees. J Tissue Eng Regen Med. 2007;1(1):74–9. - PubMed
    1. Goh D, Yang Y, Lee EH, Hui JHP, Yang Z. Managing the heterogeneity of mesenchymal stem cells for cartilage regenerative therapy: a review. Bioengineering. 2023;10(3):355. - PMC - PubMed
    1. Maheshwer B, Polce EM, Paul K, Williams BT, Wolfson TS, Yanke A, et al. Regenerative potential of mesenchymal stem cells for the treatment of knee osteoarthritis and chondral defects: a systematic review and meta-analysis. Arthrosc J Arthrosc Relat Surg. 2021;37(1):362–78. - PubMed

LinkOut - more resources