. 2024 Nov;44(11):1287-1310.
doi: 10.1002/cac2.12605. Epub 2024 Sep 16.

Local TSH/TSHR signaling promotes CD8+ T cell exhaustion and immune evasion in colorectal carcinoma

Affiliations

Local TSH/TSHR signaling promotes CD8+ T cell exhaustion and immune evasion in colorectal carcinoma

Sisi Zeng et al. Cancer Commun (Lond). 2024 Nov.

Abstract

Background: Dysfunction of CD8+ T cells in the tumor microenvironment (TME) contributes to tumor immune escape and immunotherapy tolerance. The effects of hormones such as leptin, steroid hormones, and glucocorticoids on T cell function have been reported previously. However, the mechanism underlying thyroid-stimulating hormone (TSH)/thyroid-stimulating hormone receptor (TSHR) signaling in CD8+ T cell exhaustion and tumor immune evasion remain poorly understood. This study was aimed at investigating the effects of TSH/TSHR signaling on the function of CD8+ T cells and immune evasion in colorectal cancer (CRC).

Methods: TSHR expression levels in CD8+ T cells were assessed with immunofluorescence and flow cytometry. Functional investigations involved manipulation of TSHR expression in cellular and mouse models to study its role in CD8+ T cells. Mechanistic insights were mainly gained through RNA-sequencing, Western blotting, chromatin immunoprecipitation and luciferase activity assay. Immunofluorescence, flow cytometry and Western blotting were used to investigate the source of TSH and TSHR in CRC tissues.

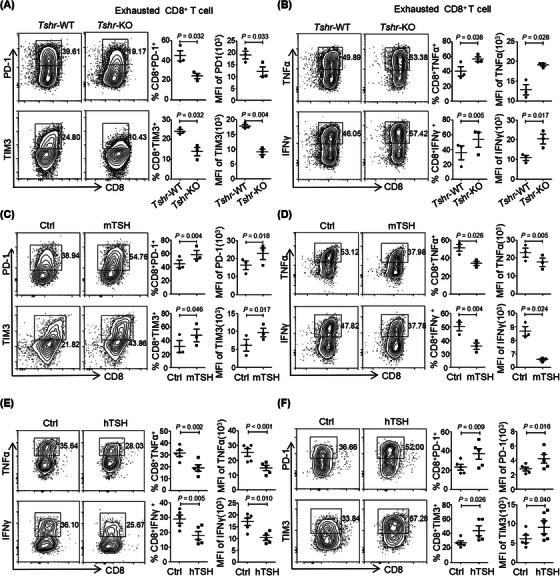
Results: TSHR was highly expressed in cancer cells and CD8+ T cells in CRC tissues. TSH/TSHR signaling was identified as the intrinsic pathway promoting CD8+ T cell exhaustion. Conditional deletion of TSHR in CD8+ tumor-infiltrating lymphocytes (TILs) improved effector differentiation and suppressed the expression of immune checkpoint receptors such as programmed cell death 1 (PD-1) and hepatitis A virus cellular receptor 2 (HAVCR2 or TIM3) through the protein kinase A (PKA)/cAMP-response element binding protein (CREB) signaling pathway. CRC cells secreted TSHR via exosomes to increase the TSHR level in CD8+ T cells, resulting in immunosuppression in the TME. Myeloid-derived suppressor cells (MDSCs) was the main source of TSH within the TME. Low expression of TSHR in CRC was a predictor of immunotherapy response.

Conclusions: The present findings highlighted the role of endogenous TSH/TSHR signaling in CD8+ T cell exhaustion and immune evasion in CRC. TSHR may be suitable as a predictive and therapeutic biomarker in CRC immunotherapy.

Keywords: CD8+ T cell exhaustion; Colorectal carcinoma; Immune evasion; Thyroid stimulating hormone; Thyroid stimulating hormone receptor.


Conflict of interest statement

All authors declare no competing interest.

Figures

FIGURE 1
FIGURE 1
TSHR expression was increased in CD8+ TILs from CRC. (A) Human normal colorectal (n = 68) or tumor sections (n = 68) were stained with anti‐TSHR antibody by immunohistochemistry. (B) Statistics of immunohistochemical scores between normal colorectal and tumor sections. (C) Correlation of TSHR mRNA with checkpoint receptors in colon adenocarcinoma patients using TIMER 2.0. (D) Immunofluorescence analysis of the expression of TSHR in CD4+ and CD8+ T cells of human CRC tumor. (E) The MFI of TSHR in CD4+ and CD8+ T cells (n = 30), human CRC tissue samples (n = 60) and paired normal adjacent tissue samples (n = 60), and CD8+ T cells. (F) Representative immunofluorescence image of TSHR+CD8+ T cells in human CRC tissue samples (n = 54), paired normal adjacent tissue samples (n = 54) and lymph nodes (n = 12). (G‐I) TSHR expression in TILs harvested from mice bearing MC38 colon carcinoma. Representative histograms of TSHR expression and summary MFI data in the indicated CD8+ TIL populations (n = 5). Data are pooled from at least two independent experiments. Abbreviations: TSHR, thyroid stimulating hormone receptor; TIMER, Tumor Immune Estimation Resource; IHC, immunohistochemistry; HAVCR2, hepatitis A virus cellular receptor 2; PDCD1, Programmed cell death protein 1; CTLA4, cytotoxic T lymphocyte‐associated antigen‐4; LAG3, Lymphocyte Activation Gene‐3; TIGIT, T‐cell immunoglobulin and ITIM domain; TILs, tumor‐infiltrating lymphocytes; CRC, colorectal cancer; MFI, mean fluorescence intensity; LN, lymph node; Iso, isotype control; SPL, spleen; PD‐1, programmed cell death 1; TIM3, T cell immunoglobulin domain and mucin domain‐3; ns, not significant.
FIGURE 2
FIGURE 2
TSH/TSHR signaling promoted functional exhaustion of CD8+ T cells. (A‐B) Murine (Tshr‐WT and Tshr‐KO) naïve CD8+ T cells were repeatedly activated with anti‐CD3 and anti‐CD28 antibodies. (A) Representative flow cytometry data and summary plots of the frequency and MFI of the indicated checkpoint receptors (n = 3). (B) Representative flow cytometry data and summary plots of the frequency and MFI of the indicated cytokines following polyclonal activation (n = 3). (C‐F) Murine and human naïve CD8+ T cells were repeatedly activated (anti‐CD3/28) in the presence or absence of mTSH and hTSH. (C, F) Representative flow cytometry data and summary plots of the frequency and MFI of the indicated checkpoint receptors (n = 3 or 4). (D‐E) Representative flow cytometry data and summary plots of the frequency and MFI of the indicated cytokines following polyclonal activation (n = 3 or 4). Data are pooled from at least two independent experiments. Abbreviations: TSH, thyroid stimulating hormone; TSHR, thyroid stimulating hormone receptor; MFI, mean fluorescence intensity; mTSH, murine thyroid stimulating hormone; hTSH, human thyroid stimulating hormone; Ctrl, control; Tshr‐WT, Tshr‐wildtype; Tshr‐KO, Tshr‐knockout; PD‐1, programmed cell death 1; TIM3, T cell immunoglobulin domain and mucin domain‐3; TNFα, tumor necrosis factor α; IFNγ, Interferon γ; ns, not significant.
FIGURE 3
FIGURE 3
TSH/TSHR signaling promoted CD8+ T cell exhaustion through the PKA/CREB signaling pathway. (A) Volcano plots showed the gene expression difference between Tshr‐WT and Tshr‐KO CD8+ T cells. (B) Heatmap showed the gene expression difference between Tshr‐WT and Tshr‐KO CD8+ T cells. (C) RT‐PCR analysis of immunosuppressive receptor expression in Tshr‐WT and Tshr‐KO CD8+ T cells. (D) mRNA expression of the immunosuppressive receptors in CD8+ T cells, treated with vehicle or mTSH. (E) Mouse CD8+ T cells were treated with mTSH for the indicated time intervals. The treated cells were lysed, and immunoblotting was used to detect phosphorylated CREB, AKT, ERK as well as their corresponding total protein levels. (F) Mouse Tshr‐WT and Tshr‐KO CD8+ T cells were treated with mTSH for the indicated time intervals. The treated cells were lysed, and immunoblotting was used to detect phosphorylated CREB as well as the corresponding total protein levels. (G) Mouse CD8+ T cells were pretreated with vehicle control or the PKA inhibitor H89 or the PKC inhibitor GO6983 for 1 h, followed by treatment with mTSH as indicated for 24 h. The cell lysates were subjected to Western blotting to detect the amounts of PD‐1 and CTLA4. (H‐I) The chromatin immunoprecipitate obtained in the ChIP assay was quantified by real‐time PCR. (J‐K) Luciferase activity in 293T cells transfected with PD‐1 or TIM3 luciferase reporters. Cells were treated with hTSH after 4 h. Firefly luciferase activity was measured 48 h after transfection and is presented relative to constitutive Renilla luciferase activity. Data are pooled from at least two independent experiments. Abbreviations: TSH, thyroid stimulating hormone; Tshr‐WT, Tshr‐wildtype; Tshr‐KO, Tshr‐knockout; RT‐PCR, reverse transcription‐polymerase chain reaction; TSHR, thyroid stimulating hormone receptor; hTSH, human thyroid stimulating hormone; mTSH, murine thyroid stimulating hormone; CREB, CAMP‐response element binding protein; p‐CERB, phospho CAMP ‐response element binding protein; p‐AKT, phospho‐protein kinase B; AKT, protein kinase B; p‐ERK, phospho‐extracellular regulated protein kinases; ERK, extracellular regulated protein kinases; GAPDH, glyceraldehyde‐3‐phosphate dehydrogenase; PD‐1, programmed cell death 1; CTLA4, cytotoxic T lymphocyte‐associated antigen‐4; TIM3, T cell immunoglobulin domain and mucin domain‐3; PKA, protein kinase A; PKC, protein kinase C; ChIP‐qPCR, chromatin immunoprecipitation‐quantitative polymerase chain reaction; ns, not significant.
FIGURE 4
FIGURE 4
TSHR deficiency in CD8+ T cells increased the antitumor activity. (A‐D) Colorectal cancer orthotopic tumor models were established in Tshr‐WT and Tshr‐KO mice. (A) Representative images of orthotopic tumors in the two groups. (B) Live small animal fluorescence images of the tumor model in the two groups. (C) Comparison of the MFI of orthotopic tumors between groups. (D) HE staining analyses of tumor tissues in each group. (E‐J) CMT93 or MC38 cells were implanted into Tshr‐WT and Tshr‐KO mice. (E, H) Representative tumor images for the two groups. (F, I) Growth curves of tumors for both groups. (G, J) Comparison of tumor weight between groups. (K‐M) TILs were harvested from Tshr‐WT and Tshr‐KO mice bearing MC38 cells at intermediate stages of tumor progression (n = 5). (K) Representative flow cytometry data and summary plot of the frequency of CD8+ T cells (n = 5). (L) Representative flow cytometry data and summary plot of the frequency and MFI of the indicated cytokines following polyclonal activation of CD8+ TILs (n = 5). (M) Representative flow cytometry data and summary plot of the frequency of checkpoint receptor‐expressing CD8+ TILs (n = 5). (N‐O) Immunofluorescence analysis of the expression of checkpoint receptors in CRC subcutaneous tumors in mice (n = 5). Data are pooled from at least two independent experiments. Abbreviations: TSHR, thyroid stimulating hormone receptor; Tshr‐WT, Tshr‐wildtype; Tshr‐KO, Tshr‐knockout; TNFα, tumor necrosis factor α; IFNγ, Interferon γ; PD‐1, programmed cell death 1; TIM3, T cell immunoglobulin domain and mucin domain‐3; HE, hematoxylin‐eosin staining; TILs, cytotoxic T lymphocytes; MFI, mean fluorescence intensity; ns, not significant.
FIGURE 5
FIGURE 5
TSHR in CRC cells inhibited antitumor immunity via CD8+ T cells. (A‐F) MC38 cells were implanted into nude BALB/c and C57BL/6 mice. (A, D) Representative tumor images for two groups. (B, E) Comparison of tumor weight between groups. (C, F) Growth curves of tumors in both groups. (G‐I) Tumor growth curves of MC38‐shCtrl or MC38‐shTSHR cells with isotype or anti‐CD8α antibody therapy. (G) Representative tumor images in the four groups. (H) Growth curves of tumors for each group. (I) Comparison of tumor weight between groups. (J‐K) TILs were harvested from mice bearing MC38 cells at intermediate stages of tumor progression. Representative flow cytometry data and summary plot of the frequency of checkpoint receptor and the indicated cytokines in CD8+ TILs (n = 4). (L) Spearman's rank correlation plot for TSHR in CD8+ T cells with CRC cells using immunofluorescence intensity (n = 30). (M) TILs were harvested from mice bearing MC38‐shCtrl or MC38‐shTSHR cells. Representative flow cytometry data and summary plots of MFI of TSHR expressing in CD8+ TILs are shown. (N) Immunoblot detection of TSHR in purified exosomes from the shCtrl and shTSHR MC38 cells. (O) Immunoblot detection of GFP in purified exosomes from GFP‐Ctrl and GFP‐TSHR LoVo cells. (P) FACS analysis and quantification of the percentage of GFP positive exosomes from LoVo cell lines. (Q) Co‐localization of GFP fluorescence and PKH67 lipid dye in CD8+ T cells after adding PKH67‐labeled exosomes derived from GFP‐Ctrl and GFP‐TSHR LoVo cells. (R) Flow cytometry detection of GFP fluorescence intensity in CD8+ T cells after addition of exosomes from GFP‐Ctrl and GFP‐TSHR LoVo cells. Data are pooled from at least two independent experiments. Abbreviations: TSHR, thyroid stimulating hormone receptor; shCtrl, short hairpin RNA of Control; shTSHR, short hairpin RNA of TSHR; CRC, colorectal cancer; TNFα, tumor necrosis factor α; IFNγ, Interferon γ; PD‐1, programmed cell death 1; TIM3, T cell immunoglobulin domain and mucin domain‐3; TILs, cytotoxic T lymphocytes; MFI, mean fluorescence intensity; GFP‐Ctrl, green fluorescent protein‐Control; GFP‐TSHR, green fluorescent protein‐thyroid stimulating hormone receptor; FACS, Fluorescence activated Cell Sorting; CY3‐EV, Cyanine 3‐exosome; PKH67, paul karl horan 67; ns, not significant.
FIGURE 6
FIGURE 6
TSHR desensitized tumors to PD‐1 blockade therapy. (A) Immunoblot detection of the expression of TSHR, PD‐1 and CTLA4 in CD8+ T cells after adding exosomes from MC38/TSHR‐oe cells. (B) Immunoblot detection of the expression of TSHR in Tshr‐KO CD8+ T cells treated with MC38 cell‐derived exosomes. (C) Tshr‐KO CD8+ T cells were re‐stimulated with anti‐CD3 and anti‐CD28 in the presence or absence of TSH for 24 h after the addition of MC38 cell‐derived exosomes. Flow cytometry analysis of the indicated proteins from Tshr‐KO CD8+ T cells. (D) Illustration of treatment of MC38 tumor‐bearing C57BL/6 mice with DMSO or GW4869. (E) Representative tumor images in the four groups. (F) Growth curves of tumors for each group. (G) Comparison of tumor weight between groups. (H‐I) Immunohistochemical staining of human colorectal tumor sections with anti‐TSHR antibody (n = 50 or 28). (J) Illustration of treatment of MC38 tumor‐bearing C57BL/6 mice with IgG or anti‐PD‐1 antibody. (K) Tumor growth curves for each group. (L) Representative tumor pictures for the four groups. (M) Comparison of tumor weight between groups. Data are pooled from at least two independent experiments. Abbreviations: TSHR, thyroid stimulating hormone receptor; TSHR‐oe, TSHR‐overexpress; Tshr‐KO, Tshr‐knockout; PD1, programmed cell death 1; CTLA4, cytotoxic T lymphocyte‐associated antigen‐4; TSH, thyroid stimulating hormone; shCtrl, short hairpin RNA of Control; shTSHR, short hairpin RNA of TSHR; MSS, microsatellite stability; Iso, isotype control; anti‐PD‐1, anti‐programmed cell death 1; IHC, immunohistochemistry; ns, not significant.
FIGURE 7
FIGURE 7
TSH released by MDSCs promoted the immunosuppressive phenotype of CD8+ TILs. (A) Human normal colorectal (n = 50) or tumor sections (n = 50) were stained with anti‐TSH antibody by immunohistochemistry. (B) the abundance of TSH was assessed by t‐test. (C) Immunofluorescence analysis of the expression of TSH in CD11b+CD33+ MDSCs from human CRC tumors (n = 50) and paired normal adjacent tissue samples (n = 50). (D) A two‐tailed paired t‐test was used to analyze the MFI of TSH staining in the indicated MDSCs. (E) SDS‐PAGE analysis of whole‐cell proteins (WCL) and cultured medium (CM) proteins of MDSCs and CRC cells. (F‐G) Tshr‐WT and Tshr‐KO CD8+ T cells were re‐stimulated with anti‐CD3 and anti‐CD28 for 24 h before being co‐cultured with MDSCs. Flow cytometry analysis of the indicated proteins from Tshr‐WT or Tshr‐KO CD8+ T cells co‐cultured with MDSCs via Transwells for 24 h. (H) Illustration of treatment of MC38 tumor‐bearing C57BL/6 mice with IgG or anti‐Gr1 antibody. (I) Tumor growth curves of each group. (J) Representative tumor pictures in the four groups. (K) Comparison of tumor weight between groups. Data are pooled from at least two independent experiments. Abbreviations: TSH, thyroid stimulating hormone; IHC, immunohistochemistry; MDSCs, myeloid‐derived suppressor cells; TILs, cytotoxic T lymphocytes; CRC, colorectal cancer; MFI, mean fluorescence intensity; Tshr‐KO, Tshr‐knockout; TIM3, T cell immunoglobulin domain and mucin domain‐3; PD‐1, programmed cell death 1; Iso, isotype control; IL6, interleukin 6; GM‐CSF, granulocyte‐macrophage colony‐stimulating factor; SDS‐PAGE, SDS polyacrylamide gels; WCL, whole cell protein; CM, conditioned medium; shCtrl, short hairpin RNA of control; shTSHR, short hairpin RNA of TSHR; ns, not significant.

References

    1. Ganesh K, Stadler ZK, Cercek A, Mendelsohn RB, Shia J, Segal NH, et al. Immunotherapy in colorectal cancer: rationale, challenges and potential. Nat Rev Gastroenterol Hepatol. 2019;16(6):361‐75. - PMC - PubMed
    1. Wherry EJ, Kurachi M. Molecular and cellular insights into T cell exhaustion. Nat Rev Immunol. 2015;15(8):486‐99. - PMC - PubMed
    1. Dolina JS, Van Braeckel‐Budimir N, Thomas GD, Salek‐Ardakani S. CD8(+) T Cell Exhaustion in Cancer. Front Immunol. 2021;12:715234. - PMC - PubMed
    1. Budimir N, Thomas GD, Dolina JS, Salek‐Ardakani S. Reversing T‐cell Exhaustion in Cancer: Lessons Learned from PD‐1/PD‐L1 Immune Checkpoint Blockade. Cancer Immunol Res. 2022;10(2):146‐53. - PubMed
    1. Shi M, Ye L, Zhao L, He L, Chen J, Zhang J, et al. Tumor derived exosomal ENTPD2 impair CD8(+) T cell function in colon cancer through ATP‐adenosine metabolism reprogramming. Cell Commun Signal. 2024;22(1):274. - PMC - PubMed