. 2024 Sep;14(9):e70024.
doi: 10.1002/ctm2.70024.

ANKRD1 aggravates renal ischaemia‒reperfusion injury via promoting TRIM25-mediated ubiquitination of ACSL3

Affiliations

ANKRD1 aggravates renal ischaemia‒reperfusion injury via promoting TRIM25-mediated ubiquitination of ACSL3

Shangting Han et al. Clin Transl Med. 2024 Sep.

Abstract

Background: Renal ischaemia‒reperfusion injury (IRI) is the primary cause of acute kidney injury (AKI). To date, effective therapies for delaying renal IRI and postponing patient survival remain absent. Ankyrin repeat domain 1 (ANKRD1) has been implicated in some pathophysiologic processes, but its role in renal IRI has not been explored.

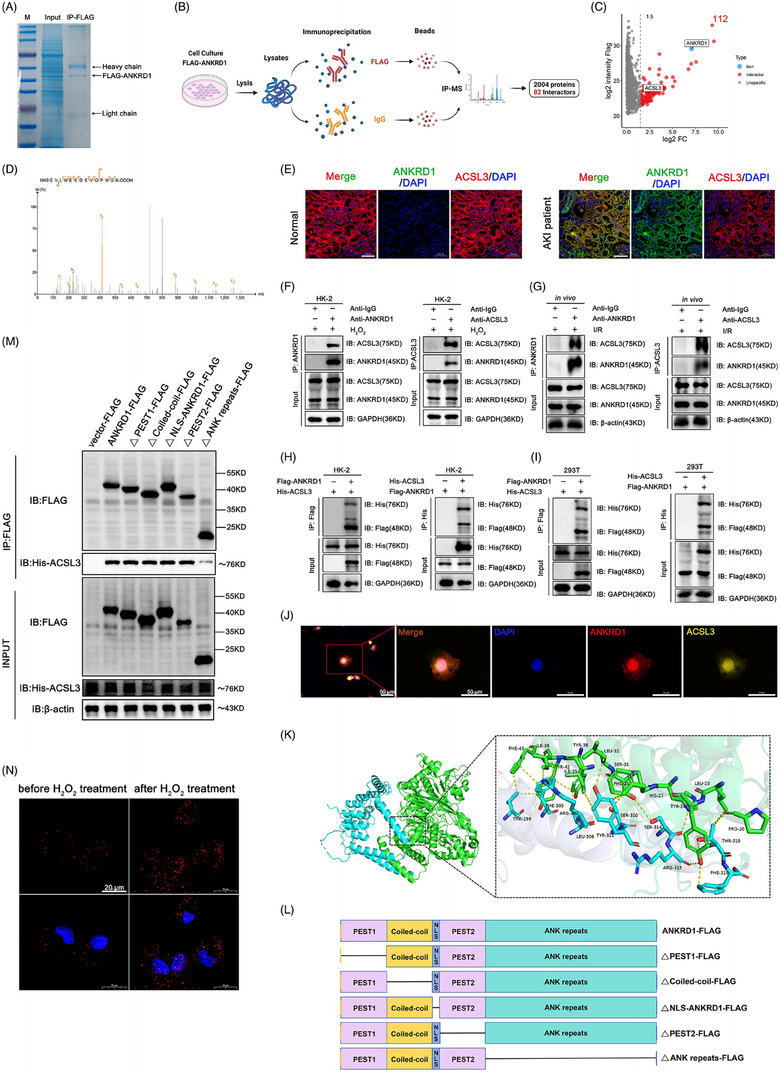
Methods: The mouse model of IRI-AKI and in vitro model were utilised to investigate the role of ANKRD1. Immunoprecipitation-mass spectrometry was performed to identify potential ANKRD1-interacting proteins. Protein‒protein interactions and protein ubiquitination were examined using immunoprecipitation and proximity ligation assay and immunoblotting, respectively. Cell viability, damage and lipid peroxidation were evaluated using biochemical and cellular techniques.

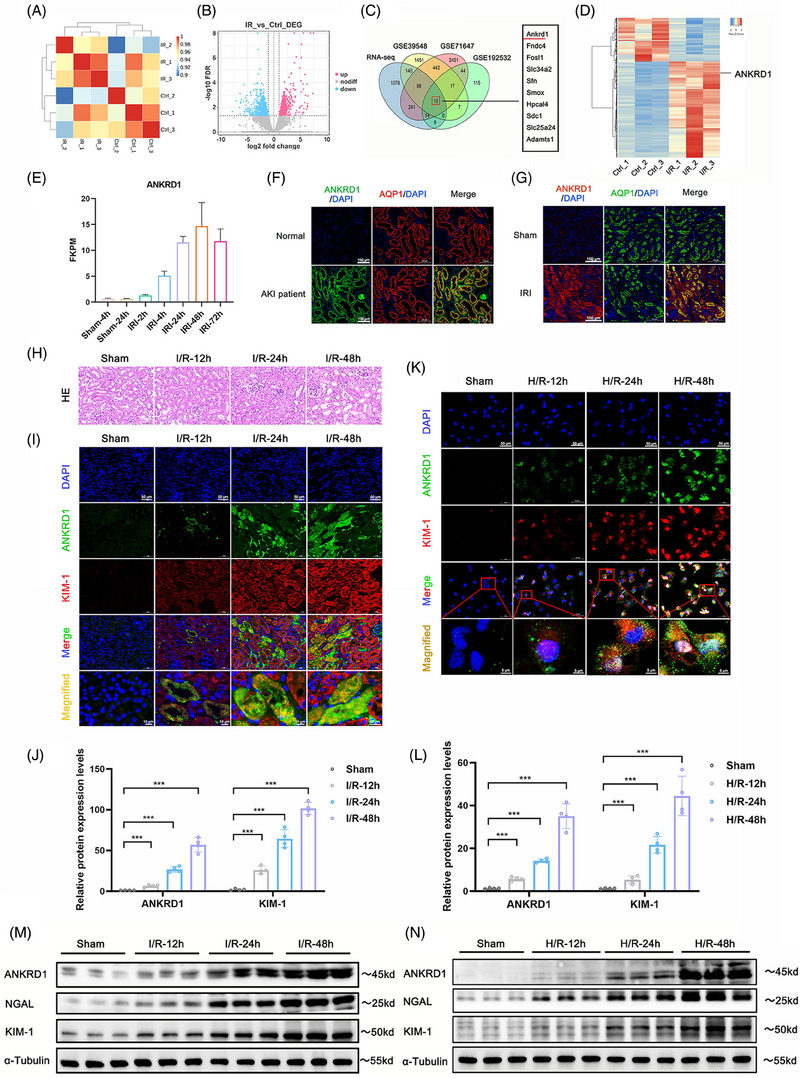
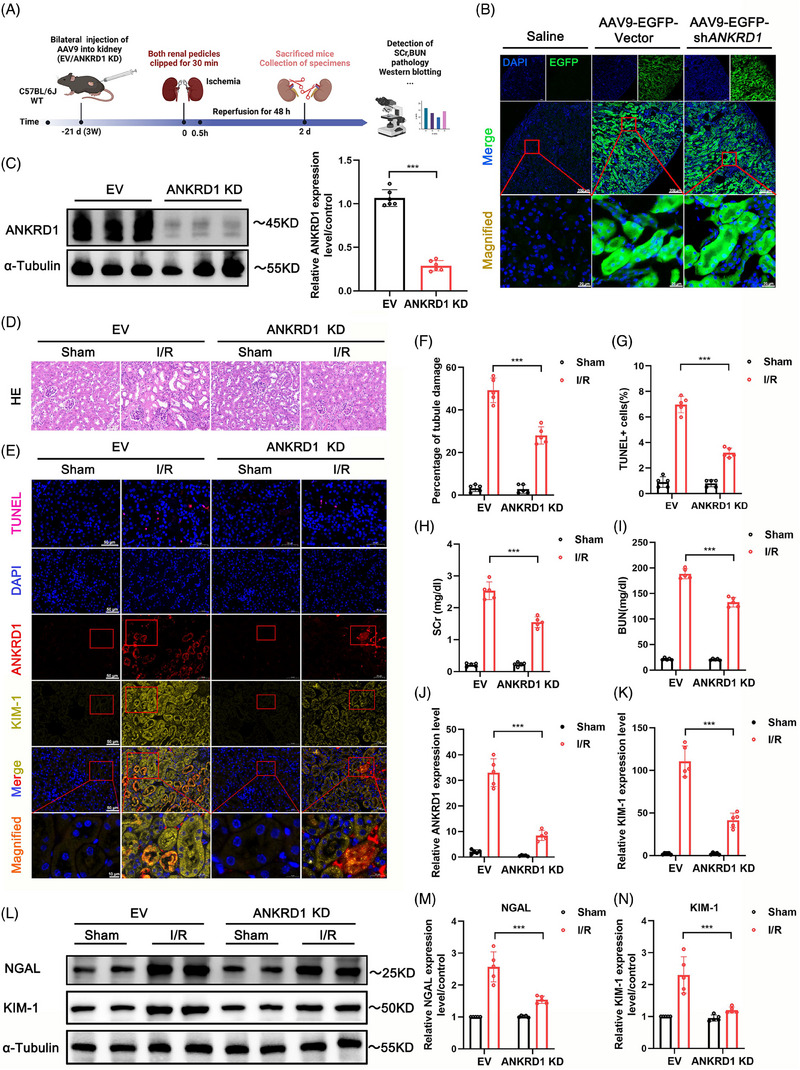
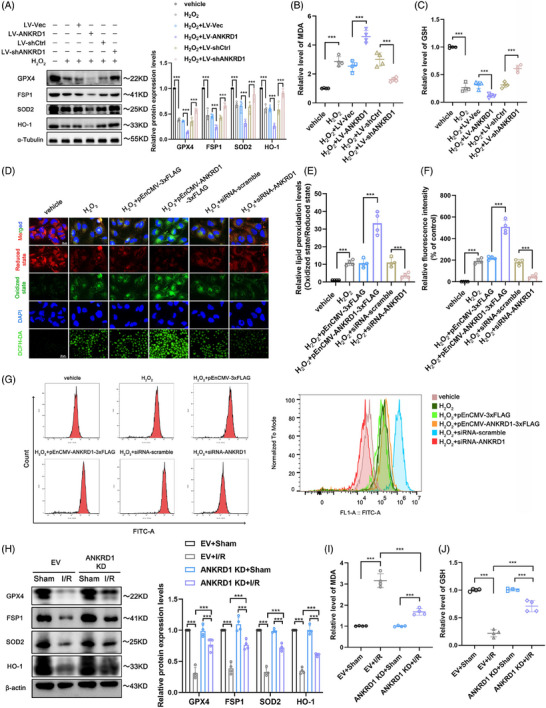
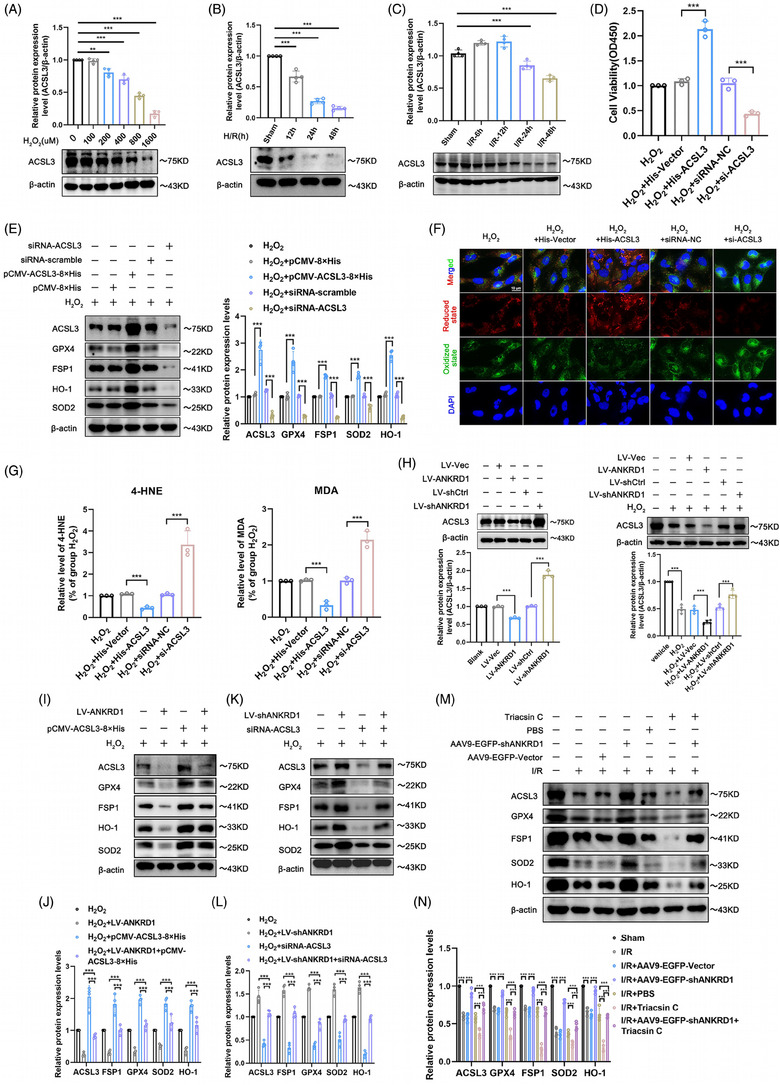
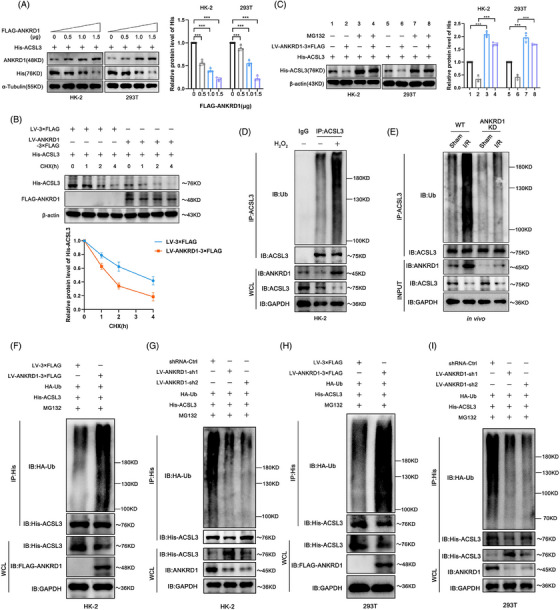
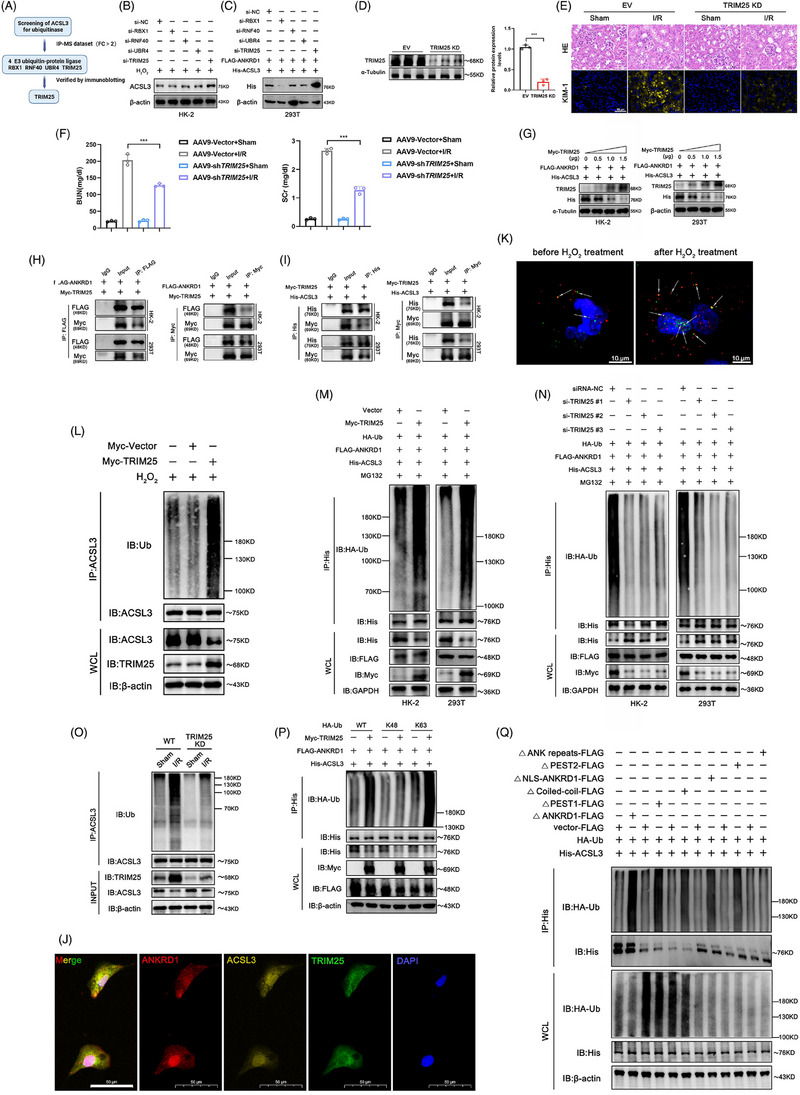
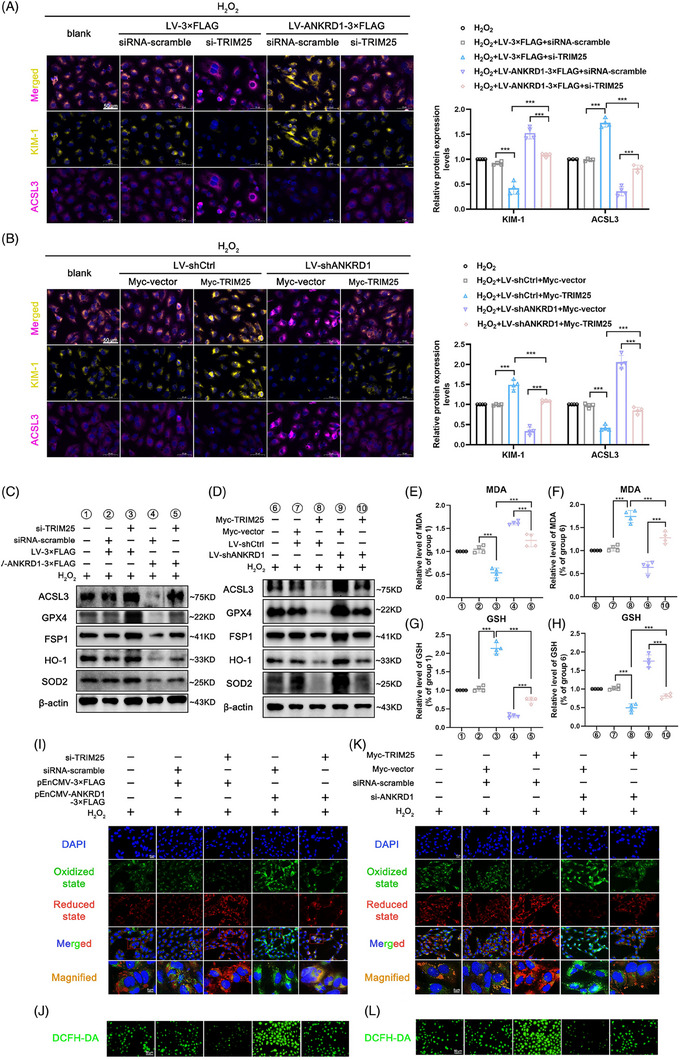
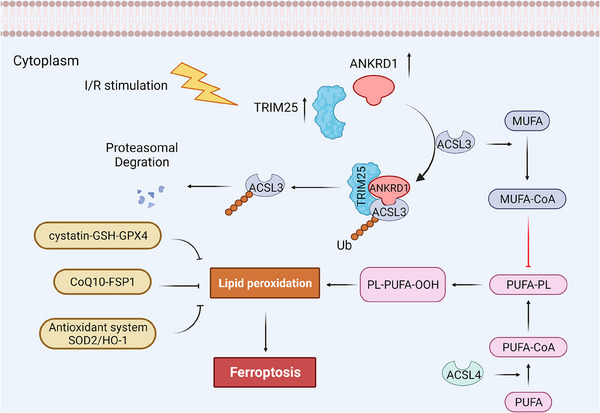
Results: First, we unveiled that ANKRD1 were significantly elevated in renal IRI models. Global knockdown of ANKRD1 in all cell types of mouse kidney by recombinant adeno-associated virus (rAAV9)-mitigated ischaemia/reperfusion-induced renal damage and failure. Silencing ANKRD1 enhanced cell viability and alleviated cell damage in human renal proximal tubule cells exposed to hypoxia reoxygenation or hydrogen peroxide, while ANKRD1 overexpression had the opposite effect. Second, we discovered that ANKRD1's detrimental function during renal IRI involves promoting lipid peroxidation and ferroptosis by directly binding to and decreasing levels of acyl-coenzyme A synthetase long-chain family member 3 (ACSL3), a key protein in lipid metabolism. Furthermore, attenuating ACSL3 in vivo through pharmaceutical approach and in vitro via RNA interference mitigated the anti-ferroptotic effect of ANKRD1 knockdown. Finally, we showed ANKRD1 facilitated post-translational degradation of ACSL3 by modulating E3 ligase tripartite motif containing 25 (TRIM25) to catalyse K63-linked ubiquitination of ACSL3, thereby amplifying lipid peroxidation and ferroptosis, exacerbating renal injury.

Conclusions: Our study revealed a previously unknown function of ANKRD1 in renal IRI. By driving ACSL3 ubiquitination and degradation, ANKRD1 aggravates ferroptosis and ultimately exacerbates IRI-AKI, underlining ANKRD1's potential as a therapeutic target for kidney IRI.

Key points/highlights: Ankyrin repeat domain 1 (ANKRD1) is rapidly activated in renal ischaemia‒reperfusion injury (IRI) models in vivo and in vitro. ANKRD1 knockdown mitigates kidney damage and preserves renal function. Ferroptosis contributes to the deteriorating function of ANKRD1 in renal IRI. ANKRD1 promotes acyl-coenzyme A synthetase long-chain family member 3 (ACSL3) degradation via the ubiquitin‒proteasome pathway. The E3 ligase tripartite motif containing 25 (TRIM25) is responsible for ANKRD1-mediated ubiquitination of ACSL3.

Keywords: ACSL3; ANKRD1; TRIM25; ferroptosis; renal ischaemic‒reperfusion injury; ubiquitination.


Conflict of interest statement

The authors declare they have no conflicts of interest.

Figures

FIGURE 1
FIGURE 1
(A) Ankyrin repeat domain 1 (ANKRD1) expression is increased in renal ischaemia‒reperfusion injury (IRI) model in vivo and in vitro. Sample correlation analysis revealing that ischaemia/reperfusion (I/R)‐treated samples could be well distinguished from control. (B) The volcano plot showing 851 upregulated and 728 downregulated differentially expressed genes (DEGs). (C) The intersection of our RNA‐seq data with three renal IRI GEO datasets (https://www.ncbi.nlm.nih.gov/geo, GSE39548, GSE71647 and GSE192532), and 10 common genes including ANKRD1 were obtained. GSE39548 (Mus musculus): kidney_control group, n = 4; kidney_IRI group, n = 4. GSE71647 (M. musculus): wild‐type (WT) normal kidneys, n = 2; WT IRI kidneys, n = 2. GSE192532 (M. musculus): WT sham renal, n = 3; WT IRI 24 h renal, n = 3. (D) Heatmap showing DEGs after renal I/R treatment. (E) The transcriptome trend chart of ANKRD1 using data from GEO (https://www.ncbi.nlm.nih.gov/geo/query/acc.cgi, GSE98622). ANKRD1 expression peaked as blood flow reperfused the kidneys for 48 h. GSE98622 (M. musculus): sham‐4 h, n = 3; sham‐24 h, n = 3; IRI‐2 h, n = 3; IRI‐4 h, n = 3; IRI‐24 h, n = 3; IRI‐48 h, n = 3; IRI‐72 h, n = 3. (F and G) Co‐localisation of ANKRD1 and AQP1 in human renal biopsy specimens and kidney of mice. (H and I) Renal tissues were collected for haematoxylin and eosin (HE) staining and immunofluorescence (IF) staining of kidney injury molecule 1 (KIM‐1) and ANKRD1 expression. Scale bar, 50 µm. (J) Quantitative analysis of KIM‐1 and ANKRD1 positive staining. (K) The expression of ANKRD1 and KIM‐1 in H/R‐treated HK‐2 cells as determined by IF staining. Scale bar, 50 µm. (L) Quantitative analysis of ANKRD1 and KIM‐1‐positive staining. (M) Immunoblot analysis of ANKRD1, KIM‐1 and lipocalin 2 (NGAL) in kidney tissues with α‐tubulin as a loading control. (N) Immunoblot analysis of ANKRD1, KIM‐1 and NGAL in HK‐2 cells with β‐actin as a loading control. The data in (E‒G), (I), (J) and (L) are expressed as the mean ± standard deviation (SD). *** p < .001.
FIGURE 2
FIGURE 2
Conditional knockdown of ankyrin repeat domain 1 (ANKRD1) effectively alleviates renal injury and preserves function. (A) Schematic diagram of the animal experimental procedure. Created with Biorender.com. (B) The success of renal recombinant adeno‐associated virus (rAAV9) transduction was determined by EGFP fluorescence detection. Scale bar, 200 µm. (C) Immunoblotting of renal cortical tissues confirmed the knockdown efficiency of ANKRD1 protein. (D and E) Renal tissues were collected for haematoxylin and eosin (HE) staining, TUNEL assay and IF staining of kidney injury molecule 1 (KIM‐1) and ANKRD1 expression. Scale bar, 50 µm. (F) Quantitative analysis of tubular damage. (G) Quantitative analysis of TUNEL+ cells. (H and I) Serum creatinine (SCr) and blood urea nitrogen (BUN) measurement. (J and K) Quantitative analysis of ANKRD1 and KIM‐1‐positive staining. (L) Representative immunoblot images of KIM‐1 and lipocalin 2 (NGAL) in renal tissues. (M and N) Quantitative analysis of NGAL and KIM‐1. The data in (C), (E‒J), (L) and (M) are expressed as the mean ± standard deviation (SD). *** p < .001.
FIGURE 3
FIGURE 3
(A) Ankyrin repeat domain 1 (ANKRD1) inhibition rescues H2O2‐induced renal tubular epithelial cell damage and decreased viability. The success of lentivirus transduction was detected by gcGFP fluorescence. (B) Immunoblotting of HK‐2 cells confirmed the knockdown and overexpression efficiency of ANKRD1 protein. (C) Cell viability of HK‐2 cells under different treatment conditions was analysed by CCK‐8. (D) Representative cellular images of ANKRD1 and kidney injury molecule 1 (KIM‐1) IF staining. Scale bar, 50 µm. (E and F) Quantitative analysis of ANKRD1 and KIM‐1‐positive staining. (G) Representative immunoblot images and quantification of KIM‐1 and lipocalin 2 (NGAL) in HK‐2 cells. The data in (B), (C) and (E‒G) are expressed as the mean ± standard deviation (SD). *** p < .001.
FIGURE 4
FIGURE 4
Lipid peroxidation contributes to the deteriorating function of ankyrin repeat domain 1 (ANKRD1) during renal ischaemia‒reperfusion injury (IRI) and H2O2 treatment. (A) Representative immunoblot images and quantification of GPX4, FSP1, HO‐1 and SOD2 in HK‐2 cells. (B and C) Intracellular malondialdehyde (MDA) and glutathione (GSH) levels of HK‐2 cells with different treatments. (D) Representative images of intracellular lipid peroxidation and total reactive oxygen species (ROS) in HK‐2 cells with different treatments. (E and F) Quantitative analysis of lipid peroxidation and total ROS. (G) Detection and quantification of ROS by flow cytometry. (H) Representative immunoblot images and quantification of GPX4, FSP1, HO‐1 and SOD2 in renal tissue. (I and J) MDA and GSH levels of renal tissue in each group. The data in (A‒C), (E), (F) and (H‒J) are expressed as the mean ± standard deviation (SD). *** p < .001.
FIGURE 5
FIGURE 5
(A) Ankyrin repeat domain 1 (ANKRD1) interacts with acyl‐coenzyme A synthetase long‐chain family member 3 (ACSL3) in renal tubular epithelial cell. Coomassie Blue‐stained gel showing immunoprecipitation (IP) product. (B) Schematic diagram of immunoprecipitation‐mass spectrometry (IP‐MS) procedure. Created with Biorender.com. (C) The volcano plot showing ACSL3 is a potential target protein of ANKRD1. (D) MS/MS spectra of the peptide ‘EVLNEEDEVQPNGK’. Peaks with colour are the detected b ions (green) and y ions (red). (E) Co‐localisation of ANKRD1 and ACSL3 in human renal biopsy specimens. (F) H2O2‐treated HK‐2 cell lysates were subjected to IP with IgG, ANKRD1 and ACSL3 antibody, respectively, followed by ANKRD1 and ACSL3 immunoblotting. (G) Ischaemia/reperfusion (I/R)‐treated renal tissue lysates were immunoprecipitated with IP with IgG, ANKRD1 and ACSL3 antibody, respectively, followed by ANKRD1 and ACSL3 immunoblotting. (H and I) Representative co‐immunoprecipitation (Co‐IP) images of ANKRD1 and ACSL3 interaction in HK‐2 and HEK 293T cells. The FLAG‐ANKRD1 and His‐ACSL3 plasmids were co‐transfected into cells. (J) Co‐localisation of ANKRD1 and ACSL3 in the nucleus and cytoplasm of HK‐2 cell as determined by IF staining. Scale bar, 50 µm. (K) Interactions of ANKRD1 with ACSL3 as predicted by molecular docking. ACSL3 was selected as the receptor protein and ANKRD1 was selected as the ligand protein. Hydrogen bonds are indicated in yellow. (L) The schematic diagram of human ANKRD1 and its truncated mutants. (M) IP and Western blot analysis of the His‐tagged ACSL3/FLAG‐tagged mutant ANKRD1 proteins interaction in the HK‐2 cells. (N) Detection of ANKRD1 and ACSL3 interaction in HK‐2 cells by proximity ligation assay (PLA). Scale bar, 20 µm.
FIGURE 6
FIGURE 6
Ankyrin repeat domain 1 (ANKRD1) decreases acyl‐coenzyme A synthetase long‐chain family member 3 (ACSL3) expression and activity, aggravating ferroptosis in renal ischaemia‒reperfusion injury (IRI). (A) Representative immunoblot images and quantification of ACSL3 in H2O2‐treated HK‐2 cells. (B) Representative immunoblot images and quantification of ACSL3 in H/R‐treated HK‐2 cells. (C) Representative immunoblot images and quantification of ACSL3 in ischaemia/reperfusion (I/R)‐treated mice kidney. (D) Detection of HK‐2 cell viability by cell counting kit‐8 (CCK‐8) assay upon overexpression or knockdown of ACSL3. (E) Representative immunoblot images and quantification of ACSL3, GPX4, FSP1, HO‐1 and SOD2 in H2O2‐treated HK‐2 cells after overexpression or knockdown of ACSL3. (F) Detection of lipid reactive oxygen species (ROS) by C11 BODIPY assay upon overexpression or knockdown of ACSL3 in HK‐2 cells. (G) Detection of 4‐Hydroxynonenal (4‐HNE) and malondialdehyde (MDA) in HK‐2 cells after intervention with ACSL3. (H) Effects of overexpression or knockdown of ANKRD1 on ACSL3 in HK‐2 cells as determined by Western blot. (I and J) Representative immunoblot images and quantification of ACSL3, GPX4, FSP1, HO‐1 and SOD2 in H2O2‐treated HK‐2 cells after overexpression of ANKRD1 and ACSL3. (K and L) Representative immunoblot images and quantification of ACSL3, GPX4, FSP1, HO‐1 and SOD2 in H2O2‐treated HK‐2 cells after knockdown of ANKRD1 and ACSL3. (M and N) Representative immunoblot images and quantification of ACSL3, GPX4, FSP1, HO‐1 and SOD2 in I/R‐treated mice kidney after knockdown of ANKRD1 and ACSL3 by pharmacological inhibition and gene intervention. The data in (A‒E), (G), (I) and (K) are expressed as the mean ± standard deviation (SD). ** p < .01; *** p < .001.
FIGURE 7
FIGURE 7
Ankyrin repeat domain 1 (ANKRD1) promotes acyl‐coenzyme A synthetase long‐chain family member 3 (ACSL3) degradation via the ubiquitin‒proteasome pathway. (A) Immunoblot analysis and quantification of His levels after transfected with the indicated doses of FLAG‐ANKRD1 plasmids in HK‐2 and HEK 293T cells. (B) ANKRD1 overexpression reduced the stability of ACSL3. HK‐2 cells were treated with cycloheximide (CHX) for the indicated time. (C) HK‐2 and HEK 293T cells were treated with MG132. The levels of ACSL3 were detected by Western blot analysis. (D) Detection of endogenous ubiquitination levels of ACSL3 in H2O2‐treated HK‐2 cells. (E) Detection of endogenous ubiquitination levels of ACSL3 in ANKRD1‐deficient mice kidney. (F‒I) HK‐2 and HEK 293T cells were treated with 5 µM MG132 for 5 h prior to harvest. Cell lysate was immunoprecipitated with His‐tag antibody and immunoblotted as indicated. The data in (A‒C) are expressed as the mean ± standard deviation (SD). *** p < .001.
FIGURE 8
FIGURE 8
A) Ankyrin repeat domain 1 (ANKRD1) facilitates acyl‐coenzyme A synthetase long‐chain family member 3 (ACSL3) degradation by collaborating with the E3 ligase tripartite motif containing 25 (TRIM25) to catalyse the K63‐linked polyubiquitination of ACSL3. Identification of possible E3 ligases that regulate the stability of ACSL3 and interact with ANKRD1 simultaneously. (B) Representative immunoblot images of ACSL3 in H2O2‐treated HK‐2 cells after knockdown of the indicated genes. (C) Immunoblot images of ACSL3 in HEK 293T cells after ANKRD1 overexpression and knockdown of the indicated genes. (D) Immunoblotting of renal cortical tissues confirmed the knockdown efficiency of TRIM25 protein. (E) Renal tissues were collected for haematoxylin and eosin (HE) staining and IF staining of kidney injury molecule 1 (KIM‐1). Scale bar, 50 µm. (F) Serum creatinine (SCr) and blood urea nitrogen (BUN) measurement. (G) Immunoblot analysis of His and TRIM25 levels after transfected with the indicated doses of Myc‐TRIM25 plasmids in HK‐2 and HEK 293T cells. (H) Co‐immunoprecipitation (Co‐IP) assay of TRIM25 and ANKRD1 in HK‐2 and HEK 293T cells. (I) Co‐IP assay of TRIM25 and ACSL3 in HK‐2 and HEK 293T cells. (J) Co‐localisation of ANKRD1, ACSL3 and TRIM25 in HK‐2 cells as determined by IF staining. Scale bar, 50 µm. (K) The interaction between TRIM25, ANKRD1 and ACSL3 was significantly increased in H2O2‐stimulated HK‐2 cells as determined by proximity ligation assay (PLA) assay. Red: interaction between ANKRD1 and TRIM25; green: interaction between ACSL3 and TRIM25. Scale bar, 10 µm. (L) High levels of TRIM25 were observed to augment endogenous ubiquitination of ACSL3 in H2O2‐stimulated HK‐2 cells. Myc‐tagged TRIM25 was transfected into HK‐2 cells, and endogenous ubiquitination levels of ACSL3 were detected by immunoprecipitation and Western blot analysis. (M and N) HK‐2 and HEK 293T cells were treated with 5 µM MG132 for 5 h prior to harvest. Cell lysate was immunoprecipitated with His‐tag antibody and immunoblotted as indicated. (O) Detection of endogenous ubiquitination levels of ACSL3 in TRIM25‐deficient mice kidney. (P) HK‐2 cells were co‐transfected with indicated plasmids, and ACSL3 ubiquitination was analysed. (Q) ANK repeat domain is required for ANKRD1‐mediated ubiquitination of ACSL3 in HK‐2 cells. The PEST1, coiled‐coil, NLS, PEST2 and ANK repeats regions were deleted separately to construct various ANKRD1 truncation. HK‐2 cells were transfected with FLAG‐tagged wild‐type (WT) or mutant plasmids of ANKRD1, HA‐Ub and His‐ACSL3. Cell lysate was immunoprecipitated with His‐tag antibody and immunoblotted as indicated. *** p < .001.
FIGURE 9
FIGURE 9
Ankyrin repeat domain 1 (ANKRD1)‐mediated cell damage are correlated with the function of tripartite motif containing 25 (TRIM25). (A and B) Representative cellular images and quantification of acyl‐coenzyme A synthetase long‐chain family member 3 (ACSL3) and kidney injury molecule 1 (KIM‐1) IF staining. Scale bar, 50 µm. (C and D) Representative immunoblot images of ACSL3, GPX4, FSP1, HO‐1 and SOD2 in HK‐2 cells with different treatments. (E and F) Malondialdehyde (MDA) levels in HK‐2 cells with different treatments. (G and H) Glutathione (GSH) levels in HK‐2 cells with different treatments. (I‒L) Representative images of intracellular lipid peroxidation and total reactive oxygen species (ROS) in HK‐2 cells with different treatments. The data in (A), (B) and (E‒H) are expressed as the mean ± standard deviation (SD). *** p < .001.
FIGURE 10
FIGURE 10
Schematic of signalling pathways related to the effects of ankyrin repeat domain 1 (ANKRD1)/tripartite motif containing 25 (TRIM25)/acyl‐coenzyme A synthetase long‐chain family member 3 (ACSL3) in ischaemia/reperfusion (I/R)‐induced renal injury. Created with Biorender.com.

Similar articles

Cited by

References

    1. Bonventre JV, Weinberg JM. Recent advances in the pathophysiology of ischemic acute renal failure. J Am Soc Nephrol. 2003;14:2199‐2210. - PubMed
    1. Agarwal A, Dong Z, Harris R, et al. Cellular and molecular mechanisms of AKI. J Am Soc Nephrol. 2016;27:1288‐1299. - PMC - PubMed
    1. Linkermann A, Chen G, Dong G, Kunzendorf U, Krautwald S, Dong Z. Regulated cell death in AKI. J Am Soc Nephrol. 2014;25:2689‐2701. - PMC - PubMed
    1. Havasi A, Borkan SC. Apoptosis and acute kidney injury. Kidney Int. 2011;80:29‐40. - PMC - PubMed
    1. Zhao M, Wang Y, Li L, et al. Mitochondrial ROS promote mitochondrial dysfunction and inflammation in ischemic acute kidney injury by disrupting TFAM‐mediated mtDNA maintenance. Theranostics. 2021;11:1845‐1863. - PMC - PubMed

MeSH terms

LinkOut - more resources