. 2024 Aug 24:28:101217.
doi: 10.1016/j.mtbio.2024.101217. eCollection 2024 Oct.

Bionic aggregation-induced emission photosensitizer for enhanced cancer immunotherapy

Affiliations

Bionic aggregation-induced emission photosensitizer for enhanced cancer immunotherapy

Zhongxian Chen et al. Mater Today Bio. .

Abstract

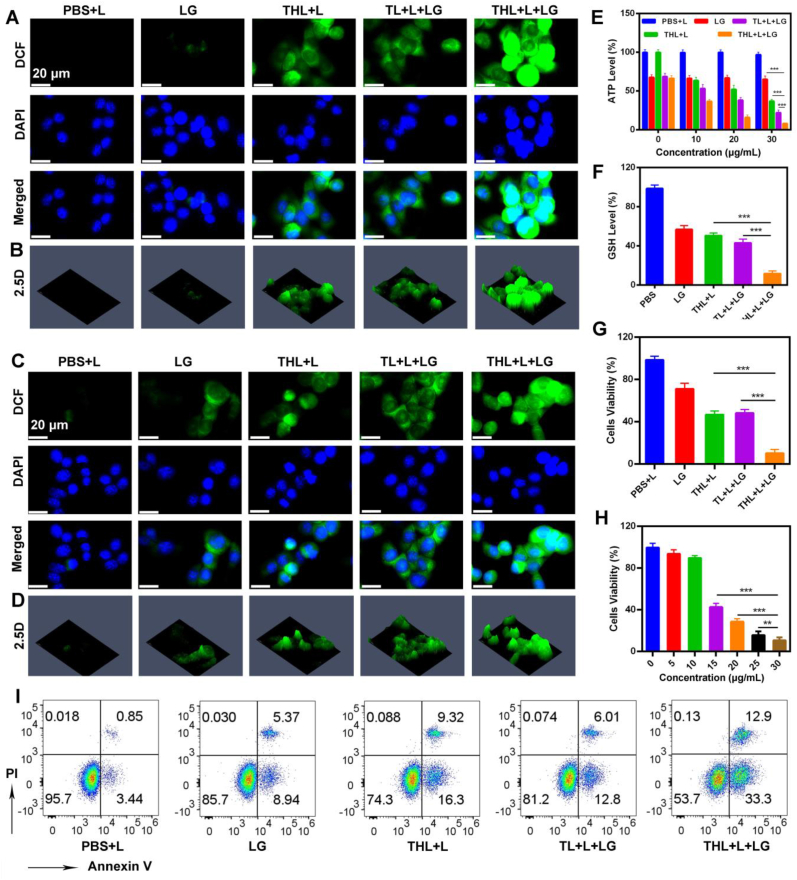
Cold exposure therapy (CE), as an inexpensive method, has shown great potential in cancer therapy. Exploring the combined anti-tumor mechanism of CE and traditional therapies (such as photodynamic therapy (PDT)) is exciting and promising. Here, a bionic aggregation-induced emission photosensitizer system (named THL) is designed for combined CE to enhance anti-tumor immunotherapy. THL inherits the homologous targeting ability of tumor derived exosomes, promoting the enrichment of THL at the tumor site. Under external illumination, THL generates hydroxyl radicals and superoxide anions through type I PDT. In addition, mice are pretreated with cold exposure, which promotes THL mediated PDT and reactive oxygen species (ROS) generation by reducing the production of ATP and GSH in tumor tissue. This combination therapy increases production of ROS within the tumor, inhibits the growth of distant tumors, recurrent and rechallenged tumors and increases the number of cytotoxic CD8+T cells and memory T cells. Compared to PDT alone, combination therapy shows greater advantages in tumor immunotherapy. The combination therapy strategy provides new ideas for cancer immunotherapy.

Keywords: Aggregation-induced emission photosensitizer; Cancer immunotherapy; Cold exposure therapy; GSH depletion; Type I PDT.


Conflict of interest statement

The authors declare that they have no known competing financial interests or personal relationships that could have appeared to influence the work reported in this paper.

Figures

Image 1
Scheme 1. Schematic illustration of bionic type I aggregation-induced emission photosensitizer for enhanced immunotherapy of breast cancer.
Scheme 1
Scheme 1
Schematic illustration of bionic aggregation-induced emission photosensitizer for enhanced immunotherapy of breast cancer.
Fig. 1
Fig. 1
Preparation and characterization of THL. (A) TEM images of TL, EXO and THL. (B) The hydrodynamic diameter and zeta potential of different formulations suspended in PBS. Data are displayed as the mean ± SD (n = 3). (C) Stability of THL in PBS or PBS containing 10 % FBS. Data are displayed as the mean ± SD (n = 3). (D) EXO markers, including CD63 and CD9, were detected using western blotting. (E) Absorption spectra of chloroperoxidase (in PBS), THL (in PBS), blank EXO hybrid liposomes (HL, in PBS) and TTMN (DMSO). (F) CLSM images of cancer cells incubated with DiO labelled TL or THL for 1h. Blue: DAPI; Green: DiO. (G) The frequency of different DiO fluorescence intensities appearing in Fig. 1F (measured by Zen software). (H) Relative changes in fluorescence intensity of HPF, (I) DHR123 and (J) SOSG after indicated treatments under white light irradiation. Light power: 10 mW/cm2. (K) Generation of •OH, (L) •O2 and (M) 1O2 by the THL was determined by ESR. L: White Light, 10 mW/cm2.
Fig. 2
Fig. 2
In vitro anti-tumor evaluation. (A) Fluorescence images of ROS generation in normoxic 4T1 cells pretreated with indicated formulations, and (B) the corresponding 2.5D images of different DCFH-DA (DCF) intensities appearing in Fig. 2A (measured by Zen software). LG: low-glucose treatment. L: 0.01 W/cm2, 5 min. The TTMN concentration was 30 μg/mL. (C) Fluorescence image of ROS generation in hypoxic 4T1 cells pretreated with indicated formulations, and (D) the corresponding 2.5D images of different DCFH-DA (DCF) intensities appearing in Fig. 2C (measured by Zen software). L: 0.01 W/cm2, 5 min. The concentration of TTMN is 0.03 mg/mL. (E) Intracellular ATP and (F) GSH levels after indicated therapy. The concentration of TTMN is 0.03 mg/mL. (G) Cell viability of 4T1 cells after different treatments (n = 3). L: 0.01 W/cm2, 5 min. The concentration of TTMN is 0.03 mg/mL. (H) Cell viability of 4T1 cells after THL + L treatments with different TTMN concentration (n = 3). L: 0.01 W/cm2, 5 min. (I) Annexin V/PI assy by flow cytometry after various treatments in 4T1 cells. The concentration of TTMN is 0.03 mg/mL. Statistical significance was calculated via one-way ANOVA with Tukey's test: **p < 0.01, ***p < 0.001.
Fig. 3
Fig. 3
Inducing immunogenic cell death (ICD) in vitro. (A) Fluorescence images of calreticulin (CRT) in 4T1 cells treated with indicated formulations, and the corresponding 2.5D images of different CRT intensities appearing in Fig. 3A (measured by Zen software). LG: low-glucose treatment. L: 0.01 W/cm2, 5 min. The TTMN concentration was 30 μg/mL. (B) The corresponding CRT fluorescence intensity in Fig. 3A (measured by FlowJo software). (C) Immunofluorescence staining (Red: HMGB1, Blue: DAPI) in 4T1 cells after various treatments. (D) Quantitative examination of released HMGB1 from 4T1 cells after various treatments (n = 3). (E) Matured DCs (CD80+CD86+) measured by flow cytometry and (F) quantitative analysis (n = 3). Data are shown as the mean ± SD. The concentration of TTMN in above experiments is 0.03 mg/mL. Statistical significance was calculated via one-way ANOVA with Tukey's test: ***p < 0.001.
Fig. 4
Fig. 4
Tumor targeting and BAT analysis in vivo. (A) In vivo pharmacokinetic profile of indicated treatment. The dose of TTMN was 5 mg/kg. (B) Biodistribution profile of THL and TL in the main organs and tumor tissues at 12-h post-injection. The dose of TTMN was 5 mg/kg. (C) Immunofluorescence staining of BAT for UCP1 and perilipin, followed by counterstaining with DAPI (blue) in 4T1 tumor-bearing mice under the 25 °C (PBS + L) and 4 °C (CE) conditions. (D) Western blot was used to detect the expression of UCP1 expression in BAT after different treatments. (E) H&E histological staining of BAT after different treatments. Statistical significance was calculated via one-way ANOVA with Tukey's test: **p < 0.01.
Fig. 5
Fig. 5
(A) Schematic illustration of the studies of 4T1 tumor therapy. (B) Detection of glucose and (C) GSH levels in tumors after different treatments. (D) Growth profile of the primary and (E) distant tumor volume after various treatments. (F) Tumor weight of primary and distant tumors. (G) Survival curves after treatment. (H) CRT, staining analyses of primary tumor tissues treated with various treatments. (I) Flow cytometry analysis of treatment-induced dendritic cell maturation in the lymph nodes. (J) HE staining analyses of distant tumor tissues treated with various treatments. (K) ELISA analysis of the levels of proinflammatory cytokines IFN-γ and (L) TNF-⍺ in serum of mice isolated at the end of treatments (n = 5). (M) Immunofluorescence staining of CD8 (green) from distant tumors in different treatment groups. (N) Quantitative analysis and (O) Flow cytometry analysis of CD4+ CD8+ T lymphocytes in distant tumors. The TTMN and EXO protein dosage used in above experimental is 5 mg/kg. Data are shown as the mean ± SD. Statistical significance was calculated via one-way ANOVA with Tukey's test: **p < 0.01, ***p < 0.001.
Fig. 6
Fig. 6
(A)Schematic illustration of the studies of 4T1 tumor rechallenge and recurrence. (B) Survival curves after treatment. (C) Recurrence of 4T1 tumor growth (n = 5). (D) Rechallenge of 4T1 tumor growth (n = 5). (E) The tumor weight of mice was recorded for various treatments (n = 5). (F) Quantitative statistics of proportion of central memory T cells (TCM cells; CD62L + CD44+) in blood on day 21 after the treatment (n = 5). (G) Growth curve of rechallenge tumor in each mouse. (H) Proportion of central memory T cells (TCM cells; CD62L + CD44+) in blood on day 21 after the treatment measured by flow cytometry. (I) Immunofluorescence staining analyses of CD8+ T cells and the corresponding 2.5D images (measured by Zen software) in rechallenged tumor tissues treated with various treatments. The TTMN and EXO protein dosage used in above experimental is 5 mg/kg. Data are shown as the mean ± SD. Statistical significance was calculated via one-way ANOVA with Tukey's test: ***p < 0.001.

References

    1. Christofk H.R., Vander Heiden M.G., Harris M.H., Ramanathan A., Gerszten R.E., Wei R., Fleming M.D., Schreiber S.L., Cantley L.C. The M2 splice isoform of pyruvate kinase is important for cancer metabolism and tumour growth. Nature. 2008;452(7184):230. U74. - PubMed
    1. Min H., Wang J., Qi Y., Zhang Y., Han X., Xu Y., Xu J., Li Y., Chen L., Cheng K., Liu G., Yang N., Li Y., Nie G. Biomimetic metal–organic framework nanoparticles for cooperative combination of antiangiogenesis and photodynamic therapy for enhanced efficacy. Adv. Mater. 2019;31(15) - PubMed
    1. Chen Z.-X., Liu M.-D., Zhang M.-K., Wang S.-B., Xu L., Li C.-X., Gao F., Xie B.-R., Zhong Z.-L., Zhang X.-Z. Interfering with lactate-fueled respiration for enhanced photodynamic tumor therapy by a porphyrinic MOF nanoplatform. Adv. Funct. Mater. 2018;28(36)
    1. Seki T., Yang Y., Sun X., Lim S., Xie S., Guo Z., Xiong W., Kuroda M., Sakaue H., Hosaka K., Jing X., Yoshihara M., Qu L., Li X., Chen Y., Cao Y. Brown-fat-mediated tumour suppression by cold-altered global metabolism. Nature. 2022;608(7922):421–428. - PMC - PubMed
    1. Pan Y., Suo M., Huang Q., Lyu M., Jiang Y., Wang S., Tang W., Ning S., Zhang T. Near-infrared laser-activated aggregation-induced emission nanoparticles boost tumor carbonyl stress and immunotherapy of breast cancer. Aggregate. 2023;5:e432.

LinkOut - more resources