

Comprehensive evaluation of fetal renal ultrasound parameters for fetal growth restriction
- PMID: 39286114
- PMCID: PMC11402987
- DOI: 10.1016/j.heliyon.2024.e36687
Comprehensive evaluation of fetal renal ultrasound parameters for fetal growth restriction
Abstract
Objective: This study aims to investigate variances in renal ultrasound parameters between fetuses experiencing fetal growth restriction (FGR) and those with normal intrauterine development, with the intent to offer actionable insights for clinical management.
Method: Forty-five pregnant women diagnosed with FGR between 28 and 36 weeks of gestation, who underwent examination at Wenzhou People's Hospital from September 2021 to June 2023, constituted the FGR group. Concurrently, 65 pregnant women with normal intrauterine development at matching gestational weeks formed the control group. Renal ultrasound parameters, encompassing renal artery peak systolic velocity (PSV), end diastolic velocity (EDV), time averaged maximum velocity (TAMX), resistive indices (S/D, PI, RI), ratios of renal volume to gestational age (RV/WEEK) and estimated fetal weight (RV/EFW), vascular indices (VI, FI, VFI), were compared between the two groups. All parameters represented the mean values of bilateral kidneys.
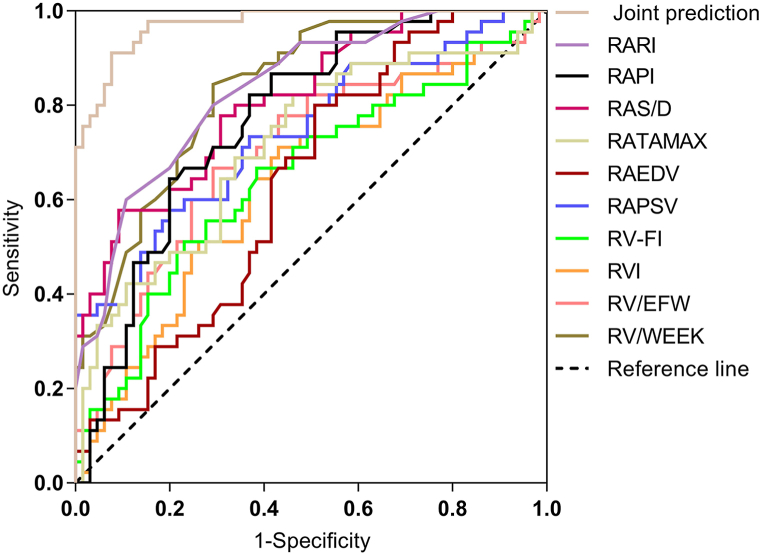
Result: In the FGR group, fetal renal artery PSV (37.71 ± 9.93 cm/s), EDV (6.19 ± 1.50 cm/s), TAMX (15.10 ± 3.83 cm/s), RV/WEEK (0.45 ± 0.12), RV/EFW (7.53 ± 3.24), VI (22.19 ± 15.00), and VFI (5.53 ± 3.63) were significantly lower compared to the control group (PSV: 47.11 ± 11.24 cm/s, EDV: 7.13 ± 2.00 cm/s, TAMX: 17.85 ± 3.85 cm/s, RV/WEEK: 0.66 ± 0.19, RV/EFW:9.20 ± 3.17, VI: 28.67 ± 14.72, VFI: 7.40 ± 3.68). Conversely, fetal renal artery resistive indices (S/D: 9.09 ± 2.58, PI: 2.71 ± 0.56, RI: 0.92 ± 0.04) in the FGR group were notably higher than those in the control group (S/D: 6.22 ± 1.93, PI: 2.20 ± 0.73, RI: 0.87 ± 0.04), with statistical significance (P < 0.05). No significant difference was found in renal FI between the FGR group (26.78 ± 6.59) and the control group (26.89 ± 5.82) (P > 0.05). Receiver operating characteristic (ROC) curve analysis revealed higher diagnostic efficacy for RV/WEEK and RI among individual indicators, while combined parameter application yielded the highest diagnostic efficiency.
Conclusion: Utilizing a comprehensive evaluation of fetal kidney ultrasound parameters with multiple indices facilitates early screening and diagnosis of FGR fetuses, thereby aiding clinical decision-making and enhancing newborn birth outcomes.
Keywords: Diagnostic efficacy; Fetal growth restriction; Multi-parameter evaluation; Renal ultrasound.
© 2024 The Authors.
Conflict of interest statement
The authors declare that they have no known competing financial interests or personal relationships that could have appeared to influence the work reported in this paper.
Figures


References
LinkOut - more resources
Full Text Sources
Research Materials
Miscellaneous
