

Trusted artificial intelligence for environmental assessments: An explainable high-precision model with multi-source big data
- PMID: 39286480
- PMCID: PMC11402945
- DOI: 10.1016/j.ese.2024.100479
Trusted artificial intelligence for environmental assessments: An explainable high-precision model with multi-source big data
Abstract
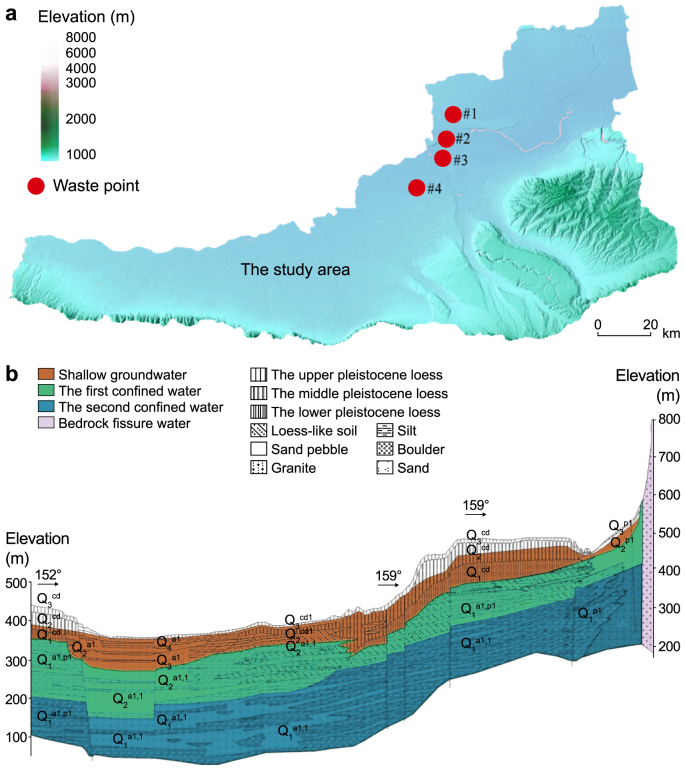
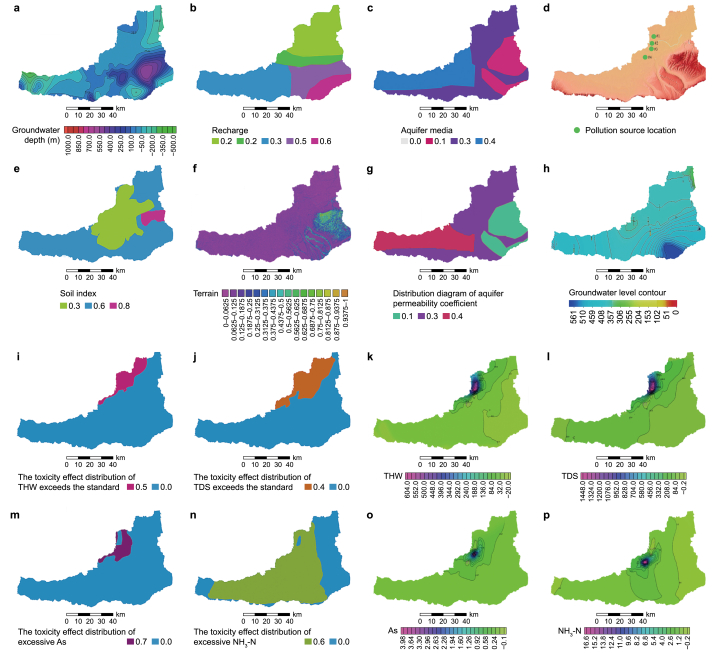
Environmental assessments are critical for ensuring the sustainable development of human civilization. The integration of artificial intelligence (AI) in these assessments has shown great promise, yet the "black box" nature of AI models often undermines trust due to the lack of transparency in their decision-making processes, even when these models demonstrate high accuracy. To address this challenge, we evaluated the performance of a transformer model against other AI approaches, utilizing extensive multivariate and spatiotemporal environmental datasets encompassing both natural and anthropogenic indicators. We further explored the application of saliency maps as a novel explainability tool in multi-source AI-driven environmental assessments, enabling the identification of individual indicators' contributions to the model's predictions. We find that the transformer model outperforms others, achieving an accuracy of about 98% and an area under the receiver operating characteristic curve (AUC) of 0.891. Regionally, the environmental assessment values are predominantly classified as level II or III in the central and southwestern study areas, level IV in the northern region, and level V in the western region. Through explainability analysis, we identify that water hardness, total dissolved solids, and arsenic concentrations are the most influential indicators in the model. Our AI-driven environmental assessment model is accurate and explainable, offering actionable insights for targeted environmental management. Furthermore, this study advances the application of AI in environmental science by presenting a robust, explainable model that bridges the gap between machine learning and environmental governance, enhancing both understanding and trust in AI-assisted environmental assessments.
Keywords: Explainable AI; Intelligent environmental assessment; Multi-source data; Transformer.
© 2024 The Authors.
Conflict of interest statement
The authors declare that they have no known competing financial interests or personal relationships that could have appeared to influence the work reported in this paper.
Figures


References
-
- Amiri V., et al. Mercury pollution in the coastal Urmia aquifer in northwestern Iran: potential sources, mobility, and toxicity. Environ. Sci. Pollut. Res. 2021;28:17546–17562. - PubMed
-
- He F.H., et al. The synthetic geo-ecological environmental evaluation of a coastal coal-mining city using spatiotemporal big data: a case study in Longkou, China. J. Clean. Prod. 2017;142:854–866.
-
- Cho N., et al. Construction of spatiotemporal big data using environmental impact assessment information. Korean Journal of Remote Sensing. 2020;36:637–643.
-
- Xu H.L., et al. Multivariate and spatio-temporal groundwater pollution risk assessment: a new long-time serial groundwater environmental impact assessment system. Environ. Pollut. 2023;317 - PubMed
-
- Liu W.W., et al. Intelligent comprehensive evaluation system using artificial intelligence for environmental evaluation. Environ. Impact Assess. Rev. 2021;86
LinkOut - more resources
Full Text Sources
Miscellaneous
