. 2024 Jun 27;3(7):888-898.
doi: 10.1016/j.gastha.2024.06.010. eCollection 2024.

TNF Promoter Hypomethylation Is Associated With Mucosal Inflammation in IBD and Anti-TNF Response

Affiliations

TNF Promoter Hypomethylation Is Associated With Mucosal Inflammation in IBD and Anti-TNF Response

Daniel S Levic et al. Gastro Hep Adv. .

Abstract

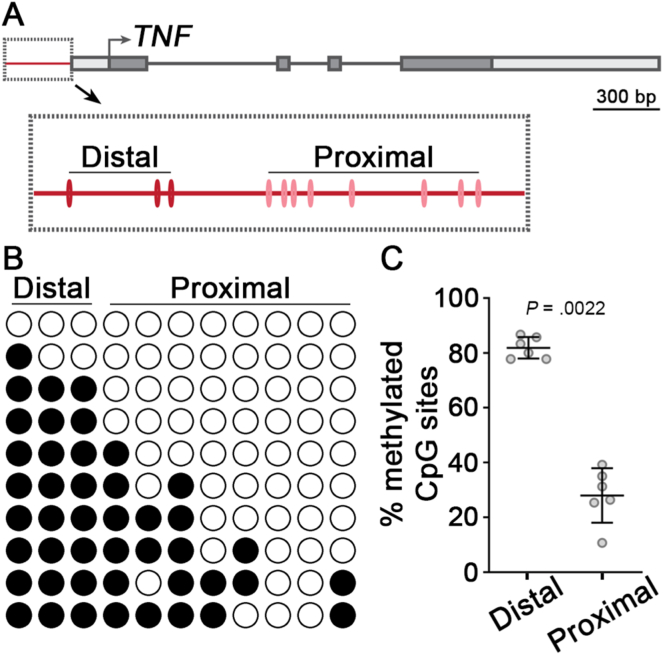
Background and aims: Inflammatory bowel diseases (IBDs) are chronic inflammatory conditions influenced heavily by environmental factors. DNA methylation is a form of epigenetic regulation linking environmental stimuli to gene expression changes and inflammation. Here, we investigated how DNA methylation of the tumor necrosis factor (TNF) promoter differs between inflamed and uninflamed mucosa of IBD patients, including anti-TNF responders and nonresponders.

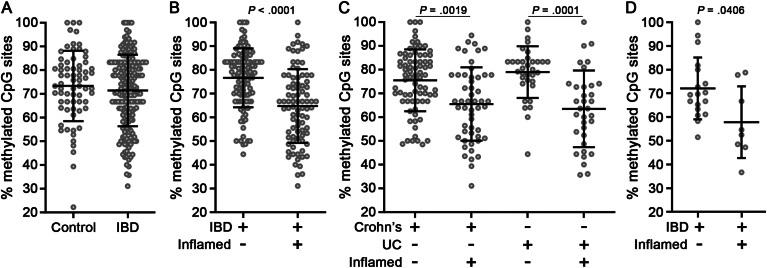
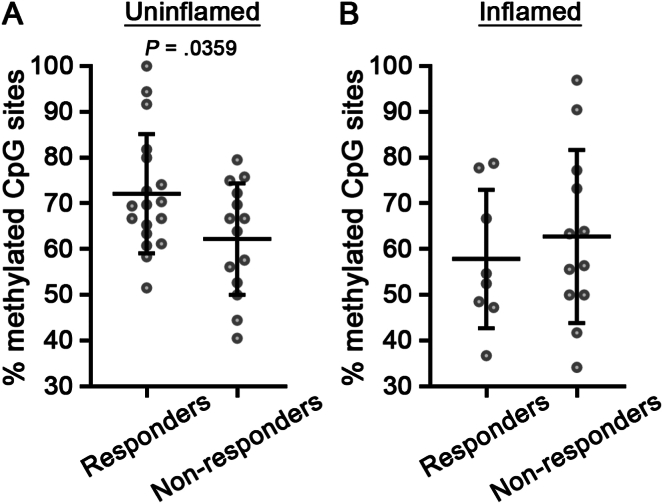
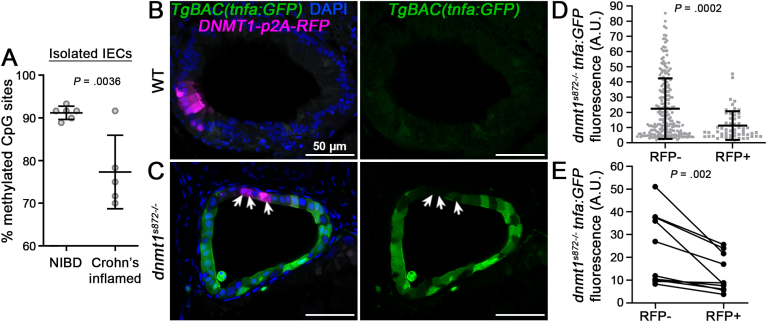
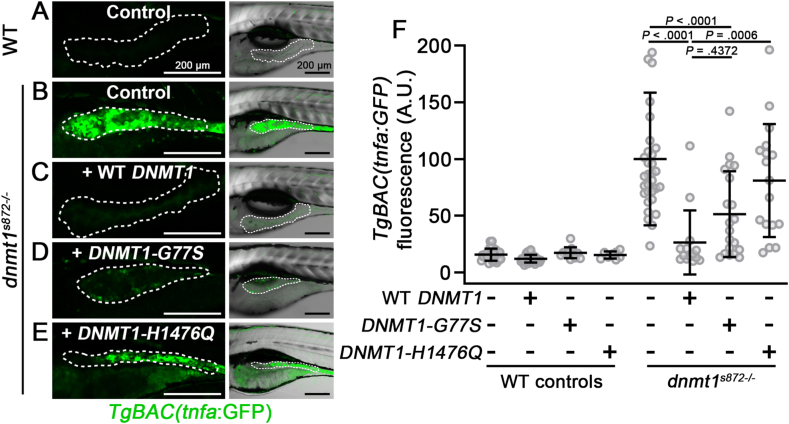
Methods: We obtained mucosal biopsies from 200 participants (133 IBDs and 67 controls) and analyzed TNF promoter methylation using bisulfite sequencing, comparing inflamed with uninflamed segments, in addition to paired inflamed/uninflamed samples from individual patients. We conducted similar analyses on purified intestinal epithelial cells from bowel resections. We also compared TNF methylation levels of inflamed and uninflamed mucosa from a separate cohort of 15 anti-TNF responders and 17 nonresponders. Finally, we sequenced DNA methyltransferase genes to identify rare variants in IBD patients and functionally tested them using rescue experiments in a zebrafish genetic model of DNA methylation deficiency.

Results: TNF promoter methylation levels were decreased in inflamed mucosa of IBD patients and correlated with disease severity. Isolated intestinal epithelial cells from inflamed tissue showed proportional decreases in TNF methylation. Anti-TNF nonresponders showed lower levels of TNF methylation than responders in uninflamed mucosa. Our sequencing analysis revealed 2 missense variants in DNA methyltransferase 1, 1 of which had reduced function in vivo.

Conclusion: Our study reveals an association of TNF promoter hypomethylation with mucosal inflammation, suggesting that IBD patients may be particularly sensitive to inflammatory environmental insults affecting DNA methylation. Together, our analyses indicate that TNF promoter methylation analysis may aid in the characterization of IBD status and evaluation of anti-TNF therapy response.

Keywords: Anit-TNF Response; Epigenetics; Inflammatory Bowel Disease; Methylation.


Figures

Figure 1
Figure 1
Methylation analysis of the TNF promoter from healthy human colon mucosa. (A) Schematic of the human TNF gene. CpG sites of the promoter region (red line) are shown in the boxed inset. (B) Methylation analysis of the TNF promoter from healthy human colon using targeted bisulfite sequencing. Columns represent individual CpG sites, and rows are 10 sequencing replicates for a single donor. Filled circles are methylated CpG sites, while open circles are nonmethylated. (C) Quantification of methylation analysis from healthy human colon. Individual data points are average methylation values (n = 6 samples each). Mean ± SD are plotted. P value was calculated using a nonparametric Wilcoxon 2-sample test. CpG, Cytosine-phosphate-Guanine; SD, standard deviation; TNF, tumor necrosis factor.
Figure 2
Figure 2
Inflamed mucosa of IBD cases exhibit TNF hypomethylation. (A) Methylation analysis of the TNF promoter from mucosa of controls (n = 69 samples from 67 donors) and IBD cases (n = 199 samples from 133 donors). (B) IBD cases were stratified according to biopsy inflammation status (uninflamed, n = 112 samples; inflamed, n = 87 samples). (C) IBD cases were stratified according to disease subtype and biopsy inflammation status (CD uninflamed, n = 77 samples; CD inflamed, n = 52 samples; UC uninflamed, n = 34 samples; UC inflamed, n = 34 samples). (D) Methylation analysis of an independent cohort of IBD cases (n = 26 samples from 15 donors) obtained from a separate study site. Data points are average methylation values for individual biopsies. Mean ± SD are plotted. P values were calculated using nonparametric Wilcoxon 2-sample tests (A, B, and D) or a nonparametric Kruskal-Wallis H test (C). CD, Crohn’s disease; IBD, inflammatory bowel disease; SD, standard deviation; TNF, tumor necrosis factor; UC, ulcerative colitis.
Figure 3
Figure 3
Association of TNF hypomethylation with mucosal inflammation. (A) TNF methylation analysis of IBD cases stratified by local mucosal disease activity. Categories: 1, uninflamed biopsies from IBD patients without active disease (n = 44 samples); 2, uninflamed biopsies from IBD patients with active disease (n = 65 samples); 3, inflamed biopsies from IBD patients exhibiting mild or focal inflammation (n = 33 samples); 4, inflamed biopsies from IBD patients exhibiting chronic or acute colitis (n = 27 samples). Data points are average methylation values for individual biopsies. Mean ± SD are plotted. (B) TNF methylation analysis of paired uninflamed and inflamed mucosal samples from individual IBD cases (CD, green lines, n = 36 paired samples; UC, purple lines, n = 22 paired samples). Connecting lines indicate paired samples. P values were calculated using nonparametric Kruskal-Wallis (A) or Wilcoxon matched-pairs signed rank tests (B). CD, Crohn’s disease; IBD, inflammatory bowel disease; SD, standard deviation; TNF, tumor necrosis factor; UC, ulcerative colitis.
Figure 4
Figure 4
Anti-TNF nonresponders have lower levels of TNF methylation than responders. (A and B) TNF methylation analysis of anti-TNF responders and nonresponders in uninflamed (A) or inflamed (B) mucosa (responders, uninflamed, n = 18 samples; nonresponders, uninflamed, n = 14 samples; responders, inflamed, n = 8 samples; nonresponders, inflamed, n = 12 samples). Data points are average methylation values from individual cases. Mean ± SD are plotted. P values were calculated using parametric unpaired t-tests. SD, standard deviation; TNF, tumor necrosis factor.
Figure 5
Figure 5
TNF hypomethylation of IECs is associated with inflammation and increased IEC TNF expression. (A) TNF methylation analysis of FACS isolated IECs obtained from bowel resections of non-IBD (NIBD) controls and inflamed CD cases. Data points are average methylation values from individual cases and controls (NIBD, n = 6 samples; Crohn’s inflamed, n = 5 samples). Mean ± SD are plotted. (B and C) 1-cell stage dnmt1s872 zebrafish mutants and WT siblings expressing TgBAC(tnfa:GFP)pd1028 as an inflammation reporter were injected with transgenic constructs to mosaically express human DNMT1-p2A-RFP specifically in IECs. At 5 days postfertilization (dpf), transverse sections of the intestine were collected and imaged by confocal microscopy. Arrows point to sparsely labeled RFP + cells expressing DNMT1 in dnmt1s872 mutants. Scale bars are 50 μm. (D) Quantification of tnfa:GFP expression in dnmt1s872 mutants (n = 217 [RFP-] and 57 [RFP+] IECs from 10 larvae). Mean ± SD are plotted. (E) Quantification of tnfa:GFP expression in dnmt1s872 mutants from paired RFP- and RFP+ IECs from individual tissue sections (n = 10 larvae). P values were calculated using nonparametric Wilcoxon 2-sample tests (A and D) or a Wilcoxon matched-pairs signed rank test (E). CD, Crohn’s disease; FACS, fluorescence-activated cell sorting; IBD, inflammatory bowel disease; IECs, intestinal epithelial cells; SD, standard deviation; TNF, tumor necrosis factor.
Figure 6
Figure 6
Functional analysis of rare DNMT1 variants in a zebrafish dnmt1 mutant model. (A–E) Live confocal imaging of TgBAC(tnfa:GFP) in 5 dpf dnmt1s872 mutant larvae and WT siblings. 1-cell stage embryos were injected with cRNA encoding WT or variant DNMT1, raised to 5 dpf, imaged, and then genotyped. Dotted line demarcates the anterior intestinal epithelium. Right panels show GFP overlayed with brightfield images. Scale bars are 200 μm. (F) Quantification of tnfa:GFP intensity in the anterior intestinal epithelium from experiments in panels A–E. Mean ± SD are plotted. P values were calculated using 2-way ANOVA. Data points are mean pixel intensity values from individual larvae (n ≥ 8 larvae per group). ANOVA, analysis of variance; GFP, green fluorescent protein; SD, standard deviation.

Update of

References

    1. Jostins L., Ripke S., Weersma R.K., et al. Host-microbe interactions have shaped the genetic architecture of inflammatory bowel disease. Nature. 2012;491:119–124. - PMC - PubMed
    1. Liu J.Z., van Sommeren S., Huang H., et al. Association analyses identify 38 susceptibility loci for inflammatory bowel disease and highlight shared genetic risk across populations. Nat Genet. 2015;47:979–986. - PMC - PubMed
    1. de Lange K.M., Moutsianas L., Lee J.C., et al. Genome-wide association study implicates immune activation of multiple integrin genes in inflammatory bowel disease. Nat Genet. 2017;49:256–261. - PMC - PubMed
    1. Neurath M.F. Cytokines in inflammatory bowel disease. Nat Rev Immunol. 2014;14:329–342. - PubMed
    1. D'Haens G.R., van Deventer S. 25 Years of anti-TNF treatment for inflammatory bowel disease: lessons from the past and a look to the future. Gut. 2021;70:1396–1405. - PubMed

LinkOut - more resources