. 2024 Sep 15;17(9):e70013.
doi: 10.1111/eva.70013. eCollection 2024 Sep.

DNA Methylation Carries Signatures of Sublethal Effects Under Thermal Stress in Loggerhead Sea Turtles

Affiliations

DNA Methylation Carries Signatures of Sublethal Effects Under Thermal Stress in Loggerhead Sea Turtles

Eugenie C Yen et al. Evol Appl. .

Abstract

To date, studies of the impacts of climate warming on individuals and populations have mostly focused on mortality and thermal tolerance. In contrast, much less is known about the consequences of sublethal effects, which are more challenging to detect, particularly in wild species with cryptic life histories. This necessitates the development of molecular tools to identify their signatures. In a split-clutch field experiment, we relocated clutches of wild, nesting loggerhead sea turtles (Caretta caretta) to an in situ hatchery. Eggs were then split into two sub-clutches and incubated under shallow or deep conditions, with those in the shallow treatment experiencing significantly higher temperatures in otherwise natural conditions. Although no difference in hatching success was observed between treatments, hatchlings from the shallow, warmer treatment had different length-mass relationships and were weaker at locomotion tests than their siblings incubated in the deep, cooler treatment. To characterise the molecular signatures of these thermal effects, we performed whole genome bisulfite sequencing on blood samples collected upon emergence. We identified 287 differentially methylated sites between hatchlings from different treatments, including on genes with neurodevelopmental, cytoskeletal, and lipid metabolism functions. Taken together, our results show that higher incubation temperatures induce sublethal effects in hatchlings, which are reflected in their DNA methylation status at identified sites. These sites could be used as biomarkers of thermal stress, especially if they are retained across life stages. Overall, this study suggests that global warming reduces hatchling fitness, which has implications for dispersal capacity and ultimately a population's adaptive potential. Conservation efforts for these endangered species and similar climate-threatened taxa will therefore benefit from strategies for monitoring and mitigating exposure to temperatures that induce sublethal effects.

Keywords: DNA methylation; conservation; epigenetics; global warming; sea turtles; sublethal effects; thermal stress.


Conflict of interest statement

Alice Balard is an Editorial Board member of Evolutionary Applications and a co‐author of this article. To minimise bias, they were excluded from all editorial decision‐making related to the acceptance of this article for publication.

Figures

FIGURE 1
FIGURE 1
Clutch‐level incubation temperature and phenotypes. Deep sub‐clutches are shown in blue and shallow sub‐clutches in orange. ‘***’ indicates a significance level of p < 0.001. (A) Temperature readings (°C) overlapped across all temperature loggers over the full incubation period (n = 16). Shallow sub‐clutches reached higher temperatures than deep sub‐clutches throughout the incubation period, with daily fluctuations visible. (B) Sub‐clutches incubated at the shallow treatment experienced higher mean incubation temperatures (°C) than the deep treatment. (C) Incubation duration (days) was longer in sub‐clutches incubated in the deep treatment than in the shallow treatment. (D) No significant difference in hatching success rate was found between sub‐clutches incubated in deep and shallow treatments. (E) Large and small total clutch sizes exhibited lower hatching success rates compared to intermediate clutch sizes.
FIGURE 2
FIGURE 2
Individual‐level hatchling phenotypes. Hatchlings emerging from deep sub‐clutches are shown in blue and those from shallow sub‐clutches in orange. ‘*’ indicates a significance level of p < 0.05 and ‘***’ indicates a significance level of p < 0.001. (A) Hatchling straight carapace length (SCL, mm) is positively correlated with mass (g), but this allometric link is altered by the depth incubation treatment. (B) Relationship between the time taken to run 50 cm (log(seconds+1)) and the interaction between incubation temperature (°C) and the depth treatment, shown in residuals. The uncorrected version is provided in Figure S1D. (C) Time taken to self‐right (log(seconds+1)) is slower for hatchlings that emerged from sub‐clutches incubated in the shallow treatment. A version split by maternal ID (the random effect) is provided in Figure S1E.
FIGURE 3
FIGURE 3
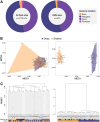
DNA methylation patterns of 40 hatchlings sequenced via WGBS. All plots on the left‐hand side show global methylation (n = 2,733,573 CpG sites) results, and all plots on the right‐hand side show results for DMS (n = 287 CpG sites). (A) Proportions of CpG sites across four genomic feature types. Left: Global CpG sites on gene promoters (1.67%), exons (2.68%), introns (45.55%) and intergenic space (50.1%). Right: DMS, on gene promoters (1.05%), exons (1.74%), introns (123%) and intergenic regions (54.4%). CpG sites were similarly distributed across genomic features between global and DMS categories. (B) NMDS plots with hatchlings coloured by treatment (shallow in orange, deep in blue). Left: Global methylation. Right: DMS. Clear clustering by incubation treatment can be seen in the DMS but not in the global methylation plot. (C) Hierarchical clustering dendrograms, with colour bars underneath the dendrogram representing each hatchling's maternal ID (top bar) and depth treatment (bottom bar, with shallow in orange, deep in blue). Left: Global methylation. Right: DMS. Maternal ID best explains clustering in at the global methylation level, whereas DMS clustered clearly by depth treatment.
FIGURE 4
FIGURE 4
Methylation results in relation to DMS of interest. (A) Manhattan plot of the location of all DMS (n = 287, methylation difference > 10%, q‐value < 0.05) across the genome against methylation difference. A positive value indicates hypermethylation in deep‐incubated hatchlings, whereas a negative value indicates hypermethylation in shallow‐incubated hatchlings. Points are coloured by q‐value, and the 29 DMS of interest (methylation difference > 20%) are labelled. (B) Negative relationship between methylation (%) per hatchling at the DMS on the SEPHS1 gene with straight carapace length (SCL). (C) Interaction by treatment between methylation (%) per hatchling at the DMS on the RALYL gene against SCL. (D) Interaction by treatment at the DMS on the TMEM273 gene against mean run time (log(seconds+1)).
FIGURE 5
FIGURE 5
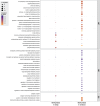
Functional enrichment of GO terms associated with genes with DMS in hatchlings from the incubation treatments. Sites with higher methylation values in hatchlings from the deep treatment are shown on the left, whereas sites with higher methylation values in hatchlings from the shallow treatment are shown on the right. The top panel shows GO terms related to molecular functions (MF), the middle panel shows GO terms related to biological processes (BP), and the bottom panel shows GO terms related to cellular functions (CF). Dot size represents the percentage of genes of a given term enriched in the dataset. The colour scale shows adjusted p‐values.

References

    1. Abdelnour, S. A. , Abd el‐Hack M. E., Khafaga A. F., Arif M., Taha A. E., and Noreldin A. E.. 2019. “Stress Biomarkers and Proteomics Alteration to Thermal Stress in Ruminants: A Review.” Journal of Thermal Biology 79: 120–134. - PubMed
    1. Abella Perez, E. , Marco A., Martins S., and Hawkes L. A.. 2016. “Is This What a Climate Change‐Resilient Population of Marine Turtles Looks Like?” Biological Conservation 193: 124–132.
    1. Adams, D. J. , Barlas B., McIntyre R. E., et al. 2024. “Genetic Determinants of Micronucleus Formation In Vivo.” Nature 627: 130–136. - PMC - PubMed
    1. Aitken, S. N. , Yeaman S., Holliday J. A., Wang T., and Curtis‐McLane S.. 2008. “Adaptation, Migration or Extirpation: Climate Change Outcomes for Tree Populations.” Evolutionary Applications 1: 95–111. - PMC - PubMed
    1. Akalin, A. , Franke V., Vlahoviček K., Mason C. E., and Schübeler D.. 2015. “Genomation: A Toolkit to Summarize, Annotate and Visualize Genomic Intervals.” Bioinformatics 31: 1127–1129. - PubMed

LinkOut - more resources