. 2024 Dec;20(49):e2401717.
doi: 10.1002/smll.202401717. Epub 2024 Sep 17.

Lamellipodia-Mediated Osteoblast Haptotaxis Guided by Fibronectin Ligand Concentrations on a Multiplex Chip

Affiliations

Lamellipodia-Mediated Osteoblast Haptotaxis Guided by Fibronectin Ligand Concentrations on a Multiplex Chip

Chao Liu et al. Small. 2024 Dec.

Abstract

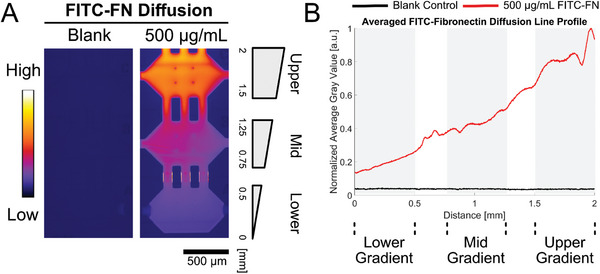
Skull morphogenesis is a complex, dynamic process involving two different germ layers and progressing to the coordinated, directional growth of individual bones. The mechanisms underlying directional growth toward the apex are not completely understood. Here, a microfluidic chip-based approach is utilized to test whether calvarial osteoblast progenitors undergo haptotaxis on a gradient of Fibronectin1 (FN1) via lamellipodia. Mimicking the embryonic cranial mesenchyme's FN1 pattern, FN1 gradients is established in the chip using computer modeling and fluorescent labeling. Primary mouse calvarial osteoblast progenitors are plated in the chip along an array of segmented gradients of adsorbed FN1. The study performs single-cell tracking and measures protrusive activity. Haptotaxis is observed at an intermediate FN1 concentration, with an average directional migration index (yFMI) of 0.07, showing a significant increase compared to the control average yFMI of -0.01. A significant increase in protrusive activity is observed during haptotaxis. Haptotaxis is an Arp2/3-dependent, lamellipodia-mediated process. Calvarial osteoblast progenitors treated with the Arp2/3 (Actin Related Protein 2/3 complex) inhibitor CK666 show significantly diminished haptotaxis, with an average yFMI of 0.01. Together, these results demonstrate haptotaxis on an FN1 gradient as a new mechanism in the apical expansion of calvarial osteoblast progenitors during development and shed light on the etiology of calvarial defects.

Keywords: fibronectin gradient; haptotaxis; lamellipodia; microfluidic; skull morphogenesis.


Conflict of interest statement

The authors declare no conflict of interest.

Figures

Figure 1
Figure 1
Fibronectin1 gradient in mouse embryo cranial region and microfluidic chip for haptotaxis study. A) Immunofluorescence of FN1 was performed on the coronal section of the E13.5 mouse skull, with a yellow region‐of‐interest (ROI) line used to identify the fibronectin gradient in gray scale 16‐bits image. B) The fluorescent intensity line profile along the yellow ROI line was obtained after applying a Gaussian averaging filter. Four different ROI lines locations were chosen (image depicts only one), the averaged line profile (red) is plotted with standard deviation in shaded area (blue). Three biological replicates were conducted to conclude the 2–3‐fold changes in fluorescent intensity of fibronectin antibody staining, with only one depicted in the figure. C) Stitched bright field image of the chip with four food‐dye colors in all channels and chambers. The food dye was used to visually demonstrate the capability of the chip to generate multiple gradients in a high‐throughput manner. The chip dimension is ≈60 mm × 20 mm. Scale bar: 5 mm. Each unit comprises four chambers and a rinse channel. Open and close of the chambers and rinse channel is controlled by push‐down valves, which are placed at the inlet and outlet of each chamber and channel, and between the chambers. Scale bar: 500 µm.
Figure 2
Figure 2
MATLAB model for fibronectin diffusion gradient simulation and FITC‐dextran validation. A) Fibronectin was delivered by perfusion to chamber D as the source and diffuses to other chambers, creating a gradient. Fibronectin in the source chamber was refreshed every 30 min to maintain a constant concentration. B) The concentration changes of fibronectin over the y‐axis were simulated at various time points with source concentration of 100 µg mL−1 (0–48 h). The chip schematic was presented to match the fibronectin concentration gradients to the chip location. The chambers were labeled as upper, mid, and lower gradient chambers (area shaded in gray) to represent their respective gradient location. C) Time‐lapse images of 500 kDa 1000 µg mL−1 FITC‐dextran diffusion at 0, 2, 4, 8, 12, 24, and 48 h. Images were color‐coded: white indicates higher fluorescent intensity, while purple denotes lower intensity. D) Line profiles of FITC‐dextran fluorescent intensity at various time points were plotted. At each time point, 24 line profiles from eight technical replicates were averaged and plotted using custom MATLAB code. Intensities were normalized to the overall maximum. E) Profiles were magnified to evaluate chambers with lower and mid gradient chambers.
Figure 3
Figure 3
Validation of gradient formation through FITC‐fibronectin diffusion. A) Fluorescent images of 500 µg mL−1 FITC‐fibronectin diffusion at 24 h compared with a blank control. Images were color‐coded as previously described. B) The line profiles of averaged fluorescent intensity (red: 500 µg mL−1 FITC‐fibronectin; black: Blank control) across the y‐axis were generated for the lower, mid, and upper gradient chambers (shaded in gray), derived from multiple line profiles and utilizing eight technical replicates.
Figure 4
Figure 4
Calvarial osteoblast progenitor migration and cell morphology in segmented fibronectin gradient compared with controls. A) Track plots (top row) provide visualization of cell migration direction. Cells migrating upward or toward the increasing fibronectin of the gradient are labeled in red, while those moving downward or toward decreasing fibronectin levels of the gradient are labeled in blue. The number of cells migrating upward or downward is annotated in the text. The rose plot (bottom row), resembling a circular histogram, visually depicts the distribution of cell migration angles, with the frequency of migration events in different directions labeled as percentages. B) Primary calvarial osteoblast progenitors exhibit distinct morphologies and sizes in segmented concentration gradients, as revealed by phalloidin staining of actin filaments (Green: Phalloidin; Blue: Hoechst; Scale bar: 100 µm). C) The quantification of percentage of cells migrating upward (toward the upper regions of the fibronectin gradient) or downward (toward the lower regions of the fibronectin gradient). D) Cell area quantification was performed using phalloidin images and compared across groups, including lower, mid, and upper gradient chambers, as well as blank and uniform fibronectin controls. N = 150 for all groups. Cells in the upper gradient chambers were found to be significantly larger in size.
Figure 5
Figure 5
Calvarial osteoblast progenitor haptotactic migration in mid FN1 gradient chamber. A) The forward migration index (yFMI), B) velocity, and C) Euclidean distance were compared across the groups using estimation plots to illustrate the distribution of the entire cell population. The swarmplot displays the underlying distribution, with differences compared to the blank control group plotted for all other groups as bootstrap 95% confidence intervals. Statistical analysis was performed using one‐way ANOVA test with Dunnett's multiple comparison test (p < 0.05 significance threshold). N = 150 for all groups in Figure panel (A–C). D) The number of protrusions in migrating cells was counted for the lower, mid, and upper FN1 gradient condition and compared to blank and uniform fibronectin controls. The mean is indicated with 95% confidence intervals. Statistical analysis was performed using one‐way ANOVA test with Dunnett's multiple comparison test (All groups compared to blank control). N = 28–33 cells in (D).
Figure 6
Figure 6
Effect of small molecules on cell migration and morphology. A) Tracking (top row) and rose plots (bottom row) illustrate changes in directional migration in small molecule groups compared to the haptotaxis control. B) All cell migration analysis in this and subsequent figures is conducted in the Mid FN1 gradient chamber. C) The quantification of percentage of cells migrating upward (toward the fibronectin gradient) or downward (away from the fibronectin gradient). D) Phalloidin‐stained cell areas for the mid fibronectin gradient condition were compared with small molecule groups, including 20 µm CK666, 100 µm CK666, and 50 µm Y27632. N = 80 for all groups. Statistical analyses were performed using a one‐way ANOVA test with Dunnett's multiple comparison test.
Figure 7
Figure 7
Effect of small molecule inhibitors Y27632 (50 µm) and CK666 (20, 100 µm) on cell haptotaxis. A) The forward migration index (yFMI), B) velocity, and C) Euclidean distance were compared among groups using estimation plots, along with the one‐way ANOVA with Dunnett's post hoc test. N = 80 for all groups in Figure panel (A–C). D) Analysis of cell protrusion numbers was conducted using a one‐way ANOVA with Dunnett's post hoc test, comparing all groups against the Mid FN1 gradient control. N = 30–32.

Similar articles

Cited by

References

    1. Flaherty K., Singh N., Richtsmeier J. T., WIREs Dev. Biol. 2016, 5, 429. - PMC - PubMed
    1. Ferguson J. W., Atit R. P., Genes. N. Y. N 2000 2019, 57, 23248. - PMC - PubMed
    1. Yoshida T., Vivatbutsiri P., Morriss‐Kay G., Saga Y., Iseki S., Mech. Dev. 2008, 125, 797. - PubMed
    1. Tran T. H., Jarrell A., Zentner G. E., Welsh A., Brownell I., Scacheri P. C., Atit R., Dev. Camb. Engl. 2010, 137, 3973. - PMC - PubMed
    1. Teng C. S., Ting M., Farmer D. T., Brockop M., Maxson R. E., Crump J. G., eLife 2018, 7, 37024. - PMC - PubMed

Publication types

LinkOut - more resources