. 2024 Sep 17;134(18):e170246.
doi: 10.1172/JCI170246.

ADAMTS12 promotes fibrosis by restructuring extracellular matrix to enable activation of injury-responsive fibroblasts

Affiliations

ADAMTS12 promotes fibrosis by restructuring extracellular matrix to enable activation of injury-responsive fibroblasts

Konrad Hoeft et al. J Clin Invest. .

Abstract

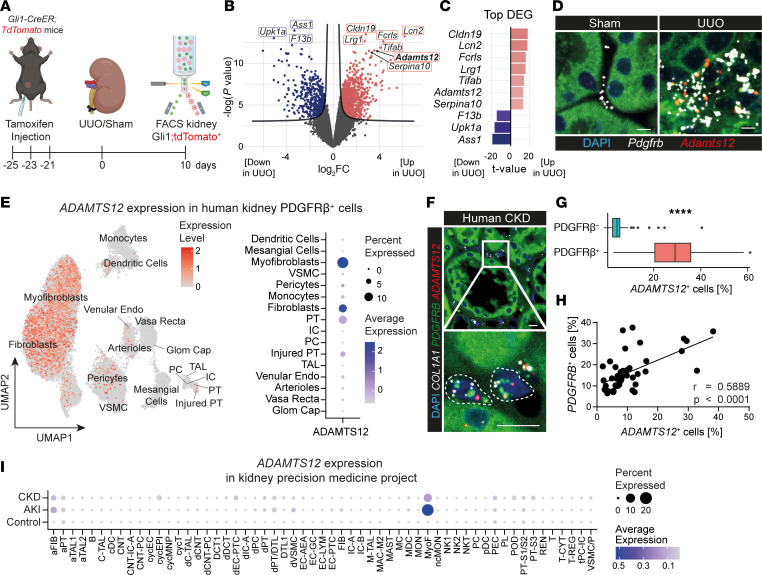
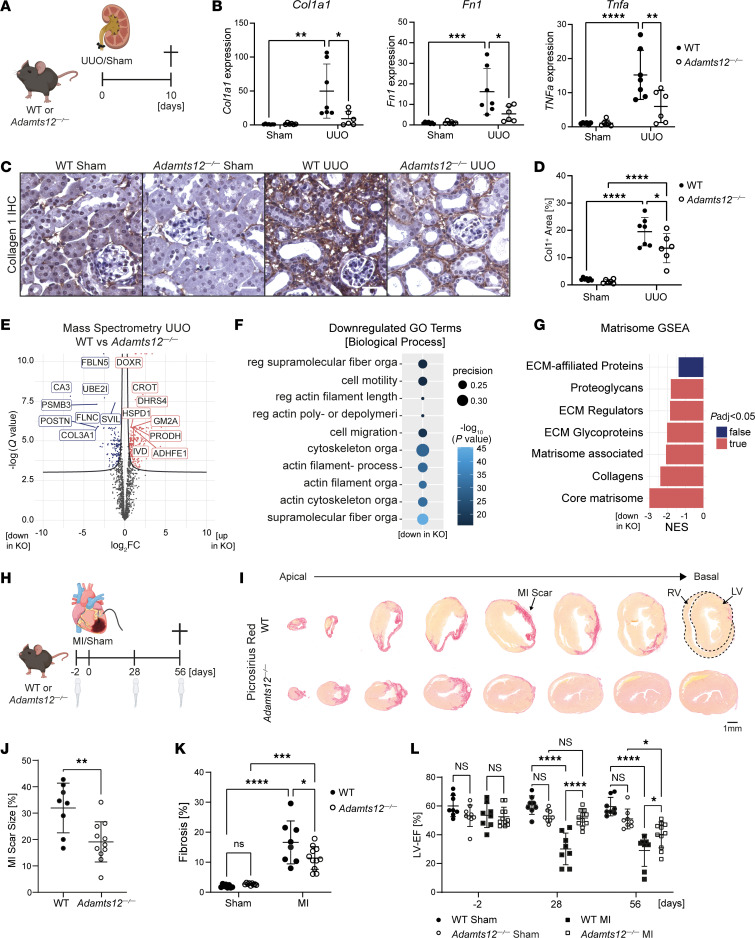
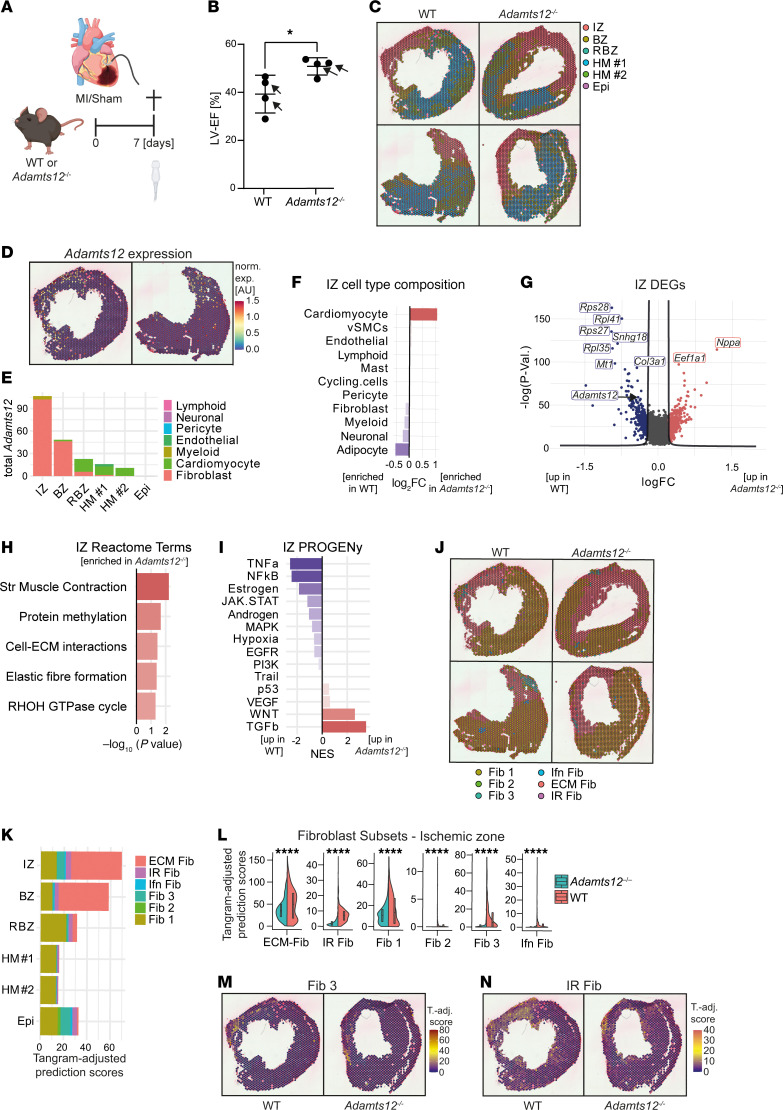
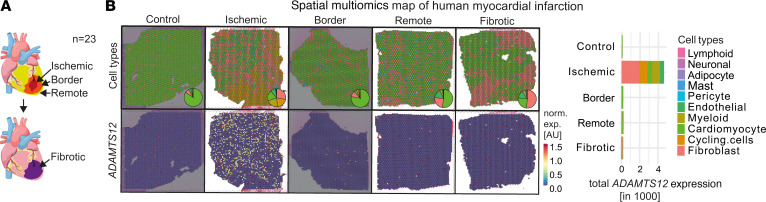
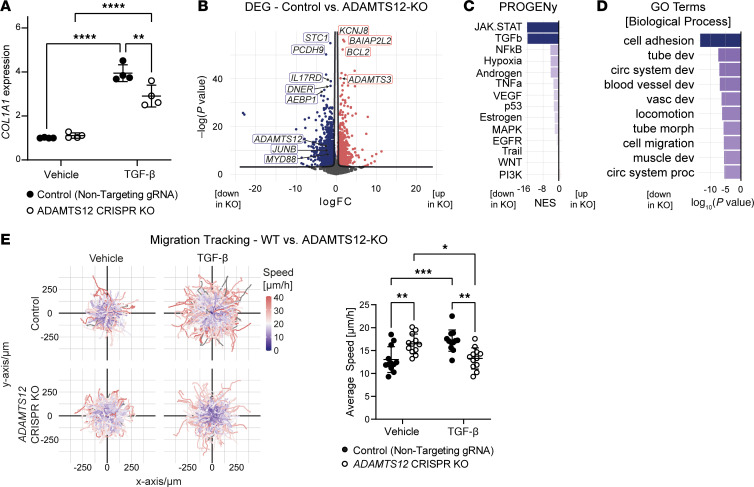
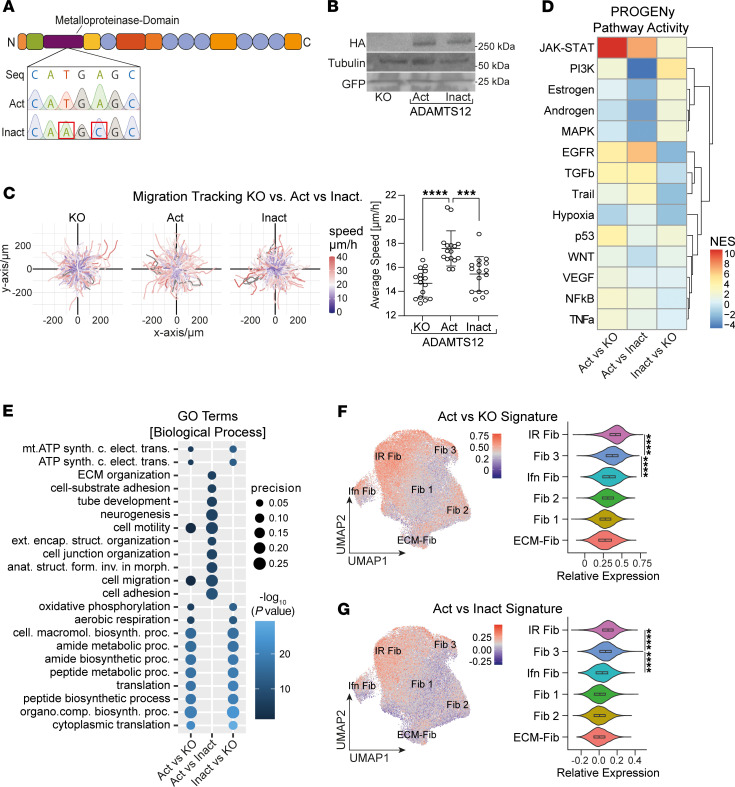
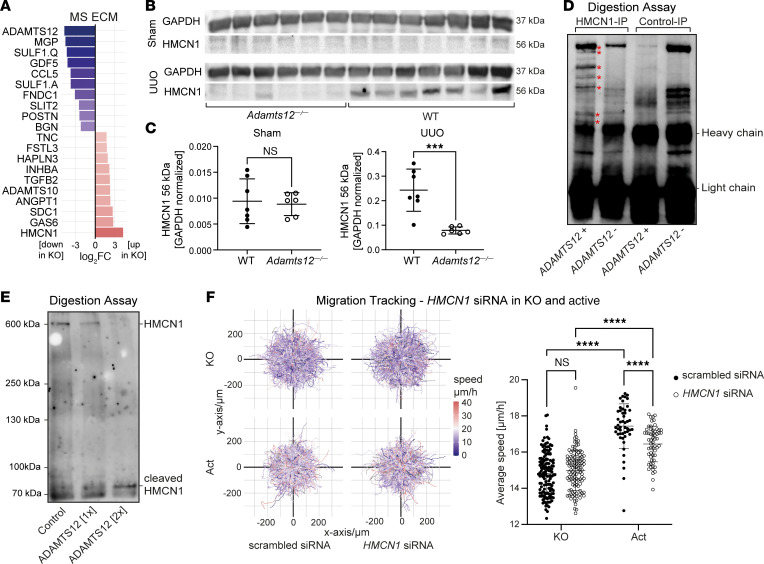
Fibrosis represents the uncontrolled replacement of parenchymal tissue with extracellular matrix (ECM) produced by myofibroblasts. While genetic fate-tracing and single-cell RNA-Seq technologies have helped elucidate fibroblast heterogeneity and ontogeny beyond fibroblast to myofibroblast differentiation, newly identified fibroblast populations remain ill defined, with respect to both the molecular cues driving their differentiation and their subsequent role in fibrosis. Using an unbiased approach, we identified the metalloprotease ADAMTS12 as a fibroblast-specific gene that is strongly upregulated during active fibrogenesis in humans and mice. Functional in vivo KO studies in mice confirmed that Adamts12 was critical during fibrogenesis in both heart and kidney. Mechanistically, using a combination of spatial transcriptomics and expression of catalytically active or inactive ADAMTS12, we demonstrated that the active protease of ADAMTS12 shaped ECM composition and cleaved hemicentin 1 (HMCN1) to enable the activation and migration of a distinct injury-responsive fibroblast subset defined by aberrant high JAK/STAT signaling.

Keywords: Cardiology; Fibrosis; Nephrology.


Figures

Figure 1
Figure 1. Adamts12 is specifically upregulated in fibroblasts after injury.(A)
Experimental design. The schematic drawing was created with BioRender (BioRender.com). (B) Volcano plot of DEGs in kidney Gli1+ cells after UUO versus sham surgery (n = 3 per group). (C) Top up- and downregulated genes, ordered by t value. (D) ISH for Pdgfrb and Adamts12 in murine kidneys 10 days after UUO or sham surgery. Scale bars: 10 μm. (E) Feature and dot plot of ADAMTS12 expression in a published scRNA-Seq dataset of human CKD (2). Labels refer to cell types (Supplemental Table 3). (F) Representative image of ISH stainings of ADAMTS12, COL1A1, and PDGFRB in human kidneys. Scale bars: 10 μm. (G) Quantification of the percentage of ADAMTS12+ cells in PDGFRB+ or PDGFRB cells (n = 43). ****P < 0.0001, by 2-tailed, paired t test. (H) Pearson’s correlation of the percentage of ADAMTS12+ cells with the percentage of PDGFRB+ cells in human nephrectomies. (I) Dot plot of ADAMTS12 gene expression in a scRNA-Seq dataset published by the Kidney Precision Medicine Project (ref. 11). Labels refer to cell types (Supplemental Table 5). Up, upregulated; Down, downregulated.
Figure 2
Figure 2. Genetic loss of Adamts12 ameliorates fibrosis in kidney and heart.
(A) Experimental design for UUO surgery (n = 7 WT, n = 6 Adamts12–/–). (B) RT-qPCR for Col1a1 (PWT UUO vs. Adamts12–/– UUO = 0.0127), Fn1 (PWT UUO vs. Adamts12–/– UUO = 0.0228), and Tnfa (PWT UUO vs. Adamts12–/– UUO=0.0068) in kidneys from WT or Adamts12–/– mice after UUO surgery. (C) Representative images of collagen 1 IHC. Scale bars: 25 μm. (D) Quantification of Col1+ area (in percentage) based on the immunohistochemical stainings shown in C (PWT UUO vs. Adamts12–/– UUO = 0.0398). (E) Volcano plot of differentially expressed proteins in UUO kidneys from WT versus Adamts12–/– mice. log2FC, log2 fold change. (F) Top enriched Biological Process GO terms based on downregulated proteins in Adamts12–/– mice. reg, regulation of; orga,organization; poly- or depolymeri, polymerization or depolymerization; filament-, filament-based. (G) Matrisome GSEA based on MS data on UUO kidneys from WT versus Adamts12–/– mice. Padj, adjusted P value; NES, normalized enrichment score. (H) Experimental design for MI surgery (WT = 8 for each condition, Adamts12–/– sham n = 9, Adamts12–/– MI n = 11). (I) Representative images of Picrosirius red staining in WT and Adamts12–/– mice after MI. Scale bar: 1 μm. RV, right ventricle; LV, left ventricle. (J) Quantification of MI scar size (PWT MI vs. Adamts12—/— MI = 0.0044, unpaired t test). (K) Quantification of fibrosis determined by spectral thresholding analysis of red ECM (PWT MI vs. Adamts12—/— MI = 0.0385). (L) LV-EF measured by Simpson’s method at days –2, 28 (PWT MI vs. Adamts12—/— MI < 0.0001), and 56 (PWT MI vs. Adamts12—/— MI < 0.0166). *P < 0.05, **P < 0.01, ***P < 0.001, and ****P < 0.0001. Unless otherwise specified, all comparisons were performed by 2-way ANOVA with Tukey’s post hoc test. The schematic drawings in A and H were created with BioRender (BioRender.com).
Figure 3
Figure 3. Visium spatial transcriptomics of WT and Adamts12–/– mice after MI.
(A) Experimental design of MI surgeries for Visium spatial transcriptomics. The schematic drawing was created with BioRender (BioRender.com). (B) LV-EF of WT and Adamts12–/– mice 7 days after MI (n = 4 per group). *P < 0.05 (P = 0.037), by unpaired t test. Selected mice for spatial transcriptomics are marked by arrows. (C) Spatial niches in spatial transcriptomic data of WT and Adamts12–/– mice (n = 2 per group). (D) Spatial expression of Adamts12 in WT mice. norm. exp., normalized expression. (E) Total Adamts12 expression stratified by zone and cell type. (F) Bar plot of Tangram prediction scores in IZs of WT versus Adamts12–/– mice after normalization via log2 transformation. (G) DEGs in WT versus Adamts12–/– mice in IZ. (H) Top enriched Reactome pathways in IZs of Adamts12—/— mice based on the DEGs shown in G. Str Muscle Contraction, striated muscle contraction. (I) PROGENy pathway analysis based on the DEGs shown in G. (J) Fibroblast subset prediction scores adjusted for the initially imputed Tangram fibroblast prediction score. Spots show the fibroblast subtype with the highest prediction score. Fib, fibroblast; Ifn Fib, interferon fibroblasts; IR Fib, Atf3+ injury-responsive fibroblasts. (K) Tangram-adjusted fibroblast subset prediction scores stratified by zone. (L) Tangram-adjusted fibroblast subset prediction scores within the IZ stratified by genotype. ****P < 0.0001, by unpaired t test. (M) Spatial FeaturePlot of fibroblast 3 (Fib 3) Tangram-adjusted prediction (T.-adj.) scores in WT sample 1 and Adamts12–/– sample 1. (N) Spatial FeaturePlot of IR fibroblast (IR Fib) Tangram-adjusted prediction scores in WT sample 1 and Adamts12–/– sample 1.
Figure 4
Figure 4. ADAMTS12 expression in spatial multiomics map of human MI.
(A) Previously published dataset of human MI with schematic of spatial niche definition. Schematic drawing was created with BioRender.com. (B) Cell-type distribution and ADAMTS12 expression in representative images of each zone. Total ADAMTS12 expression stratified by zone and predicted cell type.
Figure 5
Figure 5. CRISPR/Cas9 KO of ADAMTS12 in human PDGFRβ+ cells.
(A) COL1A1 RT-qPCR (PNTG TGF-β vs. ADAMTS12-KO TGF-β = 0.003) in human PDGFRβ+ kidney cells with either CRISPR/Cas9-induced ADAMTS12-KO or NTG RNA transduction after treatment with TGF-β or vehicle (n = 4 per group). Results were reproduced in 3 independent experiments. (B) Volcano plot of DEGs in WT versus ADAMTS12-KO PDGFRβ+ cells (n = 4 per group). (C) PROGENy pathway analysis of the DEGs shown in B. (D) Top enriched biological process GO terms based on the top downregulated genes in ADAMTS12-KO cells shown in B. (For abbreviations, see Supplemental Table 10.) (E) Trajectory maps of the migration of WT and ADAMTS12-KO PDGFRβ+ cells after treatment with vehicle or TGF-β. Quantification of the average speed per field of view (PNTG TGF-β vs. ADAMTS12-KO TGF-β = 0.0016). Results were reproduced in 3 independent experiments. *P < 0.05, **P < 0.01, ***P < 0.001, and ****P < 0.0001, by 2-way ANOVA with Tukey’s post hoc test.
Figure 6
Figure 6. Rescue of ADAMTS12 KO by overexpression of catalytically active or inactive ADAMTS12.
(A) Sequencing of ADAMTS12 expression plasmids with a WT active (Act) or a mutated inactive (Inact) catalytic domain. Seq, original ADAMTS12 sequence; Act, active catalytic domain; Inact, inactive catalytic domain. (B) Western blot for HA, tubulin, and GFP in ADAMTS12-KO, active or inactive ADAMTS12-expressing PDGFRβ+ cells. (C) Trajectory maps and quantification of the average migration speed of ADAMTS12-KO and active and inactive ADAMTS12-expressing PDGFRβ+ cells (n = 16 per group, pKO vs. Act< 0.0001, PAct vs. Inact = 0.0002, by ordinary 1-way ANOVA). Results were reproducible in 3 independent experiments. (D) PROGENy pathway analysis based on the DEGs shown in Supplemental Figure 6, G–I. ActvsKO, catalytically active ADAMTS12 expression versus ADAMTS12-KO; ActvsInact, catalytically active versus inactive ADAMTS12 expression; InactvsKO, catalytically inactive ADAMTS12 expression versus ADAMTS12-KO. (E) Top enriched biological process GO terms based on the top upregulated genes shown in Supplemental Figure 6, G–I. Comparisons are described in D (for abbreviations, see Supplemental Table 14). (F) ADAMTS12 active versus KO signature (Act vs. KO) in a scRNA-Seq framework of murine cardiac fibroblasts in heart failure. (G) ADAMTS12 active versus inactive signature (Act vs. Inact) in the above dataset. ***P < 0.001 and ****P < 0.0001. For C, F, and G, a 1-way ANOVA with Tukey’s post hoc test was performed.
Figure 7
Figure 7. HMCN1 is a substrate of ADAMTS12 that facilitates ADAMTS12-induced migration.
(A) log2FC of the top up- and downregulated proteins in ECM of WT versus ADAMTS12-KO PDGFRβ+ cells (n = 3 per group). (B) Western blot of lower-weight HMCN1 peptides (56 kDa) in kidneys from WT and Adamts12–/– mice after sham or UUO surgery (Adamts12–/– n = 6, WT n = 7). (C) Quantification of band density via a 2-tailed unpaired t test. (D) Digestion of HMCN1 or control IP lysates with ADAMTS12 or vehicle and subsequent detection of HMCN1 via Western blotting. (E) Digestion of supernatant from HMCN1-expressing RPE cells with vehicle or 2 concentrations of ADAMTS12 (1× = 90 ng, 2× = 180 ng). Detection of HMCN1 by Western blotting. (F) Trajectory maps of the migration of ADAMTS12-KO and active ADAMTS12-overexpressing PDGFRβ+ cells treated with scrambled or HMCN1 siRNA. Quantification of the average speed per field of view (KO/scrambled siRNA n = 136, KO/HMCN1 siRNA n = 112, Act/scrambled siRNA n = 48, Act/HMCN1 siRNA n = 57, PKO scrambled siRNA vs. KO HMCN1 siRNA = 0.69, PAct scrambled siRNA vs. Act HMCN1 siRNA<0.0001, by 2-way ANOVA with Tukey’s post hoc test). ***P < 0.001 and ****P < 0.0001.

Comment in

  • Fibrosis uncovered: ADAMTS12 cuts to the core of extracellular matrix drama

References

    1. Henderson NC, et al. Fibrosis: from mechanisms to medicines. Nature. 2020;587(7835):555–566. doi: 10.1038/s41586-020-2938-9. - DOI - PMC - PubMed
    1. Kuppe C, et al. Decoding myofibroblast origins in human kidney fibrosis. Nature. 2021;589(7841):281–286. doi: 10.1038/s41586-020-2941-1. - DOI - PMC - PubMed
    1. Peisker F, et al. Mapping the cardiac vascular niche in heart failure. Nat Commun. 2022;13(1):3027. doi: 10.1038/s41467-022-30682-0. - DOI - PMC - PubMed
    1. Forte E, et al. Dynamic interstitial cell response during myocardial infarction predicts resilience to rupture in genetically diverse mice. Cell Rep. 2020;30(9):3149–3163. doi: 10.1016/j.celrep.2020.02.008. - DOI - PMC - PubMed
    1. Kramann R, et al. Perivascular Gli1+ progenitors are key contributors to injury-induced organ fibrosis. Cell Stem Cell. 2015;16(1):51–66. doi: 10.1016/j.stem.2014.11.004. - DOI - PMC - PubMed