. 2024 Sep 17;134(18):e179998.
doi: 10.1172/JCI179998.

BCL2 expression is enriched in advanced prostate cancer with features of lineage plasticity

Affiliations

BCL2 expression is enriched in advanced prostate cancer with features of lineage plasticity

Daniel Westaby et al. J Clin Invest. .

Abstract

The widespread use of potent androgen receptor signaling inhibitors (ARSIs) has led to an increasing emergence of AR-independent castration-resistant prostate cancer (CRPC), typically driven by loss of AR expression, lineage plasticity, and transformation to prostate cancers (PCs) that exhibit phenotypes of neuroendocrine or basal-like cells. The anti-apoptotic protein BCL2 is upregulated in neuroendocrine cancers and may be a therapeutic target for this aggressive PC disease subset. There is an unmet clinical need, therefore, to clinically characterize BCL2 expression in metastatic CRPC (mCRPC), determine its association with AR expression, uncover its mechanisms of regulation, and evaluate BCL2 as a therapeutic target and/or biomarker with clinical utility. Here, using multiple PC biopsy cohorts and models, we demonstrate that BCL2 expression is enriched in AR-negative mCRPC, associating with shorter overall survival and resistance to ARSIs. Moreover, high BCL2 expression associates with lineage plasticity features and neuroendocrine marker positivity. We provide evidence that BCL2 expression is regulated by DNA methylation, associated with epithelial-mesenchymal transition, and increased by the neuronal transcription factor ASCL1. Finally, BCL2 inhibition had antitumor activity in some, but not all, BCL2-positive PC models, highlighting the need for combination strategies to enhance tumor cell apoptosis and enrich response.

Keywords: Apoptosis; Oncology; Prostate cancer.


Figures
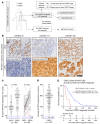
Figure 1
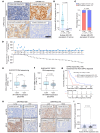
Figure 1. Loss of AR protein expression occurs in a small subset of CRPC and associates with poor prognosis.
(A) Summary of clinical samples analyzed for the ICR/RMH CRPC IHC patient cohort. A total of 187 mCRPC biopsies and 60 matched same-patient CSPC biopsies were analyzed. Clinical outcome data, including OS from CRPC diagnosis and CRPC biopsy date, were collected for all 187 patients. (AD) IHC for nuclear AR-NTD was performed in 187 CRPC biopsies and 60 matched, same-patient CSPC tumors. (B) Representative micrographs for matched, same-patient samples are shown with examples of emergent loss (patient 68) and increased (patient 151) and stable (patient 169) AR-NTD protein expression. Scale bar: 50 μm. HS, H score. (C and D) Nuclear AR-NTD protein expression (H score) in 60 matched, same-patient CSPC and CRPC tumors (C) and 187 CRPC tumors (D). Medians and interquartile ranges (IQRs) are shown. Wilcoxon’s matched-pairs signed-rank test was used to determine statistical significance. Red lines highlight cases of AR-NTD–negative CRPC and their matched CSPC sample. The threshold for AR negativity (H score ≤ 20) is highlighted in blue. A heterogeneous case with 2 tumor cell populations (AR positive and AR negative) is highlighted in orange and included twice. (E) Kaplan-Meier OS curves from time of CRPC diagnosis, split by AR-positive (H score > 20) and AR-negative (H score ≤ 20) tumors. HR with 95% CIs and P value for log-rank test are shown. *The heterogeneous case is included in the AR-NTD–negative group.
Figure 2
Figure 2. BCL2 protein expression is enriched in AR-negative disease and associates with poor prognosis.
(AD) IHC for BCL2 was performed on 47 CRPC biopsies, with preexisting AR-NTD (ICR/RMH CRPC IHC cohort). (A) Representative micrographs are shown. Scale bar: 50 μm. HS, H score. (B) Cytoplasmic BCL2 expression split by AR expression status: AR negative (AR-NTD H score ≤ 20, n = 8) and AR positive (AR-NTD H score > 20, n = 40). Median and IQRs are shown. Mann-Whitney U test was used. (C) Percentage of BCL2-positive (H score > 20) and BCL2-negative (H score ≤ 20) tumors split by AR expression status as above. Fisher’s exact test was used. *The heterogeneous case with 2 tumor cell populations (AR-positive/BCL2-negative and AR-negative/BCL2-positive) is included twice (highlighted orange). (D) H scores for nuclear AR-NTD and cytoplasmic BCL2 expression. (E and F) BCL2 mRNA expression in AR-low (AR mRNA ≤20th percentile) and AR-high (AR mRNA >20th percentile) mCRPC in the SU2C/PCF (n = 210) (E) and SU2C/WCDT (n = 159) (F) cohorts. Medians and IQRs are shown. Mann-Whitney U test was used. (G) Kaplan-Meier survival curves from time of CRPC diagnosis, split by BCL2-positive and BCL2-negative tumors. HR with 95% CIs and P value for log-rank test are shown. *The heterogeneous case is included in the BCL2-positive group. (H and I) AR-NTD and BCL2 IHC was performed on 485 spatially separated samples from 177 mCRPC sites taken at rapid autopsy (58 patients). (H) Representative micrographs with examples of intrapatient inter-metastatic site heterogeneity. Scale bar: 50 μm. (I) Cytoplasmic BCL2 expression (OD) split by AR-negative (OD ≤ 0.013, n = 50) and AR-positive (OD > 0.013, n = 127) tumors. Average OD scores for all samples from each mCRPC tissue were used for this analysis. The threshold for BCL2 negativity (OD ≤ 0.033) is highlighted in blue. Median and IQRs are shown. Mann-Whitney U test was used to determine statistical significance.
Figure 3
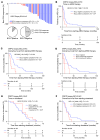
Figure 3. BCL2 positivity associates with resistance to ARSI and poor prognosis in mCRPC irrespective of AR expression status, but there is no difference in response to docetaxel.
(AD) Clinical outcome data, including best PSA response, time on ARSI, and OS from starting ARSI, were collected for 36 patients. (A) Top: Waterfall plot of greatest percentage fall in PSA from baseline for 29 patients treated with either abiraterone or enzalutamide, split by BCL2 negative (blue, n = 21) and BCL2 positive (red, n = 8). *No response. Bottom: Pie charts showing percentage of patients with BCL2-negative and BCL2-positive CRPC that had a ≥50% fall in PSA from baseline. (B and C) Kaplan-Meier curves, split by BCL2-positive (H score > 20) and BCL2-negative (H score ≤ 20) tumors, showing time on ARSI (B) and OS from initiation of ARSI (C). (D) Kaplan-Meier curves, split by BCL2-positive/AR-negative, BCL2-positive/AR-positive, and BCL2-negative, for OS from initiation of ARSI. *The heterogeneous case is included in the BCL2-positive (and BCL2-positive/AR-negative) group. (E and F) Clinical outcome data, including best PSA response, time on docetaxel, number of docetaxel cycles, and OS from starting docetaxel, were collected for 36 patients. Kaplan-Meier curves, split by BCL2-positive (H score > 20) and BCL2-negative (H score ≤ 20) tumors, showing time on docetaxel (E) and OS from initiation of docetaxel (F). HR with 95% CIs and P values for the log-rank test are shown for Kaplan-Meier curves.
Figure 4
Figure 4. BCL2 expression associates with pathways implicated in lineage plasticity and is upregulated by Snail overexpression.
(A and B) Gene set enrichment analysis (GSEA) using the “hallmark molecular signatures” was performed for BCL2 mRNA expression in the ICR/RMH (n = 95) (A) and SU2C/PCF (n = 159) (B) CRPC RNA sequencing cohorts. Volcano plots show the false discovery rate–corrected P values (–log10) against the normalized enrichment score. (C) Western blot showing protein expression of Snail, E-cadherin, BCL2, and vimentin in untreated (day 0) LNCaP-iGFP and LNCaP-iSnail, and cells treated for 5 and 7 days with doxycycline. GAPDH was used as a loading control. The experiment was performed in 2 biological replicates (see Supplemental Figure 10D). (D) Correlation between BCL2 and SNAI1 mRNA expression (left), and between BCL2 and VIM mRNA expression (right), in the ICR/RMH and SU2C/PCF data sets. Spearman’s correlation was used for statistical analysis.
Figure 5
Figure 5. High BCL2 expression associates with neuroendocrine marker positivity.
(A and B) IHC for CD56, chromogranin A (CgA), and synaptophysin (SYP) was undertaken in 26 mCRPC biopsies with preexisting BCL2 and AR IHC. (A) Heatmap depicting protein expression (H score) for AR, BCL2, CD56, CgA, and SYP. (B) Representative IHC micrographs are shown. Scale bar: 50 μm. HS, H score.
Figure 6
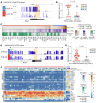
Figure 6. BCL2 expression is regulated by DNA methylation in mCRPC.
(AC) Whole-genome bisulfite sequencing (WGBS) in 36 LuCaP PDXs. (A) WGBS tracks from a BCL2-negative (LuCaP 77, blue) and a BCL2-positive (LuCaP 93, red) tumor. The differentially methylated region (DMR) on the BCL2 promoter is highlighted in orange. (B) Methylation index (0–1) split by BCL2-negative (OD ≤ 0.033, n = 23) and BCL2-positive (OD > 0.033, n = 13) tumors. Colors denote different molecular phenotypes. Mann-Whitney U test was used to determine statistical significance. (C) Heatmap depicting BCL2 protein expression, BCL2 mRNA expression, and methylation index for the LuCaP PDXs. Tumors are organized by molecular phenotype (color bars) and then ordered by BCL2 protein expression. (DF) WGBS in the SU2C/WCDT mCRPC patient cohort (n = 48). (D) WGBS tracks from a BCL2-low (DTB-020, blue) and a BCL2-high (DTB-036, red) tumor. (E) Methylation index (0–1) split by BCL2-low (<90th percentile mRNA expression, n = 43) and BCL2-high (≥90th percentile mRNA expression, n = 5) tumors. Colors denote different molecular phenotypes. Mann-Whitney U test was used to determine statistical significance. (F) Heatmap depicting BCL2 mRNA expression and methylation index in SU2C/WCDT mCRPC cohort. Tumors are grouped by molecular phenotype as determined using the AR, NEURO I, and NEURO II gene expression sets.
Figure 7
Figure 7. BCL2 expression is a transcriptional target of the neuronal lineage-guiding transcription factor ASCL1.
(A) ASCL1 ChIP-Seq tracks in 4 AR-negative/BCL2-positive/NE-positive PC models: 3 LuCaP PDXs and the NCI-H660 cell line. (B) Western blot showing protein expression of full-length AR (AR-FL), ASCL1, and BCL2 in benign prostate (RWPE-1 and PNT2) and PC cell lines. Vinculin and GAPDH were used as a loading control. (C) Western blot showing the impact of ASCL1 knockdown (siRNA, 72 hours, 50 nM) on BCL2 protein expression in NCI-H660 cells. Two biological replicates are shown. Vinculin was used as a loading control.
Figure 8
Figure 8. AR and BCL2 expression in a heterogeneous mCRPC PDX model.
(A) Clinical history for patient 181, whose biopsy was used to generate CP336 PDX. CP336 PDX was developed from a lymph node biopsy containing adenocarcinoma with small-cell neuroendocrine differentiation, from a patient previously treated with agents targeting the AR signaling axis. (B) IHC for BCL2, AR-NTD, and Ki67 was performed on the lymph node biopsy used to develop CP336 PDX, revealing heterogeneous expression with 2 tumor cell populations: AR-negative/BCL2-positive and AR-positive/BCL2-negative. Representative micrographs are shown. Scale bar: 200 μm. (C) CP336-intact was passaged into castrated mice to develop CP336-castrate (CP336c). IHC was performed at different time points. Representative micrographs are shown. Scale bar: 100 μm.
Figure 9
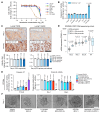
Figure 9. Targeting BCL2 in BCL2-positive PC.
(A) Dose-response curves for PC cell lines treated with venetoclax. Cell viability was compared with vehicle (DMSO) in each cell line and evaluated at 72 hours using the CellTiter-Glo assay (Promega). (B) Caspase-3/7 activity (Caspase Glo-3/7 assay) was measured at 6 hours after treatment with venetoclax (1 μM) and compared with vehicle (DMSO). Experiments were performed in 3 biological replicates, each with 3 technical replicates. SEM is shown. The impact of venetoclax was compared against vehicle (DMSO) for each cell line by unpaired, 2-tailed t test. (C) IHC for cytoplasmic BCL2 and nuclear AR-NTD was performed on LuCaP 70CR and 136CR PDXs. Scale bar: 50 μm. LuCaP 70CR (PDX-O) and 136CR (primary cell culture) were treated with venetoclax (125, 250, and 500 nM and 1 μM) for 96 hours. Viability was determined by CellTiter-Glo 3D assay. Dunnett’s multiple-comparison test was used to determine statistical significance of each concentration versus the vehicle. (D) Transcriptome analyses associating BCL2 mRNA expression (<90th percentile vs. ≥90th percentile) with MCL1, BCLXL, and AR mRNA expression (ICR/RMH CRPC RNA sequencing cohort, n = 95). Medians and IQRs are shown. Mann-Whitney U test was used to determine statistical significance. (E and F) CP336c PDX-organoids (PDX-O) were treated with vehicle (DMSO), venetoclax (1 μM), A-1331852 (100 nM), navitoclax (1 μM), AZD5991 (1 μM), and a combination of AZD5991 (1 μM) and navitoclax (1 μM). (E) The impact on caspase-3/7 activity (6 hours) and organoid viability (24 and 96 hours) was determined by Caspase Glo-3/7 3D and CellTiter-Glo 3D assays, respectively. The experiment was performed in biological triplicate with 5 technical replicates. SEM is shown. Dunnett’s multiple-comparison test was used to determine statistical significance of each drug versus the vehicle. (F) Representative microscopy images of CP336c PDX-O on day 4 after treatment. Scale bar: 50 μm.

References

    1. World Health Organization. Global Cancer Observatory. https://gco.iarc.fr/ Accessed January 13, 2022.
    1. Dyba T, et al. The European cancer burden in 2020: incidence and mortality estimates for 40 countries and 25 major cancers. Eur J Cancer. 2021;157:308–347. doi: 10.1016/j.ejca.2021.07.039. - DOI - PMC - PubMed
    1. Wilding G. The importance of steroid hormones in prostate cancer. Cancer Surv. 1992;14:113–130. - PubMed
    1. Culig Z, Santer FR. Androgen receptor signaling in prostate cancer. Cancer Metastasis Rev. 2014;33(2-3):413–427. doi: 10.1007/s10555-013-9474-0. - DOI - PubMed
    1. Westaby D, et al. A new old target: androgen receptor signaling and advanced prostate cancer. Annu Rev Pharmacol Toxicol. 2021;62:131–153. doi: 10.1146/annurev-pharmtox-052220-015912. - DOI - PubMed

MeSH terms