. 2024 Nov 1;30(21):4887-4899.
doi: 10.1158/1078-0432.CCR-24-1327.

Multiomics Profiling Distinguishes Sebaceous Carcinoma from Benign Sebaceous Neoplasms and Provides Insight into the Genetic Evolution of Sebaceous Carcinogenesis

Affiliations

Multiomics Profiling Distinguishes Sebaceous Carcinoma from Benign Sebaceous Neoplasms and Provides Insight into the Genetic Evolution of Sebaceous Carcinogenesis

Gabriel J Starrett et al. Clin Cancer Res. .

Abstract

Purpose: Sebaceous carcinoma is the third most common nonkeratinocyte skin cancer in the United States with 1,000 cases per year. The clinicopathologic features of sebaceous carcinoma and benign sebaceous neoplasms (adenomas, sebaceomas) can overlap, highlighting the need for molecular biomarkers to improve classification. This study describes the genomic and transcriptomic landscape of sebaceous neoplasms in order to understand tumor etiology and biomarkers relevant for diagnosis and treatment.

Experimental design: We performed whole-genome sequencing (WGS) and whole-transcriptome sequencing (WTS) of sebaceous neoplasms from six academic and two federal healthcare facilities in the United States diagnosed between January 1, 1999, and December 31, 2021.

Results: We evaluated 98 sebaceous neoplasms: 64 tumors (32 adenomas, 2 sebaceomas, 5 atypical sebaceous neoplasms, 25 carcinomas) had sufficient material for WGS, 96 tumors (42 adenomas, 11 sebaceomas, 8 atypical sebaceous neoplasms, 35 carcinomas) had sufficient material for WTS, and 62 tumors (31 adenomas, 2 sebaceomas, 5 atypical sebaceous neoplasms, 24 carcinomas) had sufficient material for combined WGS and WTS. Overall, we found decreased cholesterol biosynthesis and increased TP53 mutations, copy number gains (chromosome 6, 8q, and/or 18), and tumor mutation burden-high (>10 mutations/MB) in carcinomas compared to adenomas. Although diminished compared to adenomas, most carcinomas still had higher cholesterol biosynthesis than nonmalignant skin. Multiomics profiling also supported a precancerous model of tumor evolution with sebaceomas and atypical sebaceous neoplasms being likely intermediate lesions.

Conclusions: The study findings highlight key diagnostic biomarkers for sebaceous carcinoma and suggest that immunotherapy and modulation of cholesterol biosynthesis could be effective treatment strategies.


Conflict of interest statement

Conflict of Interest Disclosure Statement:

The authors declare no potential conflicts of interest.

Figures

Figure 1.
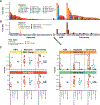
Figure 1.. Transcriptomic characterization of sebaceous neoplasms.
A. Principal component analysis of all transcripts (n=58347) in each tumor specimen colored by histological category. Shape of the points indicate the body region where the tumor was identified. B. Subset of the top significantly enriched pathways from Ingenuity Pathway Analysis from the differentially expressed genes between carcinomas and adenomas. Negative z-scores (blue) are higher in adenomas and positive z-scores (orange) are higher in carcinomas. C. Heatmap of gene expression z-scores related to the cholesterol biosynthesis pathway. D. Violin plots of the variance stabilized expression count from DESeq2 of TGFB-pathway associated genes of carcinomas and adenomas (* q<0.05). E. Violin plots of significantly differentially (* q<0.05) expressed cholesterol synthesis-related nuclear receptor genes between carcinomas and adenomas.
Figure 2.
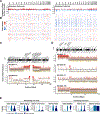
Figure 2.. Mutational processes in sebaceous neoplasms.
A. Barplots of the relative contribution of single base substitution (SBS) signatures to total point mutations for each histological tumor category. B. Barplots of the relative contribution of double base substitution (DBS) signatures. Body regions are indicated by different colored circles. C. Summary of SBS fractions by histological type and body region for SBS1, SBS5, SBS7a, and SBS18 (Mann-Whitney U-test; ** p<0.001, *** p<0.0001).
Figure 3.
Figure 3.. Commonly mutated genes in sebaceous neoplasms.
A. Oncoplot of all point mutations and indels in genes enriched for mutations colored by functional effect. Clinical features per sample are shown at the bottom of the plot. Per sample TMB is shown as a black bar plot above the oncoprint. TMB by diagnosis is summarized in a violin plot adjacent to the bar plot (Mann-Whitney U-test; ** p=0.0011, *** p=0.0001). B. Bar plots of log2 fold ratio of gene mutation frequency between select tumor categories—carcinomas/adenomas, carcinomas of the head and neck (HN)/HN adenomas, periocular carcinomas/extraocular HN carcinomas. Positive changes (more mutations in numerator) are in red and negative changes (more mutations in denominator) are in blue. A pseudofrequency minimum of 0.05 was used to avoid infinite values. C. Bar plots of log2 ratio of gene mutation frequency between immunosuppressed (IS) adenomas and carcinomas versus all adenomas and carcinomas.
Figure 4.
Figure 4.. Structural variants in sebaceous neoplasms.
A. Copy number frequency plots of gains (red) and losses (blue) by histological subtype. B. Individual sample copy number plots. C-D. Examples of co-occurrent deletions and gains within a single sample on chromosomes 1 (C) and 8 (D) resulting in loss-of-heterozygosity and allele frequency changes. Points are colored by allele frequency (zero: goldenrod, 0.4: grey, 1: red). Copy number segments are shown in black lines. E. Violin and barplots showing the frequency of mutational signatures of variants in pseudo-time (early clonal, light blue; late clonal, blue; late subclonal, navy) based on their clonality and occurrence before or after copy number altering events.
Figure 5.
Figure 5.. Cholesterol biosynthesis pathway.
Direction of molecule synthesis is shown with black arrows with the associated gene in rounded rectangles. Genes found to be significantly downregulated in carcinomas versus adenomas are in teal, upregulated in orange, no significant change in gray. FDA approved drugs targeting this pathway from the Drug Gene Interaction Database (https://www.dgidb.org/) are in red text.
Figure 6.
Figure 6.. Model for sebaceous neoplasm evolution.
Summary diagram of important molecular changes involved in the malignant transformation of sebaceous neoplasms. The asterisk indicates traits in extraocular carcinomas that are not present in periocular carcinomas.

References

    1. Sargen MR, Starrett GJ, Engels EA, Cahoon EK, Tucker MA, Goldstein AM. Sebaceous Carcinoma Epidemiology and Genetics: Emerging Concepts and Clinical Implications for Screening, Prevention, and Treatment. Clin Cancer Res 2021;27(2):389–93 doi 10.1158/1078-0432.CCR-20-2473. - DOI - PMC - PubMed
    1. Sargen MR, Mai ZM, Engels EA, Goldstein AM, Tucker MA, Pfeiffer RM, Cahoon EK. Ambient Ultraviolet Radiation and Sebaceous Carcinoma Incidence in the United States, 2000–2016. JNCI Cancer Spectr 2020;4(2):pkaa020 doi 10.1093/jncics/pkaa020. - DOI - PMC - PubMed
    1. Surveillance, Epidemiology, and End Results Program. Registry Groupings in SEER Data and Statistics. Available from: https://seer.cancer.gov/registries/terms.html
    1. Siegel RL, Miller KD, Wagle NS, Jemal A. Cancer statistics, 2023. CA Cancer J Clin 2023;73(1):17–48 doi 10.3322/caac.21763. - DOI - PubMed
    1. Paulson KG, Park SY, Vandeven NA, Lachance K, Thomas H, Chapuis AG, et al. Merkel cell carcinoma: Current US incidence and projected increases based on changing demographics. J Am Acad Dermatol 2018;78(3):457–63 e2 doi 10.1016/j.jaad.2017.10.028. - DOI - PMC - PubMed

MeSH terms

Substances