

Comparative assessment and QA measurement array validation of Monte Carlo and Collapsed Cone dose algorithms for small fields and clinical treatment plans
- PMID: 39287551
- PMCID: PMC11633799
- DOI: 10.1002/acm2.14522
Comparative assessment and QA measurement array validation of Monte Carlo and Collapsed Cone dose algorithms for small fields and clinical treatment plans
Abstract
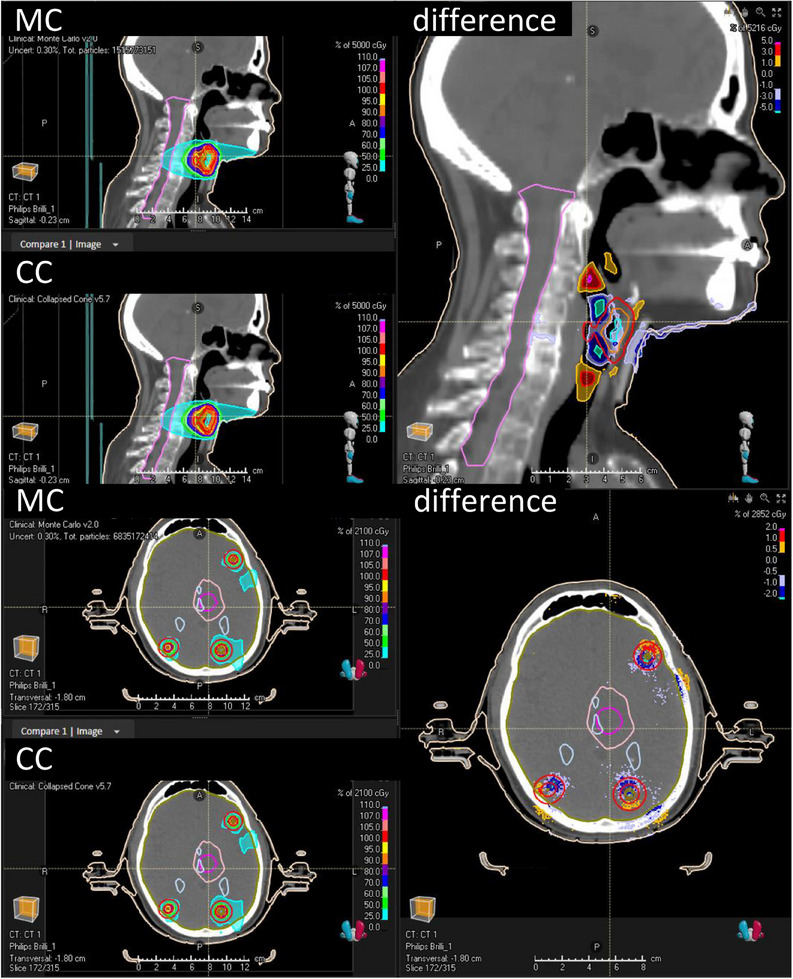
Purpose: Many studies have demonstrated superior performance of Monte Carlo (MC) over type B algorithms in heterogeneous structures. However, even in homogeneous media, MC dose simulations should outperform type B algorithms in situations of electronic disequilibrium, such as small and highly modulated fields. Our study compares MC and Collapsed Cone (CC) dose algorithms in RayStation 12A. Under consideration are 6 MV and 6 MV flattening filter-free (FFF) photon beams, relevant for VMAT plans such as head-and-neck and stereotactic lung treatments with heterogeneities, as well as plans for multiple brain metastases in one isocenter, involving highly modulated small fields. We aim to investigate collimator angle dependence of small fields and performance differences between different combinations of ArcCHECK configuration and dose algorithm.
Methods: Several verification tests were performed, ranging from simple rectangular fields to highly modulated clinical plans. To evaluate and compare the performance of the models, the agreements between calculation and measurement are compared between MC and CC. Measurements include water tank measurements for test fields, ArcCHECK measurements for test fields and VMAT plans, and film dosimetry for small fields.
Results and conclusions: In very small or narrow fields, our measurements reveal a strong dependency of dose output to collimator angle for VersaHD with Agility MLC, reproduced by both dose algorithms. ArcCHECK results highlight a suboptimal agreement between measurements and MC calculations for simple rectangular fields when using inhomogeneous ArcCHECK images. Therefore, we advocate for the use of homogeneous phantom images, particularly for static fields, in ArcCHECK verification with MC. MC might offer performance benefits for more modulated treatment fields. In ArcCHECK results for clinical plans, MC performed comparable to CC for 6 MV. For 6 MV FFF and the preferred homogeneous phantom image, MC resulted in consistently better results (13%-64% lower mean gamma index) compared to CC.
Keywords: ArcCHECK; Collapsed Cone algorithm; Monte Carlo algorithm; small field dosimetry.
© 2024 The Author(s). Journal of Applied Clinical Medical Physics published by Wiley Periodicals LLC on behalf of American Association of Physicists in Medicine.
Conflict of interest statement
The authors declare no conflicts of interest.
Figures


Similar articles
-
Measurement comparison and Monte Carlo analysis for volumetric-modulated arc therapy (VMAT) delivery verification using the ArcCHECK dosimetry system.J Appl Clin Med Phys. 2013 May 6;14(2):3929. doi: 10.1120/jacmp.v14i2.3929. J Appl Clin Med Phys. 2013. PMID: 23470927 Free PMC article.
-
Feasibility of a GATE Monte Carlo platform in a clinical pretreatment QA system for VMAT treatment plans using TrueBeam with an HD120 multileaf collimator.J Appl Clin Med Phys. 2019 Oct;20(10):101-110. doi: 10.1002/acm2.12718. Epub 2019 Sep 23. J Appl Clin Med Phys. 2019. PMID: 31544350 Free PMC article.
-
Influence of dose calculation algorithms on the helical diode array using volumetric-modulated arc therapy for small targets.J Appl Clin Med Phys. 2024 Jul;25(7):e14307. doi: 10.1002/acm2.14307. Epub 2024 Feb 16. J Appl Clin Med Phys. 2024. PMID: 38363044 Free PMC article.
-
Influence of the jaw tracking technique on the dose calculation accuracy of small field VMAT plans.J Appl Clin Med Phys. 2017 Jan;18(1):186-195. doi: 10.1002/acm2.12029. Epub 2017 Jan 3. J Appl Clin Med Phys. 2017. PMID: 28291941 Free PMC article. Review.
-
Monte Carlo Simulations in Nanomedicine: Advancing Cancer Imaging and Therapy.Nanomaterials (Basel). 2025 Jan 15;15(2):117. doi: 10.3390/nano15020117. Nanomaterials (Basel). 2025. PMID: 39852732 Free PMC article. Review.
References
-
- Ahnesjö A. Collapsed cone convolution of radiant energy for photon dose calculation in heterogeneous media. Med Phys. 1989;16(4):577‐592. - PubMed
Publication types
MeSH terms
LinkOut - more resources
Full Text Sources
