. 2024 Nov;20(11):7831-7846.
doi: 10.1002/alz.14245. Epub 2024 Sep 17.

Pilot implementation of the revised criteria for staging of Alzheimer's disease by the Alzheimer's Association Workgroup in a tertiary memory clinic

Collaborators, Affiliations

Pilot implementation of the revised criteria for staging of Alzheimer's disease by the Alzheimer's Association Workgroup in a tertiary memory clinic

Jiaying Lu et al. Alzheimers Dement. 2024 Nov.

Abstract

Introduction: We aimed to evaluate the feasibility of the 2024 Alzheimer's Association Workgroup's integrated clinical-biological staging scheme in outpatient settings within a tertiary memory clinic.

Methods: The 2018 syndromal cognitive staging system, coupled with a binary biomarker classification, was implemented for 236 outpatients with cognitive concerns. The 2024 numeric clinical staging framework, incorporating biomarker staging, was specifically applied to 154 individuals within the Alzheimer's disease (AD) continuum.

Results: The 2024 staging scheme accurately classified 95.5% AD. Among these, 56.5% exhibited concordant clinical and biological stages (canonical), 34.7% demonstrated more advanced clinical stages than biologically expected (susceptible), and 8.8% displayed the inverse pattern (resilient). The susceptible group was characterized by a higher burden of neurodegeneration and inflammation than anticipated from tau, whereas the resilient group showed the opposite.

Discussion: The 2024 staging scheme is generally feasible. A discrepancy between clinical and biological stages is relatively frequent among symptomatic patients with AD.

Highlights: The 2024 AA staging scheme is generally feasible in a tertiary memory clinic. A discrepancy between clinical and biological stages is relatively frequent in AD. The mismatch may be influenced by a non-specific pathological process involved in AD. Individual profiles like aging and lifestyles may contribute to such a mismatch. Matched and mismatched cases converge toward similar clinical outcomes.

Keywords: Alzheimer's disease; amyloid; clinical‐biological staging scheme; inflammation; neurodegeneration; positron emission tomography; tau.


Conflict of interest statement

Tzu‐Chen Yen is an employee of APRINOIA Therapeutics Co., Ltd. (Suzhou, China). All other authors have no conflicts of interest to declare. Author disclosures are available in the supporting information.

Figures

FIGURE 1
FIGURE 1
Study flowchart. A ± , amyloid‐PET positivity/negativity as determined by visual assessment; CU, cognitively unimpaired; MCI, mild cognitive impairment.
FIGURE 2
FIGURE 2
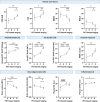
Clinical severity and pathological burden differences among PET‐based staging groups within AD continuum. This analysis included 147 subjects within the AD continuum who were classified according to the revised staging scheme, excluding seven subjects deemed MTL‐sparing. The comparison of global amyloid‐PET SUVR values was based on 121 subjects who had undergone 18F‐Florbetapir amyloid‐PET, while subjects who were imaged using other radioligands were not included. Plasma levels of NfL and GFAP were available for 89 and 73 subjects, respectively. A total of 146 subjects had WMH volume data. Statistical comparisons were performed using generalized linear models, adjusting for age at baseline, sex, and education as covariates. To account for multiple testing, pairwise comparisons were adjusted using the Benjamini–Hochberg correction method with a false discovery rate set at 0.05. ***post hoc p < 0.001; **post hoc p < 0.01; *post hoc p < 0.05. CDR‐SoB, Clinical Dementia Rating Sum of Boxes; FAQ, Functional Activities Questionnaire; GFAP, glial fibrillary acidic protein; MMSE, Mini–Mental State Examination; MoCA, Montreal Cognitive Assessment; MTL, medial temporal lobe; NfL, neurofilament light chain; PET, positron emission tomography; SUVR, standardized uptake value ratio; WMH, white matter hyperintensity.
FIGURE 3
FIGURE 3
Proportions and representative subjects of susceptible, canonical, and resilient groups within AD continuum. (A) The proportion of each group was calculated among 147 subjects classified according to the revised staging scheme, excluding seven subjects deemed MTL‐sparing. (B) Representative subjects from susceptible, canonical, and resilient groups exhibiting similar clinical severity but distinct pathological burdens. GFAP concentrations were log‐transformed for visualization. Tau‐PET SUVRs for the MTL in the susceptible, canonical, and resilient individuals were 0.88, 1.74, and 2.33, respectively. Using a positivity cutoff of 1.33, the three patients were classified as T2MTL−, T2MTL+, and T2MTL+, respectively. Similarly, tau‐PET SUVRs for the neocortex in the susceptible, canonical, and resilient individuals were 0.89, 1.60, and 2.05, respectively. Applying a positivity cutoff of 1.15 and a high uptake cutoff of 1.86, the three patients were classified as T2MTL−, T2MOD+, and T2HIGH+, respectively. A, amyloid; APOE, apolipoprotein E; CDR‐SoB, Clinical Dementia Rating Sum of Boxes; FAQ, Functional Activities Questionnaire; GFAP, glial fibrillary acidic protein; I, inflammation; MMSE, Mini–Mental State Examination; MoCA, Montreal Cognitive Assessment; N, neurodegeneration; PET, positron emission tomography; SUVR, standardized uptake value ratio; T2, tau; V, vascular injury.
FIGURE 4
FIGURE 4
Group average SUVR maps of susceptible, canonical, and resilient groups and their longitudinal clinical trajectories. (A) Group average SUVR maps for amyloid‐PET and tau‐PET imaging. The comparison of global amyloid‐PET SUVR values included 41, 69, and 11 subjects from the susceptible, canonical, and resilient groups, respectively, who underwent 18F‐Florbetapir amyloid‐PET imaging. Subjects imaged using other amyloid radioligands were excluded. The comparison of global tau‐PET SUVR values included 51, 83, and 13 subjects from the susceptible, canonical, and resilient groups, respectively, who underwent 18F‐Florzolotau tau‐PET imaging. (B) Longitudinal clinical trajectories were compared between the susceptible and canonical groups, as well as between the resilient and canonical groups, using linear mixed‐effects models. These models accounted for participant‐specific random intercepts and included the following independent variables: interval from baseline, group (matched/mismatched), and group × interval interaction. Sex, age at baseline, education, T2 level (biological stage), and corresponding baseline clinical scores were included as covariates. No adjustment for multiple testing was performed for pairwise comparisons. ++ uncorrected p < 0.01. CDR‐SoB, Clinical Dementia Rating Sum of Boxes; FAQ, Functional Activities Questionnaire; MMSE, Mini–Mental State Examination; MoCA, Montreal Cognitive Assessment; PET, positron emission tomography; SUVR, standardized uptake value ratio.
FIGURE 5
FIGURE 5
Comparison of biological profiles between matched and mismatched groups. Pathological burdens (A) and their corresponding ratios (B) were compared between groups using generalized linear models, adjusting for age at baseline, sex, education, and C level (clinical stage) as covariates. Comparisons were made between the susceptible and canonical groups, as well as between the resilient and canonical groups. To account for multiple testing, pairwise comparisons with the canonical group were adjusted using the Benjamini–Hochberg correction method with a false discovery rate set at 0.05. ***post hoc p < 0.001; **post hoc p < 0.01; *post hoc p < 0.05. The comparison of global amyloid‐PET SUVR values included 69, 41, and 11 subjects from the canonical, susceptible, and resilient groups, respectively, who underwent 18F‐Florbetapir amyloid‐PET imaging. Subjects who were imaged using other radioligands were not included. Plasma concentrations of NfL were available for 49, 34, and six subjects in the canonical, susceptible, and resilient groups, respectively. Plasma GFAP levels were measured in 36, 29, and eight subjects from the canonical, susceptible, and resilient groups, respectively. WMH volume data were unavailable for one subject in the susceptible group. (C) Schematic of proposed relationship between tau burden (T2) and clinical dysfunction (C). GFAP, glial fibrillary acidic protein; MTL, medial temporal lobe; NfL, neurofilament light chain; PET, positron emission tomography; SUVR, standardized uptake value ratio; WMH, white matter hyperintensity.

Similar articles

Cited by

References

    1. Jack CR, Bennett DA, Blennow K, et al. NIA‐AA Research Framework: toward a biological definition of Alzheimer's disease. Alzheimer's Dement. 2018;14:535‐562. - PMC - PubMed
    1. Dubois B, Villain N, Frisoni GB, et al. Clinical diagnosis of Alzheimer's disease: recommendations of the International Working Group. Lancet Neurol. 2021;20:484‐496. - PMC - PubMed
    1. Jack CR, Andrews JS, Beach TG, et al. Revised criteria for diagnosis and staging of Alzheimer's disease: Alzheimer's Association Workgroup. Alzheimers Dement. 2024; 20:5143‐5169. - PMC - PubMed
    1. Therriault J, Schindler SE, Salvadó G, et al. Biomarker‐based staging of Alzheimer disease: rationale and clinical applications. Nat Rev Neurol. 2024;20:232‐244. - PubMed
    1. Ding D, Zhao Q, Guo Q, et al. Prevalence of mild cognitive impairment in an urban community in China: a cross‐sectional analysis of the Shanghai Aging Study. Alzheimer's Dement. 2015;11:300‐309. - PubMed