. 2024 Sep 3;65(11):27.
doi: 10.1167/iovs.65.11.27.

Altered Cell Clusters and Upregulated Aqp1 in Connexin 50 Knockout Lens Epithelium

Affiliations

Altered Cell Clusters and Upregulated Aqp1 in Connexin 50 Knockout Lens Epithelium

Chun-Hong Xia et al. Invest Ophthalmol Vis Sci. .

Abstract

Purpose: To characterize the heterogeneity and cell clusters of postnatal lens epithelial cells (LECs) and to investigate the downstream targets of connexin 50 (Cx50) in the regulation of lens homeostasis and lens growth. To determine differentially expressed genes (DEGs) in the connexin 50 knockout (Cx50KO) lens epithelial cells that shed light on novel mechanism underlying the cataract and small size of the Cx50KO lenses.

Methods: Single-cell RNA sequencing (scRNA-seq) of lens epithelial cells isolated from one-month-old Cx50KO and wild-type (WT) mice were performed. Differentially expressed genes were identified, and selected DEGs were further studied by quantitative real-time PCR (RT-qPCR) analysis and Western blot analysis.

Results: The expression profiles of several thousand genes were identified by scRNA-seq data analysis. In comparison to the WT control, many DEGs were identified in the Cx50KO lens epithelial cells, including growth regulating transcriptional factors and genes encoding water channels. Significantly upregulated aquaporin 1 (Aqp1) gene expression was confirmed by RT-qPCR, and upregulated AQP1 protein expression was confirmed by Western blot analysis and immunostaining both in vivo and in vitro.

Conclusions: Lens epithelial cells exhibit an intrinsic heterogeneity of different cell clusters in regulating lens homeostasis and lens growth. Upregulated Aqp1 in Cx50KO lens epithelial cells suggests that both connexin 50 and AQP1 likely play important roles in regulating water homeostasis in lens epithelial cells.


Conflict of interest statement

Disclosure: C.-H. Xia, None; W. Lin, None; R. Li, None; X. Xing, None; G.J. Shang, None; H. Zhang, None; X. Gong, None

Figures

Figure 1.
Figure 1.
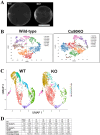
(A) The lens photos of one-month-old Cx50KO (KO) and age-matched C57BL/6J WT show the reduced size and mild cataract in the KO lens. Scale bar: 1 mm. (B) The tSNE plots of scRNA-seq data identify distinct cell clusters among lens epithelial cells of ∼one-month-old WT and Cx50KO mice. Seven cell clusters are identified in 2394 WT cells whereas eight clusters appear in 2463 KO cells. The percentage of cells for each cluster is indicated. (C) UMAP plots of integrated WT and KO scRNA-seq datasets display seven cell clusters, analyzed by Seurat FindClusters and Louvian algorithm (resolution = 0.3). (D) Proportional cell numbers of WT and KO in integrated cell clusters are shown.
Figure 2.
Figure 2.
Heat maps show differentially expressed genes between Cx50KO (KO) and WT lens epithelial cells and among different cell clusters of WT or KO cells. (A) Heat maps show genes (names on X-axis) expressed in each cell clusters (Y-axis) of WT. (B) Heat maps show genes expressed in each cell clusters of Cx50KO lens. (C) Heat maps reveal the topmost differentially expressed genes between KO and WT lens epithelial cells. Several well-characterized lens genes are marked. Grid cells are colored by a gene's Log2 fold change in its cluster row, compared to the other clusters (A, B) or compared between WT and KO (C).
Figure 3.
Figure 3.
Violin plots and quantitative RT-qPCR of connexin genes, aquaporin genes and Lim2. The X-axis indicates the clusters, and the Y-axis is Log2 gene expression in the violin plots. Violin plots display the expression distributions of three lens connexin genes – Gja1 (A), Gja3 (B) and Gja8 (C), three lens aquaporin genes—Mip (D), Aqp1 (E) and Aqp5 (F), and Lim2 (G). The Y-axis displays Log2 gene expression, vertical lines represent maximum expression, the shape of each violin represents all cell results, and the width of each violin represents the frequency of the respective expression level. (A) The violin plots show the expression of Gja1 among cell clusters of both WT and KO cells; the upper left violin plot shows the relative Gja1 expression between WT and KO cells. Quantitative RT-qPCR data is shown in the upper right graph, Gja1 expression is not significantly changed in the KO cells comparing to the WT (P = 0.50, mean ± SD, n = 3, Student's t-test). (B) The violin plots show the expression distributions of Gja3 among clusters of WT and KO cells (the lower plots), between WT and KO cells (the upper left). Quantitative RT-qPCR graph shows no significant change between WT and KO (P = 0.75, mean ± SD, n = 3, Student's t-test). (C) The violin plots of Gja8 show its absence in KO cells. (D) The violin plots display the expression of Mip among cell clusters of WT and KO (the lower plots), between KO and WT (the upper left plot). Quantitative RT-qPCR result (the upper right graph) shows no significant Mip gene expression change between KO and WT (P = 0.24, mean ± SD, n = 3, Student's t-test). (E) The violin plots of Aqp1 reveal its expression mostly in one cell cluster (cluster 1) in the WT cells, but extended to five clusters in the KO cells (the lower plots); the KO cells seem to have more Aqp1 expression comparing to the WT control, RT-qPCR reveals significantly increased Aqp1 expression in the KO cells comparing to the WT (the upper right graph; P = 0.0060, mean ± SD, n = 3, Student's t-test). (F) The violin plots show the expression distribution of Aqp5 among cell clusters of WT and KO (the lower plots), between KO and WT (the upper left plot), RT-qPCR shows no significant change of Aqp5 expression between KO and WT (the upper right graph; P = 0.83, mean ± SD, n = 3, Student's t-test). (G) The violin plots display Lim2 expression distributions among cell clusters of WT and KO (the lower plots), between WT and KO (the upper left panel), and RT-qPCR quantification (the upper right panel) indicates the decreased Lim2 expression in the KO cells is not statistically significant (P = 0.32, mean ± SD, n = 3, Student's t-test).
Figure 4.
Figure 4.
Violin plots and RT-qPCR quantification of Btg1, Btg2, Tob1, Socs3 and Pdpn. The X-axis indicates the clusters, and the Y-axis is Log2 gene expression in the violin plots. (A) The violin plots display Btg1 expression distributions among various cell clusters of WT and KO (the lower plots), between WT and KO (the upper left plot). RT-qPCR result (the upper right graph) reveals the increased Btg1 expression in KO is not statistically significant (P = 0.19; mean ± SD, n = 3, Student's t-test). (B) The violin plots show Btg2 expression among various cell clusters of WT and KO (the lower plots), and between WT and KO (the upper left plots). KO cells show significantly increased Btg2 expression by RT-qPCR (the upper right graph; P = 0.045, mean ± SD, n = 3, Student's t-test). (C) The violin plots show Tob1 expression distributions among cell clusters of WT and KO (the lower plots), and between WT and KO (the upper left panel). RT-qPCR quantification indicates the increased Tob1 expression in KO cells is not statistically significant (the upper right graph, P = 0.17, mean ± SD, n = 3, Student's t-test). (D) The violin plots show the expression distribution of Socs3 among various cell clusters of WT and KO (the lower plots), and between WT and KO (the upper left plot). Quantitative RT-qPCR (the upper right graph) reveals significantly increased Socs3 expression in KO (P = 0.047, mean ± SD, n = 3, Student's t-test). (E) The violin plots show Pdpn expression distributions among various cell clusters of WT and KO (the lower plots), and between WT and KO (the upper left plot). RT-qPCR result (the upper right graph) reveals the decreased Pdpn expression in KO is not statistically significant (P = 0.21, mean ± SD, n = 3, Student's t-test).
Figure 5.
Figure 5.
Western blot analysis reveals increased in vivo AQP1 protein expression. Peeled lens capsule homogenates were prepared from KO or WT mice at three weeks of age. The representative images with molecular mass markers are shown. The Western images show the absence of Cx50 protein expression in the KO samples; the AQP0 and AQP5 expression levels are comparable between Cx50KO and WT control; however, the AQP1 expression level is obviously increased in the KO samples comparing to the WT control. The protein band intensity was quantified and normalized by the β-actin band, the data reveal significantly increased AQP1 protein expression level in the KO (P = 0.016, mean ± SD, n = 3, Student's t-test), whereas AQP0 and AQP5 both show insignificant protein expression changes between KO and WT.
Figure 6.
Figure 6.
Increased AQP1 protein expression in cultured primary lens epithelial cells. (A) Western blot analysis shows increased AQP1 protein in cultured KO lens epithelial cell homogenates compared to the WT. The quantification of band intensity (the lower band) reveals significantly increased AQP1 expression in the KO cells after normalized with β-actin expression (P = 0.004, mean ± SD, n = 3, Student's t-test). (B) AQP1 protein expression is sparsely detected in the WT cells (the upper images), while intense membrane AQP1 staining (green signals, co-stained with DAPI in blue) is seen in clusters of cells. AQP1 staining intensity quantification by ImageJ reveals significantly increased AQP1 expression in the KO compared to the WT (P = 0.004, mean ± SD, n = 3, Student's t-test).
Figure 7.
Figure 7.
Reduced PDPN protein expression in Cx50 knockout lens epithelial cells. (A) Western blot analysis of peeled lens capsule homogenates shows reduced PDPN protein expression in the KO compared to the WT, the molecular mass markers are indicated; the quantification of band intensity reveals significantly decreased PDPN expression in the KO cells after normalized with β-actin expression (P = 0.033, mean ± SD, n = 3, Student's t-test). (B) Western blot of cultured lens epithelial cell homogenates. The PDPN protein expression is significantly reduced in the KO (P < 0.01, mean ± SD, n = 4, Student's t-test). (C) Altered PDPN staining in cultured primary lens epithelial cells of Cx50 knockout. Cells were stained with an anti-PDPN antibody (green signals, co-stained with DAPI in blue). WT cells show PDPN staining signals in the cell membrane; whereas in KO cells, the cell membrane staining of PDPN disappeared, and the staining signals were mainly detected in the cell cytosol. Quantification of the staining intensity also revealed a significant reduction of PDPN expression in the KO cultured cells comparing to the WT contro=l (P = 0.039, mean ± SD, n = 3, Student's t-test).

Similar articles

References

    1. Piatigorsky J. Lens differentiation in vertebrates. A review of cellular and molecular features. Differentiation. 1981; 19: 134–153. - PubMed
    1. Bassnett S, Sikic H.. The lens growth process. Prog Retin Eye Res. 2017; 60: 181–200. - PMC - PubMed
    1. Sikic H, Shi Y, Lubura S, Bassnett S.. A stochastic model of eye lens growth. J Theor Biol. 2015; 376: 15–31. - PMC - PubMed
    1. Sellitto C, Li L, White TW.. Connexin50 is essential for normal postnatal lens cell proliferation. Invest Ophthalmol Vis Sci. 2004; 45: 3196–3202. - PubMed
    1. Sellitto C, Li L, Vaghefi E, Donaldson PJ, Lin RZ, White TW.. The phosphoinosotide 3-kinase catalytic subunit p110alpha is required for normal lens growth. Invest Ophthalmol Vis Sci. 2016; 57: 3145–3151. - PMC - PubMed

LinkOut - more resources