Clinical Trial
. 2024 Sep 17;134(21):e175790.
doi: 10.1172/JCI175790.

Natural TCRs targeting KRASG12V display fine specificity and sensitivity to human solid tumors

Affiliations
Clinical Trial

Natural TCRs targeting KRASG12V display fine specificity and sensitivity to human solid tumors

Adham S Bear et al. J Clin Invest. .

Abstract

BACKGROUNDNeoantigens derived from KRASMUT have been described, but the fine antigen specificity of T cell responses directed against these epitopes is poorly understood. Here, we explore KRASMUT immunogenicity and the properties of 4 T cell receptors (TCRs) specific for KRASG12V restricted to the HLA-A3 superfamily of class I alleles.METHODSA phase 1 clinical vaccine trial targeting KRASMUT was conducted. TCRs targeting KRASG12V restricted to HLA-A*03:01 or HLA-A*11:01 were isolated from vaccinated patients or healthy individuals. A comprehensive analysis of TCR antigen specificity, affinity, crossreactivity, and CD8 coreceptor dependence was performed. TCR lytic activity was evaluated, and target antigen density was determined by quantitative immunopeptidomics.RESULTSVaccination against KRASMUT resulted in the priming of CD8+ and CD4+ T cell responses. KRASG12V -specific natural (not affinity enhanced) TCRs exhibited exquisite specificity to mutated protein with no discernible reactivity against KRASWT. TCR-recognition motifs were determined and used to identify and exclude crossreactivity to noncognate peptides derived from the human proteome. Both HLA-A*03:01 and HLA-A*11:01-restricted TCR-redirected CD8+ T cells exhibited potent lytic activity against KRASG12V cancers, while only HLA-A*11:01-restricted TCR-T CD4+ T cells exhibited antitumor effector functions consistent with partial coreceptor dependence. All KRASG12V-specific TCRs displayed high sensitivity for antigen as demonstrated by their ability to eliminate tumor cell lines expressing low levels of peptide/HLA (4.4 to 242) complexes per cell.CONCLUSIONThis study identifies KRASG12V-specific TCRs with high therapeutic potential for the development of TCR-T cell therapies.TRIAL REGISTRATIONClinicalTrials.gov NCT03592888.FUNDINGAACR SU2C/Lustgarten Foundation, Parker Institute for Cancer Immunotherapy, and NIH.

Keywords: Antigen presentation; Cancer immunotherapy; Immunology; Oncology; T cell receptor.


Figures

Figure 1
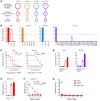
Figure 1. mDC3/8-KRAS vaccination primes KRASMUT-specific T cell immunity in PAAD patients.
(A) Trial design. (B) Consolidated standards of reporting trials diagram. (C) Number of vaccine KRASMUT neoantigens per patient that induced IFN-γ+ T cells in ex vivo–expanded PBMCs collected after vaccine priming. (D) Normalized IFN-γ+ ELISpot counts for vaccine KRASMUT neoantigens after priming detected in ex vivo–expanded PBMCs. Spot counts of the nonstimulated controls were subtracted. Responses to short peptides (HLA-I) are indicated in red, and responses to long peptides (HLA-II) are indicated in blue. Symbol shape indicates specific KRASMUT as per legend. (E) Assessment of subject no. 2 HLA-I–restricted T cell responses against 8–16V (blue) and 7–16V (red) peptides by IFN-γ ELISpot assay following ex vivo expansion of week 2 postvaccine PBMCs. Free peptide supplemented to media bound by HLA-I expressed on donor white blood cells (HLA-A*11:01 and -A*03:01) and presented to responding T cells. Monoallelic K562 cells expressing HLA-A*03:01 (APC-A3) or HLA-A*11:01 (APC-A11) were used to identify HLA-I restriction. WT indicates WT KRAS peptide. MUT indicates mutant KRAS peptide. (F) pHLA multimer analysis to assess CD8+ T cell response against 8–16V/A*11:01 and 7–16V/A*11:01 following in vitro expansion of pre- (week –1) and postvaccine (week 10) CD8+ T cells. Successful priming of CD8+ T cell responses to gp10017–25/A*03:01 and NY-ESO60–72/B*07:02 served as positive vaccination controls. (G) Circos plot analysis following TCR-αβ RNA sequencing of FACS-sorted CD8+/multimer+ (8–16V/A*11:01) cells. Statistical differences between groups calculated using Students’ unpaired t test.
Figure 2
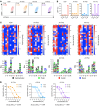
Figure 2. TCRs are specific for KRASG12V and exhibit distinct peptide-binding motifs with crossreactivity to KRASG12C.
(A) FACS profiles of TCR-engineered JASP90_CD8+ cells following 16 hours of coculture with HLA-I –matched K562 cells pulsed with KRASWT (black) or cognate KRASG12V (colored) peptide. (B) Bar graphs representing NFAT activation (specific activity, %) of JASP90_CD8+ cells following 16 hours of coculture with HLA-I–matched K562 cells pulsed with 9-mer and 10-mer KRASWT or KRASG12V peptides. (C) Peptide-binding motifs determined by X-scan analysis of TCR A3V, A11Va, A11Vb, and A11Vc depicted as heatmaps (top) and Seq2Logo plots (bottom) using JASP90_CD8+ reporter cells cocultured with HLA-I–matched K562 cells pulsed with positional peptide scanning library peptides. Heatmaps: specific activity = (GFPExp - GFPMin) / (GFPMax – GFPMin); GFPMin = unstimulated, GFPMax = PMA-I. Seq2Logo plots: height of amino acid at each position corresponds to EGFP expression relative to unstimulated and PMA-I conditions. (D) Cell-reporter assay using TCR-engineered JASP90_CD8+ cocultured with K562A*11:01 cells pulsed with titrated levels of cognate G12V versus G12C peptides. Differences in TCR functional avidities for each peptide are displayed as Δlog10(EC50) values. Data are representative of 2 or more experiments.
Figure 3
Figure 3. Assessment of TCR crossreactivity to the human proteome.
(A) Identification of candidate noncognate peptides derived from the human proteome using ScanProsite. HLA-A*03:01 and HLA-A*11:01 ligands identified using NetMHC4.0. Peptides with predicted EC50 < 500 nM (NetMHC4.0) were synthesized and screened by in vitro functional assays. (B) JASP90_CD8+ reporter assay results screening noncognate peptides against A3V (n = 2) (red), A11Va (n = 5) (orange), A11Vb (n = 2) (blue), and A11Vc (n = 35) (purple). Cognate KRASG12V peptide used as positive control (filled bars). (C) JASP90_CD8+ reporter assay to measure A3V (red) and A11Vc (purple) functional avidity against HTR1E42–51 vs 7–16V and RAB7B12–21 vs 8–16V, respectively, using HLA-I–matched K562 cells pulsed with titrated levels of peptide. EC50 values were determined by nonlinear regression analysis, and differences in TCR functional avidity for crossreactive versus cognate KRASG12V peptide are displayed as Δlog10(EC50) values. (D) JASP90_CD8+ reporter assay to assess A3V and A11Vc reactivity to HLA-I–matched K562 cells alone, endogenously expressing ubiquitinated (Ub) crossreactive protein, or pulsed with crossreactive or cognate KRASG12V peptide (filled bars). (E) JASP90_CD8+ reporter assay to assess A3V reactivity to SY5YA*03:01 cells in media alone or pulsed with HTR1E42–51 or 7–16V peptide. (F) 51Cr-release assay evaluating the cytotoxic activity of primary CD8+ T cells engineered with A3V against SY5YA*03:01 cells alone or pulsed with HTR1E42–51 peptide. (G) 51Cr-release assay evaluating the cytotoxic activity of primary CD8+ T cells engineered with A11Vc against Malme-3M cells alone or pulsed with RAB7B12–21 peptide. Cytotoxicity against cognate KRAS 8–16V peptide (30:1 E:T ratio) shown as positive control. Statistical differences between groups were calculated using 2-way ANOVA followed by post hoc pairwise Student’s t test with multiple-comparison adjustment. *P < 0.05; ****P < 0.0001.
Figure 4
Figure 4. KRASG12V-specific TCRs are of high avidity and exhibit varying degrees of CD8 coreceptor independence.
(A) Cell-reporter assay using TCR-engineered JASP90_CD8+ vs JASP90_CD8 cocultured with HLA-I–matched K562 cells pulsed with titrated levels of cognate 7–16V or 8–16V peptide. Statistical differences between groups calculated using 2-way ANOVA comparing specific activity of JASP90_CD8+ versus JASP90_CD8 at 10–8 M peptide (A3V) or 10–9 M peptide (A11Va-c) followed by post hoc pairwise Student’s t test with multiple-comparison adjustment. ***P < 0.001; ****P < 0.0001. (B) EC50 values of TCR-engineered JASP90_CD8+ (red) and JASP90–CD8 (blue) cells as determined by nonlinear regression analysis of data presented in A. (C) Quantification of NFAT activation (specific activity, %) of TCR-engineered JASP90_CD8+ (upper) and JASP90_CD8+ (lower) cells following coculture with HLA-I–matched (colored) versus unmatched (black) KRASWT (BxPC3) or KRASG12V (CORL23, SW620, YAPC) tumor cell lines. Representative experiments of 2–4 independent evaluations are shown. Statistical differences between groups were calculated using 2-way ANOVA comparing percentages of GFP+ TCR-engineered JASP90_CD8+ or JASP90_CD8 cocultured with HLA-I matched versus unmatched tumor cells followed by post hoc pairwise Student’s t test with multiple-comparison adjustment. *P < 0.05; **P < 0.01; ***P < 0.001; ****P < 0.0001.
Figure 5
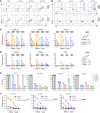
Figure 5. CD4+ T cells redirected with partial CD8 coreceptor–independent TCRs exhibit cytotoxic activity.
(A) FACS plots demonstrating CD3 and TCR-αβ expression by TCR-engineered CD8+ (upper) and CD4+ (lower) T cells (colored) compared with nontransduced TCRnull cells (black). (B) FACS plots demonstrating pHLA multimer binding by TCR-engineered (colored) versus TCRnull (black) CD8+ (upper) and CD4+ (lower) T cells. Staining for A11Va-b is shown using 7–16V/ A11:01 multimer, while staining for A11Vc is shown using 8–16V/A11:01. Cytotoxic activity of TCR-engineered (C) CD8+ and (D) CD4+ T cells against HLA-I–matched (open) versus unmatched (filled) CORL23, SW620, and YAPC cell lines by 4-hour 51Cr-release assay. (E) KT50, defined as time (hours) to achieved 50% cytolysis at a given E:T ratio, of TCR-engineered CD8+ or CD4+ T cells against HLA-I–matched BxPC3, CORL23, SW620, and YAPC cell lines by real-time cell analysis. (F) Cytotoxic activity of primary CD8+ T cells engineered with A11Va, A11Vb, or A11Vc against CORL23 cells expressing HLA-A*11:01WT versus HLA-A*11:01D227A/T228A. Statistical comparisons were performed comparing groups at an E:T ratio of 10:1. Statistical differences between groups were calculated using 2-way ANOVA comparing percentages of GFP+ TCR-engineered JASP90_CD8+ or JASP90_CD8 cocultured with HLA-I–matched versus unmatched tumor cells followed by post hoc pairwise Student’s t test with multiple-comparison adjustment. **P < 0.01; ***P < 0.001; ****P < 0.0001.
Figure 6
Figure 6. TCR-redirected CD8+ T cells exhibit antitumor activity against KRASG12V PAAD PDCs regardless of molecular subtype.
(A) Transcriptomic profiling of PDCs. (B) Cytotoxic activity by 4h 51Cr-release assay of CD8+ T cells engineered with TCRA3V against HLA-matched (closed circles) versus mismatched (open circles) PDCs. (C) Cytotoxic activity by 4-hour 51Cr-release assay of CD8+ T cells engineered with TCRA11Va against HLA-matched (closed circles) versus mismatched (open circles) PDCs. (D) Cytotoxic activity by real-time cell analysis against A*03:01 expressing PDCs by CD8+ T cells expressing TCRA3V versus TCRA11Va. (E) Cytotoxic activity by real-time cell analysis against A*11:01 expressing PDCs by CD8+ T cells expressing TCRA3V versus TCRA11Va. KT50 values of CD8+ T cells expressing (F) TCRA3V or (G) TCRA11Va against HLA-matched PDCs. Statistical significance indicated; 2-way ANOVA followed by post hoc pairwise Student’s t test with multiple-comparison adjustment.

Comment in

  • More T cell receptors to the RAScue in cancer?

References

    1. Tran E, et al. ‘Final common pathway’ of human cancer immunotherapy: targeting random somatic mutations. Nat Immunol. 2017;18(3):255–262. doi: 10.1038/ni.3682. - DOI - PMC - PubMed
    1. Guedan S, et al. Emerging cellular therapies for cancer. Annu Rev Immunol. 2019;37:145–171. doi: 10.1146/annurev-immunol-042718-041407. - DOI - PMC - PubMed
    1. Chapuis AG, et al. T cell receptor gene therapy targeting WT1 prevents acute myeloid leukemia relapse post-transplant. Nat Med. 2019;25(7):1064–1072. doi: 10.1038/s41591-019-0472-9. - DOI - PMC - PubMed
    1. Nagarsheth NB, et al. TCR-engineered T cells targeting E7 for patients with metastatic HPV-associated epithelial cancers. Nat Med. 2021;27(3):419–425. doi: 10.1038/s41591-020-01225-1. - DOI - PMC - PubMed
    1. Robbins PF, et al. A pilot trial using lymphocytes genetically engineered with an NY-ESO-1-reactive T-cell receptor: long-term follow-up and correlates with response. Clin Cancer Res. 2015;21(5):1019–1027. doi: 10.1158/1078-0432.CCR-14-2708. - DOI - PMC - PubMed

Publication types

MeSH terms

Associated data