. 2024 Sep 17;14(12):jkae222.
doi: 10.1093/g3journal/jkae222. Online ahead of print.

A Haplotype-resolved, Chromosome-scale Genome for Malus domestica Borkh. 'WA 38'

Affiliations

A Haplotype-resolved, Chromosome-scale Genome for Malus domestica Borkh. 'WA 38'

Huiting Zhang et al. G3 (Bethesda). .

Abstract

Genome sequencing for agriculturally important Rosaceous crops has made rapid progress both in completeness and annotation quality. Whole genome sequence and annotation gives breeders, researchers, and growers information about cultivar specific traits such as fruit quality and disease resistance, and informs strategies to enhance postharvest storage. Here we present a haplotype-phased, chromosomal level genome of Malus domestica, 'WA 38', a new apple cultivar released to market in 2017 as Cosmic Crisp®. Using both short and long read sequencing data with a k-mer based approach, chromosomes originating from each parent were assembled and segregated. This is the first pome fruit genome fully phased into parental haplotypes in which chromosomes from each parent are identified and separated into their unique, respective haplomes. The two haplome assemblies, 'Honeycrisp' originated HapA and 'Enterprise' originated HapB, are about 650 Megabases each, and both have a BUSCO score of 98.7% complete. A total of 53,028 and 54,235 genes were annotated from HapA and HapB, respectively. Additionally, we provide genome-scale comparisons to 'Gala', 'Honeycrisp', and other relevant cultivars highlighting major differences in genome structure and gene family circumscription. This assembly and annotation was done in collaboration with the American Campus Tree Genomes project that includes 'WA 38' (Washington State University), 'd'Anjou' pear (Auburn University), and many more. To ensure transparency, reproducibility, and applicability for any genome project, our genome assembly and annotation workflow is recorded in detail and shared under a public GitLab repository. All software is containerized, offering a simple implementation of the workflow.

Keywords: Malus domestica ‘WA 38’; Apple genomics; comparative genomics; genome annotation; genome sequence; haplotype-resolved assembly; plant genomics.


Conflict of interest statement

Conflicts of interest The author(s) declare no conflict of interest.

Figures

Fig. 1.
Fig. 1.
‘WA 38’, a cultivar of apple developed by the Washington State University Apple Breeding Program (a cross between ‘Honeycrisp’ and ‘Enterprise’), marketed as Cosmic Crisp®. a) ‘WA 38’ apples ready for harvest on the mother tree, located at the WSU and USDA-ARS Columbia View Research Orchard near Orondo, WA, USA. b) The ‘WA 38’ mother tree. c, d) Green spot, a corking disorder which results in green blemishes on the fruit peel and brown, corky cortex tissue. Symptom severity generally increases during fruit maturation and time in storage, resulting in cullage. e) Natural peel greasiness as a result of more advanced maturity at harvest can interfere with artificial waxes applied in the packinghouse after removal from postharvest storage, creating unappealing, dull spots. f) Green Spot symptoms can begin to appear while fruit is still developing on the tree. Photo Credits: A&B: Heidi Hargarten/USDA-ARS; C&D: Bernardita Sallato/WSU; E: Carolina Torres/WSU; F: Ross Courtney/Good Fruit Grower.
Fig. 2.
Fig. 2.
Schematic chart of the ‘WA 38’ genome project.
Fig. 3.
Fig. 3.
Genome complexity of ‘WA 38’ genome using PacBio long read data (a) and illumina short read (b). The output figures were generated by GenomeScope (k = 21).
Fig. 4.
Fig. 4.
Riparian plot comparing ‘WA 38’ Haplome A and B with ‘Honeycrisp’ Haplome A and B and the ‘Golden Delicious’ (GDDH13) genome by gene rank order.
Fig. 5.
Fig. 5.
Upset plot of shared and unique orthogroups among Malus domestica genomes. Rows in the bottom of the figure are genomes used for the comparison. Columns (categories, x-axis of the bar graph) are annotated with black or gray dots where black is present and gray is absent. The height of the black bars (y-axis of the bar graph) is scaled to match the number of orthogroup in each category, which are also printed above the bars.
Fig. 6.
Fig. 6.
CoRe OrthoGroup (CROG)—Rosaceae gene count clustermap. Each row represents a CROG and each column represents a genomes. Color indicates the number of genes in each cell relative to the row average (z-score). Warmer/Red color indicates more genes. Cooler/Blue color indicates fewer genes. The darker a color, the closer the value is to the row average. Genome and annotation abbreviations can be found in Supplementary Table 1.
Fig. 7.
Fig. 7.
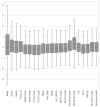
Boxplot summarizing z-score distribution of CROG gene counts in selected pome fruit genomes. Genome and annotation abbreviations can be found in Supplementary Table 1.
Fig. 8.
Fig. 8.
Chloroplast genome map of ‘WA 38’ with annotation. The outer circle shows the locations of genes, colored according to their function and biological pathways as shown in the figure legend. Forward-encoded genes are drawn on the outside of the circle, while reverse-encoded genes are on the inside of the circle. The middle circle shows locations of the four major sections of the chloroplast: LSC (long single copy), SSC (short single copy), IRA (inverted repeat A), and IRB (inverted repeat B). The inner gray circle shows GC content across the chloroplast genome.
Fig. 9.
Fig. 9.
Mitochondrial genome map of ‘WA 38’ with annotation. The outer circle shows the locations of genes, colored according to their function and biological pathways as shown in the figure legend. Forward-encoded genes are drawn on the outside of the circle, while reverse-encoded genes are on the inside of the circle. The inner gray circle shows GC content across the mitochondria genome.

References

    1. Andrews S. 2020. FastQC: a quality control tool for high throughput sequence data. Retrieved November, 2024. [Online]. http://www.bioinformatics.babraham.ac.uk/projects/fastqc/.
    1. Brůna T, Hoff KJ, Lomsadze A, Stanke M, Borodovsky M. 2021. BRAKER2: automatic eukaryotic genome annotation with GeneMark-EP+ and AUGUSTUS supported by a protein database. NAR Genom Bioinform. 3(1):lqaa108. doi:10.1093/nargab/lqaa108. - DOI - PMC - PubMed
    1. Chen X, Li S, Zhang D, Han M, Jin X, Zhao C, Wang S, Xing L, Ma J, Ji J, et al. . 2019. Sequencing of a wild apple (Malus baccata) genome unravels the differences between cultivated and wild apple species regarding disease resistance and cold tolerance. G3 (Bethesda). 9(7):2051–2060. doi:10.1534/g3.119.400245. - DOI - PMC - PubMed
    1. Chen C, Wu Y, Li J, Wang X, Zeng Z, Xu J, Liu Y, Feng J, Chen H, He Y, et al. . 2023. TBtools-II: a “one for all, all for one” bioinformatics platform for biological big-data mining. Mol Plant. 16(11):1733–1742. doi:10.1016/j.molp.2023.09.010. - DOI - PubMed
    1. Chen S, Zhou Y, Chen Y, Gu J. 2018. Fastp: an ultra-fast all-in-one FASTQ preprocessor. Bioinformatics. 34(17):i884–i890. doi:10.1093/bioinformatics/bty560. - DOI - PMC - PubMed

LinkOut - more resources