. 2024 Dec 16;84(24):4214-4232.
doi: 10.1158/0008-5472.CAN-24-0830.

Combined Autophagy Inhibition and Dendritic Cell Recruitment Induces Antitumor Immunity and Enhances Immune Checkpoint Blockade Sensitivity in Pancreatic Cancer

Affiliations

Combined Autophagy Inhibition and Dendritic Cell Recruitment Induces Antitumor Immunity and Enhances Immune Checkpoint Blockade Sensitivity in Pancreatic Cancer

Koki Oyama et al. Cancer Res. .

Abstract

The effect of immune checkpoint inhibitors is extremely limited in patients with pancreatic ductal adenocarcinoma (PDAC) due to the suppressive tumor immune microenvironment. Autophagy, which has been shown to play a role in antitumor immunity, has been proposed as a therapeutic target for PDAC. In this study, single-cell RNA sequencing of autophagy-deficient murine PDAC tumors revealed that autophagy inhibition in cancer cells induced dendritic cell (DC) activation. Analysis of human PDAC tumors substantiated a negative correlation between autophagy and DC activation signatures. Mechanistically, autophagy inhibition increased the intracellular accumulation of tumor antigens, which could activate DCs. Administration of chloroquine, an autophagy inhibitor, in combination with Flt3 ligand-induced DC infiltration inhibited tumor growth and increased tumor-infiltrating T lymphocytes. However, autophagy inhibition in cancer cells also induced CD8+ T-cell exhaustion with high expression of immune checkpoint LAG3. A triple-therapy comprising chloroquine, Flt3 ligand, and an anti-LAG3 antibody markedly reduced tumor growth in orthotopic syngeneic PDAC mouse models. Thus, targeting autophagy in cancer cells and activating DCs sensitize PDAC tumors to immune checkpoint inhibitor therapy, warranting further development of this treatment approach to overcome immunosuppression in pancreatic cancer. Significance: Inhibiting autophagy in pancreatic cancer cells enhances intracellular accumulation of tumor antigens to induce dendritic cell activation and synergizes with immunotherapy to markedly inhibit the growth of pancreatic ductal adenocarcinoma.


Conflict of interest statement

No disclosures were reported.

Figures
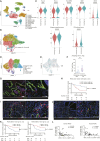
Figure 1.
Figure 1.
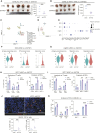
The autophagy level of cancer cells is negatively correlated with the extent of DC activation in patients with PDAC. A, Analysis of a publicly available scRNA-seq dataset generated by Peng and colleagues (CRA001160; ref. 45), which contains data from 24 primary human PDAC tumors and 10 control pancreases. B, The myeloid cluster (C4) was reclustered into nine clusters. Clusters of “0,” “5,” and “8” were identified as DCs. C, The expression levels of gene sets related to DC functions were analyzed in the overall DC cluster. The expression levels of representative genes are shown as violin plots. The “antigen-presenting score” and “IFN-induced score” were calculated for the comparison of the “autophagy-high” and “autophagy-low” groups. D, The T-cell cluster (C3) was reclustered into seven clusters. E, T cells were divided into cells derived from the autophagy-high group (red) and those derived from the autophagy-low group (green). F, The ratio of CD8+ T cells to Tregs (%) in the autophagy-high and autophagy-low groups. G, IF analysis of 39 PDAC patient samples. Autophagy levels in cancer cells were evaluated by staining for LC3AB (red) and CK19 (green). Representative images are shown. H, Kaplan–Meier overall survival analysis of patients with PDAC according to their cancer cell autophagy levels, defined by the ratio of LC3AB+ CK19+ cells to CK19+ cells. I and J, Representative IF images of activated DCs, expressing CD11c (red) and MHC I/II (green). K, Kaplan–Meier overall survival analysis of activated DCs, defined by the ratio of MHC I+ CD11c+ cells to DAPI+ cells from I and MHC II+CD11c+ cells to DAPI+ cells from J. L, Spearman correlation between the autophagy levels of cancer cells (% LC3AB+ CK19+ cells/CK19+ cells) and activated DCs (% MHC I+CD11c+ cells/DAPI+ cells or % MHC II+ CD11c+ cells/DAPI+ cells). Scale bars, 100 μm (G, I, and J). Bars, median; boxplots show a centerline, median; box limits, upper and lower quartiles; whiskers that extend up to 1.5× the IQR beyond the upper and lower quartiles (C). *, P < 0.05; **, P < 0.01; ***, P < 0.001; ****, P < 0.0001; analyzed using the Wilcoxon rank-sum test (C), Student t test (F), and log-rank test (H and K).
Figure 2.
Figure 2.
Orthotopic syngeneic PDAC tumors revealed that the expression of genes associated with DC functions was increased in autophagy-deficient tumors. A and B, KPC1 shNC/shATG7 (A) and KPC1 shNC/shATG5 (B) cells were orthotopically transplanted into C57BL/6 to compare tumor growth. C, scRNA-seq was used to assess the transcriptional dynamics induced by autophagy inhibition in cancer cells. The UMAP technique was used to visualize cell clusters identified within the population of PI CD45+ cells sorted from orthotopic KPC1 shNC/shATG7 syngeneic tumors. D, The DC clusters (C5, C9, and C10) were reclustered into four clusters; cell count: 480 cells. E, Expression of key signature genes used to identify specific DC clusters. F and G, The expression levels of gene sets related to DC function were analyzed in the DC2 (F) and migDC (G) subsets. The following gene sets were selected for the comparison of the two groups of tumors: “antigen-presenting genes,” “IFN-induced genes,” “maturation genes,” “migration genes,” and “regulatory genes”; the gene sets corresponding to each function are listed in dot plots (Supplementary Fig. S3C and S3D). H and I, Tumor-infiltrating T cells and DCs were analyzed by flow cytometry in KPC1 shNC/shATG7 tumors (H) and KPC1 shNC/shATG5 tumors (I). J, IF was used to assess orthotopic syngeneic KPC1 shNC/shATG7 tumors for the presence of activated DCs (red, expressing CD11c; green, MHC II). Representative images are shown. The graph shows the proportions of MHC II+ CD11c+ cells/DAPI+ cells (%) and MHC II+ CD11c+ cells/CD11c+ cells (%). K, KPC1 shNC/shATG7 cells were subcutaneously implanted into BALB/c-nu. DC activation was evaluated by flow cytometry. Scale bars, 100 μm (J). Error bars, mean ± SD; bars, median. Boxplots show a centerline, median; box limits, upper and lower quartiles; whiskers that extend up to 1.5× the IQR beyond the upper and lower quartiles (F and G). *, P < 0.05; **, P < 0.01; ***, P < 0.001; ns, nonsignificant; analyzed using the Wilcoxon rank-sum test (F and G) and Student t test or Mann–Whitney test (A, B, and H–K). pDC, plasmacytoid DC.
Figure 3.
Figure 3.
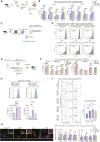
Autophagy-deficient cancer cells induce DC activation and T-cell priming via increased accumulation of intracellular antigens. A, Schematic outline of the coculture assay involving BM-derived DCs and KPC cells. B, Flow cytometry analysis of the expression of the activation and maturation markers, CD80, CD86, MHC I, MHC II on DCs cocultured with KPC1/2 shNC, KPC1/2 + 20 µmol/L CQ, or KPC1/2 shATG5#1, #2 cells. C, Schematic outline of the coculture assay involving DCs and OT-1 cells. D, DCs were pre-cocultured with KPC1 shNC, KPC1 + 20 µmol/L CQ, or KPC1 shATG7#1, #2 cells and then cocultured with OT-1 cells (extracted from the spleen of the OT-1 mouse). Flow cytometry was used to evaluate the proliferation of CFSE-labeled OT-1 cells. E, Schematic outline of the coculture assay involving autologous human PBMC–derived DCs and PDAC cells. F, Flow cytometry analysis of the activation and maturation markers on human DCs cocultured with autologous PDAC cells transfected with siNC; siATG5#1, #2; or siATG7#1, #2. G, KPC1-EGFP and KPC2-EGFP were treated with the autophagy inhibitors CQ (20 µmol/L) or 3-MA (2.0 mmol/L). Flow cytometry was used to assess the changes in EGFP expression. Representative histograms (top) and the corresponding quantification of EGFP expression in KPC1-EGFP and KPC2-EGFP (bottom) are shown. H, KPC1-OVA cells were treated with CQ (20 µmol/L) or 3-MA (2.0 mmol/L). IF analysis was performed to assess the accumulation of intracellular OVA. I, DCs were cocultured with KPC1 cells (no dye), KPC1-dye siNC, KPC1-dye, KPC1-dye + 20 µmol/L CQ, or KPC1-dye siATG7#1, #2. Flow cytometry was used to detect the signal of green dye in DCs to compare the amount of antigen captured by DCs. Representative dot plots are shown. J, Flow cytometry analysis of DCs indirect cocultured with KPC1/2 shNC or KPC1/2 shATG5#1, #2 cells. Error bars, mean ± SD; *, P < 0.05; **, P < 0.01; ***, P < 0.001; ****, P < 0.001; analyzed using one-way ANOVA. FACS, flow cytometry analysis. (A,C, and E, Created with BioRender.com.)
Figure 4.
Figure 4.
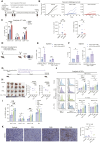
Combination of autophagy inhibition and DC induction synergistically suppresses tumor growth. A, Schematic outline of the in vivo vaccination experiment. B, Individual tumor growth curves and the corresponding quantification (on day 20) of the secondary challenge tumors from mice vaccinated with vehicle, KPC1 shNC, or KPC1 shATG7. C, Flow cytometry analysis of tumor-infiltrating lymphocytes in the secondary challenge tumors. D, Schematic outline of the experimental procedure used to evaluate antigen-specific CD8+ T cells in vivo. E and F, KPC1-OVA shNC or shATG7 tumors were orthotopically transplanted into C57BL/6 mice. Fourteen days later, the spleens were resected and analyzed by flow cytometry; DCs presenting the OVA-derived peptide SIINFEKL and antigen-specific CD8+ T cells bound to the H-2Kb OVA tetramer-SIINFEKL were quantified. The percentages of SIINFEKL-MHC I+ DCs and antigen-specific CD8+ T cells within the total CD45+ cell population were evaluated (E). The percentages of SIINFEKL-MHC I+ DCs/total DCs and antigen-specific CD8+ T cells/total CD8+ T cells were also assessed (F). G, Schematic outline of the treatment experiment used to assess the synergy between CQ and Flt3L in vivo. H–K, KPC1 tumors were orthotopically transplanted into C57BL/6 mice. Tumor-bearing mice were treated with vehicle, CQ (60 mg/kg), Flt3L (10 µg), or CQ + Flt3L. After 28 days of treatment, the tumor volumes and weights were measured (H). Flow cytometry was then used to determine the extent of tumor-infiltrating T-cell (I) and DC activation (J). The mean fluorescence intensities (MFI) of MHC I/II in DCs and the percentage of MHC I/II+ DCs (% of DCs) are shown (J). IHC analysis for CD11c was performed to assess the absolute number of DCs infiltrating in tumors (K). Scale bars, 100 μm (K). Bars, median; Error bars, mean ± SD. *, P < 0.05; **, P < 0.01; ***, P < 0.001; ****, P < 0.001; analyzed using the one-way ANOVA (C and H–J), Student t test or Mann–Whitney test (B, E, F, and K). (A,D, and G, Created with BioRender.com.)
Figure 5.
Figure 5.
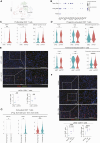
Autophagy inhibition in cancer cells induces exhaustion of tumor-infiltrating CD8+ T cells, characterized by high LAG3 expression. A, scRNA-seq analysis of CD8+ T cells from the immune cell populations shown in Fig. 1A. CD8+ T cells were reclustered into three clusters. B, Expression of key signature genes used to identify the specific CD8+ T-cell clusters. C and D, The expression levels of gene sets related to CD8+ T-cell function was analyzed in the Prolif (C), Prog. Exh, and Term. Exh (D) CD8+ T cells. “Proliferation score,” “effector signature score” (C), and “exhaustion signature score” (D) were calculated using the gene sets listed in Supplementary Table S9. E and F, Representative IF images of orthotopic syngeneic KPC1 shNC/shATG7 tumors (E) and orthotopic syngeneic KPC1 tumors treated with the combination therapy (CQ ± Flt3L; F). Red, CD8a; green, LAG3. Quantification of LAG3+ CD8a+ cells/DAPI+ cells (%) and LAG3+ CD8a+ cells/CD8a+ cells (%) is shown. G, The expression levels of featured genes related to T-cell exhaustion were analyzed in exhausted CD8+ T-cell clusters (“5” and “6” in Fig. 1D) in human PDAC scRNA-seq data. Scale bars, 100 µm (E and F). Bars, median; boxplots show a centerline, median; box limits, upper and lower quartiles; whiskers that extend up to 1.5× the IQR beyond the upper and lower quartiles (C, D, and G). *, P < 0.05; **, P < 0.01; ***, P < 0.001; ****, P < 0.0001; analyzed using the Wilcoxon rank-sum test (C, D, and G), Student t test (E), and one-way ANOVA (F).
Figure 6.
Figure 6.
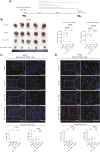
Triple-therapy consisting of CQ, Flt3L, and aLAG3 markedly reduces the growth of orthotopic syngeneic PDAC tumors. A, Schematic outline of the triple treatment protocol involving CQ, Flt3L, and aLAG3. B–D, KPC2 cells were orthotopically transplanted into C57BL/6 mice. Tumor-bearing mice were treated with vehicle, aLAG3 (50 µg), CQ (60 mg/kg) + Flt3L (10 µg), or CQ + Flt3L + aLAG3. After 28 days of treatment, the tumor volumes and weights were measured (B). IF was used to characterize cytotoxic CD8+ T cells as granzyme B+ CD8a+ T cells (red, CD8a; green, granzyme B; C) and perforin+ CD8a+ T cells (red, CD8a; green, perforin; D). Representative images are shown. Quantification of granzyme B+ CD8a+ cells/DAPI+ cells (%) and granzyme B+ CD8a+ cells/CD8a+ cells (%; C); and perforin+ CD8a+ cells/DAPI+ cells (%) and perforin+ CD8a+ cells/CD8a+ cells (%; D) is shown in the bar graphs under the corresponding IF images. Scale bars, 100 µm (C and D). Bars, median; *, P < 0.05; **, P < 0.01; ***, P < 0.001; ****, P < 0.0001; ns, not significant; analyzed using one-way ANOVA (B–D). (A, Created with BioRender.com.)

Similar articles

Cited by

References

    1. Siegel RL, Giaquinto AN, Jemal A. Cancer statistics, 2024. CA Cancer J Clin 2024;74:12–49. - PubMed
    1. Larkin J, Chiarion-Sileni V, Gonzalez R, Grob J-J, Rutkowski P, Lao CD, et al. . Five-year survival with combined nivolumab and ipilimumab in advanced melanoma. N Engl J Med 2019;381:1535–46. - PubMed
    1. Robert C, Schachter J, Long GV, Arance A, Grob JJ, Mortier L, et al. . Pembrolizumab versus ipilimumab in advanced melanoma. N Engl J Med 2015;372:2521–32. - PubMed
    1. Karamitopoulou E. Tumour microenvironment of pancreatic cancer: immune landscape is dictated by molecular and histopathological features. Br J Cancer 2019;121:5–14. - PMC - PubMed
    1. Yarchoan M, Hopkins A, Jaffee EM. Tumor mutational burden and response rate to PD-1 inhibition. N Engl J Med 2017;377:2500–1. - PMC - PubMed

MeSH terms