Randomized Controlled Trial
. 2024 Sep 17;19(9):e0305976.
doi: 10.1371/journal.pone.0305976. eCollection 2024.

Identification of antibody targets associated with lower HIV viral load and viremic control

Affiliations
Randomized Controlled Trial

Identification of antibody targets associated with lower HIV viral load and viremic control

Wendy Grant-McAuley et al. PLoS One. .

Abstract

Background: High HIV viral loads (VL) are associated with increased morbidity, mortality, and on-going transmission. HIV controllers maintain low VLs in the absence of antiretroviral therapy (ART). We previously used a massively multiplexed antibody profiling assay (VirScan) to compare antibody profiles in HIV controllers and persons living with HIV (PWH) who were virally suppressed on ART. In this report, we used VirScan to evaluate whether antibody reactivity to specific HIV targets and broad reactivity across the HIV genome was associated with VL and controller status 1-2 years after infection.

Methods: Samples were obtained from participants who acquired HIV infection in a community-randomized trial in Africa that evaluated an integrated strategy for HIV prevention (HPTN 071 PopART). Controller status was determined using VL and antiretroviral (ARV) drug data obtained at the seroconversion visit and 1 year later. Viremic controllers had VLs <2,000 copies/mL at both visits; non-controllers had VLs >2,000 copies/mL at both visits. Both groups had no ARV drugs detected at either visit. VirScan testing was performed at the second HIV-positive visit (1-2 years after HIV infection).

Results: The study cohort included 13 viremic controllers and 64 non-controllers. We identified ten clusters of homologous peptides that had high levels of antibody reactivity (three in gag, three in env, two in integrase, one in protease, and one in vpu). Reactivity to 43 peptides (eight unique epitopes) in six of these clusters was associated with lower VL; reactivity to six of the eight epitopes was associated with HIV controller status. Higher aggregate antibody reactivity across the eight epitopes (more epitopes targeted, higher mean reactivity across all epitopes) and across the HIV genome was also associated with lower VL and controller status.

Conclusions: We identified HIV antibody targets associated with lower VL and HIV controller status 1-2 years after infection. Robust aggregate responses to these targets and broad antibody reactivity across the HIV genome were also associated with lower VL and controller status. These findings provide novel insights into the relationship between humoral immunity and viral containment that could help inform the design of antibody-based approaches for reducing HIV VL.


Conflict of interest statement

I have read the journal’s policy and the authors of this manuscript have the following competing interests: H.B.L. is an inventor on an issued patent (US20160320406A) filed by Brigham and Women’s Hospital that covers the use of the VirScan technology, is a founder of Infinity Bio, Portal Bioscience and Alchemab, and is an advisor to TScan Therapeutics.

Figures

Fig 1
Fig 1. Study overview.
The figure shows an overview of the assessments in this report. Antibody profiles were first characterized for the study cohort. Antibody responses were then evaluated at the peptide, epitope, and aggregate levels for associations with HIV viral load, and at the epitope and aggregate levels for associations with HIV controller status. Footnotes: 1 This analysis is shown in Fig 2. 2 “Peptide” refers to a single peptide in the VirScan library. This analysis is shown in Fig 3; the peptides associated with HIV viral load are described in S2 Table in S1 File. 3 “Epitope” refers to a common amino acid sequence shared by overlapping peptides. The epitopes associated with HIV viral load are described in Fig 4. 4 This analysis is shown in Fig 5, Panels A-B. 5 This analysis is shown in Fig 5, Panel C. 6 This analysis included the epitopes identified in step 2B and is shown in Fig 6. 7 This analysis is shown in Fig 7, Panels A-C. 8 This analysis is shown in Fig 7, Panel D and included 36 additional participants who were virally suppressed on antiretroviral treatment.
Fig 2
Fig 2. Antibody reactivity to peptides spanning the HIV genome.
The plot shows the mean level of antibody binding to HIV peptides in the VirScan library for all 77 study participants analyzed one to two years after HIV infection. The x-axis shows the nucleotide position relative to genomic coordinates for the HIV HXB2 reference strain (NCBI #NC_001802). The y-axis shows mean antibody binding (log10 fold change); each dot represents the mean antibody binding result for one peptide. The genomic locations of ten peptide clusters with high levels of mean antibody reactivity are indicated by vertical gray lines. Seven of the peptide clusters were identified in a prior study (cluster 1: gag [p17]; cluster 2: gag [p24]; cluster 3: integrase; cluster 4: vpu; clusters 5 and 6: envelope [gp120]; cluster 7: envelope [gp41]) [64]. Three new peptide clusters were identified in this study (cluster a: gag [p7]; cluster b: protease; cluster c: integrase). Abbreviations: Kb: kilobase.
Fig 3
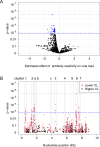
Fig 3. Peptide-level antibody responses and HIV viral load.
The plots show the association between the level of antibody reactivity to HIV peptides and HIV viral load as determined by linear regression. Data are shown for the 77 participants in the study cohort; this analysis included 1,235 HIV peptides that had significant antibody reactivity (adjusted fold change >1) for at least one participant. Panel A: The volcano plot shows the significance of the association between the level of antibody reactivity and viral load. The x-axis shows the estimated effect of antibody reactivity on viral load (estimated effect from the linear regression). Positive values indicate that higher levels of antibody reactivity were associated with higher viral loads; negative values indicate that higher levels of antibody reactivity were associated with lower viral loads. The y-axis shows the -log10 p-value for the association between the level of antibody reactivity and viral load. Each dot represents data for a single peptide; blue dots indicate peptides with a significant association. The blue dashed line indicates the highest q-value <5% (q = 0.0453); this corresponds to a p-value of 0.00158. The dotted blue line indicates the cutoff for significance using the Bonferroni correction (p = 0.05/1,235 = 4.0 x 10⁻⁵). Panel B: The plot shows the same data and significance thresholds visualized across the viral genome. The x-axis shows nucleotide position relative to genomic coordinates for the HIV HXB2 reference strain (NCBI #NC_001802). The y-axis shows the -log10 p-value for the association between antibody reactivity and viral load. Black dots indicate peptides for which higher antibody reactivity was associated with higher viral loads; red dots indicate peptides for which higher antibody reactivity was associated with lower viral loads. The genomic locations of the ten peptide clusters from Fig 2 are indicated by vertical gray lines. Abbreviations: Kb: kilobase; VL: viral load.
Fig 4
Fig 4. HIV antibody epitopes associated with lower HIV viral load.
Fig 5
Fig 5. Aggregate antibody responses and HIV viral load.
The plots show the association between three aggregate measures of HIV antibody reactivity and HIV viral load, as determined by linear regression. Data are shown for the 77 participants in the study cohort. For each panel, each dot represents data for a single participant. The y-axes show the HIV viral load (log10 scale). The blue lines indicate the least squares regression lines. P-values indicate the significance of the associations as determined by linear regression. Grey regions show the 95% confidence bands for the mean antibody response.
Fig 6
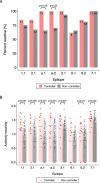
Fig 6. Epitope-level antibody responses in controllers vs. non-controllers.
Antibody reactivity was assessed for the HIV epitopes shown in Fig 4 for two participant groups: controllers (n = 13; red) and non-controllers (n = 64; grey). Panel A: The plot shows the frequency of reactivity to each epitope in each group (reactive: adjusted fold change >1; not reactive: adjusted fold change = 1). P-values show the significance of the association between controller status and the prevalence of reactivity using Fisher’s exact test. Panel B: The plot shows antibody reactivity (log10 fold change) to each epitope; each dot indicates data for one participant. Mean values for each group are indicated by black crossbars. P-values show the significance of the association between controller status and the level antibody reactivity based on Wilcoxon rank-sum test statistics.
Fig 7
Fig 7. Aggregate antibody responses in controllers vs. non-controllers.
Aggregate antibody reactivity was assessed for controllers (n = 13; red) and non-controllers (n = 64; grey). Panel A: Aggregate antibody reactivity was evaluated for the eight HIV epitopes shown in Fig 4. The histogram shows the number of epitopes targeted by participants based on controller status. Data were binned according to the number of epitopes targeted by each study participant. Bar heights indicate frequency. Panel B: The plot shows the number of epitopes targeted based on controller status; each dot indicates the number of epitopes targeted for one study participant. Mean values for each group are indicated by black crossbars. P-values show the significance of the association between controller status and antibody reactivity based on t-statistics. Panel C: The plot shows the mean antibody reactivity (mean log10 fold change) across all selected epitopes based on controller status; each dot indicates mean data for one study participant. Mean values for each group are indicated by black crossbars. P-values show the significance of the association between controller status and antibody reactivity based on t-statistics. Panel D: The VARscore is a composite measure of the overall breadth and strength of antibody reactivity to all peptide targets across a viral genome, as measured by VirScan. The plot shows HIV-1 VARscores for controllers (N = 13, red) and viremic non-controllers (N = 64, grey); this analysis also included a group of non-controllers who were suppressed on antiretroviral therapy within the first year of HIV infection (N = 36, blue; see Methods). Each dot indicates HIV-1 VARscore data for one study participant. Mean values for each group are indicated by black crossbars. P-values show the significance of the association between controller status and HIV-1 VARscore based on t-statistics. Panels E-F: The plots show VARscores for HIV-2 (Panel E) and HSV-2 (Panel F) for controllers (n = 13; red) vs. non-controllers (n = 64, grey). Each dot indicates data for one participant. Mean values for each group are indicated by black crossbars. P-values show the significance of the association between controller status and the VARscore based on t-statistics.

References

    1. Fauci AS, Desrosiers RC. Pathogenesis of HIV and SIV. In: Coffin JM, Hughes SH, Varmus HE, editors. Retroviruses. Cold Spring Harbor (NY)1997. - PubMed
    1. Fiebig EW, Wright DJ, Rawal BD, Garrett PE, Schumacher RT, Peddada L, et al.. Dynamics of HIV viremia and antibody seroconversion in plasma donors: implications for diagnosis and staging of primary HIV infection. AIDS. 2003;17(13):1871–9. doi: 10.1097/00002030-200309050-00005 - DOI - PubMed
    1. Coffin J, Swanstrom R. HIV pathogenesis: dynamics and genetics of viral populations and infected cells. Cold Spring Harb Perspect Med. 2013;3(1):a012526. doi: 10.1101/cshperspect.a012526 - DOI - PMC - PubMed
    1. Ho DD, Neumann AU, Perelson AS, Chen W, Leonard JM, Markowitz M. Rapid turnover of plasma virions and CD4 lymphocytes in HIV-1 infection. Nature. 1995;373(6510):123–6. doi: 10.1038/373123a0 - DOI - PubMed
    1. Perelson AS, Neumann AU, Markowitz M, Leonard JM, Ho DD. HIV-1 dynamics in vivo: virion clearance rate, infected cell life-span, and viral generation time. Science. 1996;271(5255):1582–6. doi: 10.1126/science.271.5255.1582 - DOI - PubMed

Publication types