. 2024 Sep 24;121(39):e2318900121.
doi: 10.1073/pnas.2318900121. Epub 2024 Sep 17.

Atomistic mechanisms of the regulation of small-conductance Ca2+-activated K+ channel (SK2) by PIP2

Affiliations

Atomistic mechanisms of the regulation of small-conductance Ca2+-activated K+ channel (SK2) by PIP2

Ryan L Woltz et al. Proc Natl Acad Sci U S A. .

Abstract

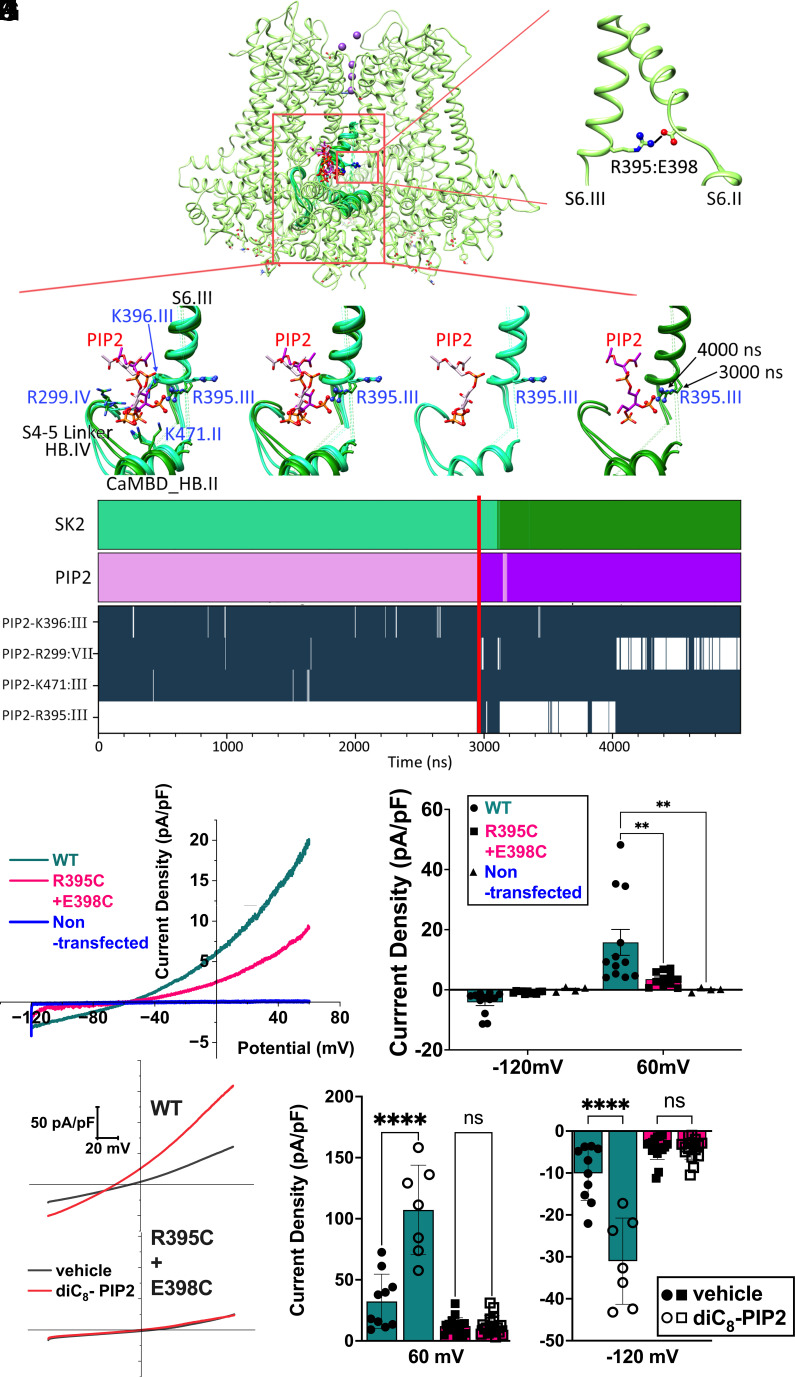
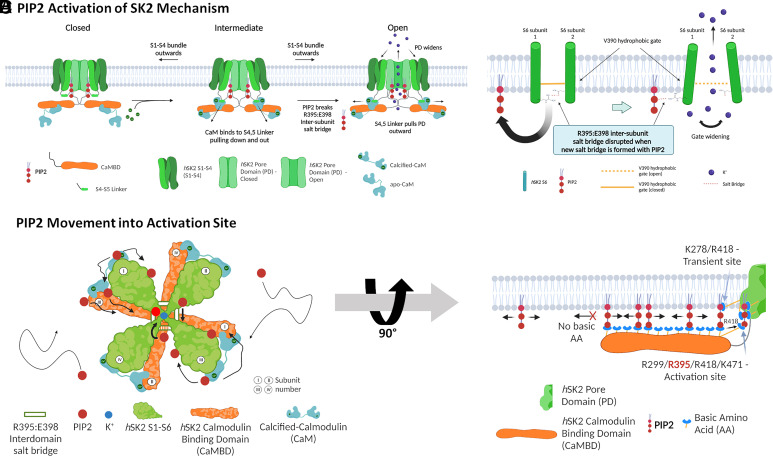
Small-conductance Ca2+-activated K+ channels (SK, KCa2) are gated solely by intracellular microdomain Ca2+. The channel has emerged as a therapeutic target for cardiac arrhythmias. Calmodulin (CaM) interacts with the CaM binding domain (CaMBD) of the SK channels, serving as the obligatory Ca2+ sensor to gate the channels. In heterologous expression systems, phosphatidylinositol 4,5-bisphosphate (PIP2) coordinates with CaM in regulating SK channels. However, the roles and mechanisms of PIP2 in regulating SK channels in cardiomyocytes remain unknown. Here, optogenetics, magnetic nanoparticles, combined with Rosetta structural modeling, and molecular dynamics (MD) simulations revealed the atomistic mechanisms of how PIP2 works in concert with Ca2+-CaM in the SK channel activation. Our computational study affords evidence for the critical role of the amino acid residue R395 in the S6 transmembrane segment, which is localized in propinquity to the intracellular hydrophobic gate. This residue forms a salt bridge with residue E398 in the S6 transmembrane segment from the adjacent subunit. Both R395 and E398 are conserved in all known isoforms of SK channels. Our findings suggest that the binding of PIP2 to R395 residue disrupts the R395:E398 salt bridge, increasing the flexibility of the transmembrane segment S6 and the activation of the channel. Importantly, our findings serve as a platform for testing of structural-based drug designs for therapeutic inhibitors and activators of the SK channel family. The study is timely since inhibitors of SK channels are currently in clinical trials to treat atrial arrhythmias.

Keywords: atrial arrhythmias; calmodulin; optogenetics; phosphatidylinositol 4,5-bisphosphate; small conductance Ca2+-activated K+ channel.


Conflict of interest statement

Competing interests statement:The authors declare no competing interest.

Figures

Fig. 1.
Fig. 1.
Regulation of IK,Ca in cardiomyocytes using optogenetics. (A) Schematic illustrating the dimerization of the CRY2 and CIBN optogenetic constructs at the plasma membrane and dephosphorylation of PIP2 via inositol-5-phosphatase (5P) activity to produce phosphatidylinositol 4-phosphate (PIP). (B) IK,Ca recorded in CHO cells using a voltage-ramp protocol prior to and during blue light exposure (blue arrow in the Left panel and black lines in the Right panel). (C) Current traces and the two-pulse voltage-clamp protocol used to isolate apamin-sensitive current activated by Ca2+ influx through L-type Ca2+ channels (LTCCs). The voltage-clamp protocol uses a prepulse to progressively induce Ca2+ influx via LTCCs from a holding potential of −55 mV, followed by a test pulse to monitor the apamin-sensitive IK,Ca. We recorded Ca2+ current (ICa) for each cell to measure the reversal potential (ECa). The test pulse was stepped to the observed ECa to minimize inward ICa. Specific inhibitors for transient outward K+ current (Ito), rapidly activating (IKr) and slowly activating delayed rectifier K+ currents (IKs), inward rectifier K+ currents (IK1), and Cl currents were applied. The instantaneous outward K+ currents progressively increased depending on the Ca2+ influx. (D) Rabbit ventricular myocytes were transfected with optogenetic constructs containing inositol-5-phosphatase (5P, Left panel) compared to control (inactive phosphatase, 5P-Dead, Right panel) using magnetic nanoparticles. (E) The activation kinetics of IK,Ca was quantified compared to the total charge entered through LTCC during the prepulse (QCa in pC). Current traces together with insets showing activation kinetics of IK,Ca (red line) compared to the total charge entered through LTCCs during the prepulse (QCa in pC, blue line), before and after the blue light for rabbit ventricular myocytes transfected with optogenetic constructs containing inositol-5-phosphatase (5P, Left Panel) compared to control (inactive phosphatase, 5P-Dead, Right Panel). (F) IK,Ca was significantly blocked after blue light exposure compared to control cells. *P = 0.01.
Fig. 2.
Fig. 2.
Homology models of hSK2–CaM complexes based on the open state of hSK4-CaM cryo-EM structure (PDB: 6CNO) using Rosetta structural modeling. (A) Top 10 homology models of the hSK2 channel without CaM show large movements in the CaMBD in the C terminus of hSK2 channels, due to the flexible loop connecting pore-lining transmembrane helix S6 to the CaMBD. (B) Inclusion of CaM in homology modeling shows convergence among the top 10 models for the CaMBD. (C) Selectivity filter (SF) of the hSK2 channel shown using ball-and-stick representation with the distances of backbone carbonyl oxygen atoms (red balls) shown as dashed black lines (amino acid residue numbering based on the hSK2 channel). Nitrogen atoms are shown as blue balls. (D) Cross-subunit backbone carbonyl oxygen distances for SF amino acid residues of the open state of hSK4 cryo-EM structure (blue bars), hSK2–CaM homology models with 100 kcal/mol/Å2 restraints being applied to the backbone Cα atoms (red bars), and hSK2–CaM homology models without (w/o) restraints (yellow bars).
Fig. 3.
Fig. 3.
MD simulation parameters for a hSK2–CaM complex: (A) Visualization of the four subunits of hSK2–CaM complex before (Left) and after (Right) embedding into a POPC bilayer (light gray). PIP2 molecules are included in the lower bilayer leaflet only but are not visualized. MD simulation conditions and box size dimensions in X, Y, and Z are shown. (B) An extended equilibration protocol for 100 ns using Amber18 on the high-performance computer cluster (HPC) Expanse provides stable MD simulations by varying the location and strength of the restraints applied to the hSK2–CaM tetramer up to each time point indicated in ns and shaded in light green. It was followed by mostly unrestrained production run on Anton 2 supercomputer. (C) RMSD profiles for the backbone Cα hSK2–CaM tetramer and the selectivity filter (SF) during MD simulations equilibrated for 100 ns using Amber18 (light green shaded area corresponding to the shaded area in panel B), followed by production runs of up to 5,000 ns on Anton 2.
Fig. 4.
Fig. 4.
Intracellular hydrophobic gate V390 residue across-subunit distances and K+ ion conduction for homology models of the hSK2–CaM tetramer. (AC) Location of the V390 residue in the S6 transmembrane helix of the hSK2–CaM tetramer in closed, intermediate, and open conformational states. Pore dimensions were computed using the HOLE program and are shown using surface representation with coloring corresponding to the pore radii. Insets in A-C are zoomed in images. (D and E) Quantification of the across-subunit distances between backbone Cα atoms of V390 residues (open = blue, intermediate = magenta, and closed = yellow). (F and G) Illustration of ion conduction in the open conductive homology model of hSK2–CaM tetramer. The time series of K+ ion z-positions (K+ z-pos.) during 5-μs MD simulations with an applied voltage of 750 mV is depicted as they pass through the selectivity filter (SF). Five distinct positions of K+ in the SF, sites S0 to S4, defined by the backbone carbonyl oxygen atoms (colored in red) of SF amino acid residues (S358 to D363) have been labeled and separated by horizontal dashed lines. The inset on the right panel shows K+ ion conduction at an expanded time scale.
Fig. 5.
Fig. 5.
Tracking of PIP2 in the membrane XY plane over time identifies two PIP2 binding pockets, denoted transient and activation binding sites. (A and B) Movement of PIP2 molecules into the binding pockets of the hSK2–CaM homology model in the intermediate state during MD simulations. The color scale provides time progression over the 5-μs MD simulations from cyan to green, yellow, orange, red, and dark brown. The hSK2–CaM complex is shown with top (from the extracellular side) and side views in panels A and B, respectively. (CE, Left Panels) Top views of the hSK2 channel as in A. PIP2 molecule 1, 2, and 3 locations at the transient, transfer, and activation binding sites during 5 μs of the MD simulations. PIP2 location is shown by colored dots corresponding to the simulation time with the corresponding time scale on the right, whereas hSK2–CaM complex atomic density is shown in different shades of green with darker colors corresponding to higher density. (C) PIP2 molecule 1 at the transient binding site, which includes amino acid residues R271, K278, and R286. (D) Transfer of PIP2 molecule 2 from the transient to the activation binding site. (E) PIP2 molecule 3 at the activation binding site, which includes residues R299, R395, K396, and K471. (C–E, Right Panels) Magnified side view of the binding sites of PIP2 on hSK2 channel (side view as in Panel B) to further illustrate amino acid residues crucial for PIP2 binding.
Fig. 6.
Fig. 6.
Formation of salt bridges between PIP2 and amino acid residues from the hSK2–CaM tetramer and their disruption by mutagenesis experiments. (A) hSK2–CaM complex (shown as green ribbons with 70% transparency) to highlight the location of PIP2 binding shown as a wireframe. Only two subunits are shown for clarity. The red box highlights the region of zoom-in panels in BF. (B) Zoom-in view of the intersubunit salt bridge between R395 of subunit III and E398 of subunit II located on S6 helices shown as ribbons. (CF) PIP2 carbon atoms are shown in pink and hSK2 backbone is shown in green. Phosphorus (orange), oxygen (red), and nitrogen (blue) atoms involved in PIP2:R395 salt bridges are shown in ball-and-stick representation. Representative poses of hSK2–CaM from clustering of MD simulation data that are able to form the PIP2:R395 salt bridge are shown in darker shades and poses unable to form this salt bridge are shown in lighter shades. (C) Poses with all major amino acid residues forming salt bridges with PIP2 in the activation site, R299, R395, K396, and K471. (D) R395 side chain orientations shown to exemplify differences when it forms a salt bridge with E398 vs. PIP2. (E) Only hSK2–CaM poses that do not form the PIP2:R395 salt bridge. (F) Only hSK2–CaM poses that do form the PIP2:R395 salt bridge. (G) Two top graphs show clustering of MD simulation results based on simulation time showing hSK2–CaM (SK2) and PIP2 poses, which are able to form the PIP2:R395 salt bridge in darker shades of green and pink, respectively. The four lower graphs show time series of salt bridge formation (dark-blue) and breaking (white) between several hSK2–CaM residues and PIP2 using a 3.6 Å cutoff. The red vertical line across all the graphs shows time point at which R395:PIP2 salt bridge was first detected. (H) Apamin-sensitive currents from hSK2-WT compared to tandem constructs containing R395C and E398C mutations in hSK2 subunits 1 and 2, respectively. Nontransfected HEK293 cells do not exhibit appreciable apamin-sensitive currents under our recording conditions (blue trace). (I) Summary data showing the apamin-sensitive current density at −120 and +60 mV, respectively. (J) Representative current traces showing responses of WT compared to the mutant constructs to diC8-PIP2 in HEK293 cells with diC8-PIP2 (red traces) or vehicle alone (black traces) in the intracellular solution. (K) Summary data demonstrating hSK2 current density from WT compared to the mutant constructs. hSK2-WT current density was significantly enhanced by diC8-PIP2, while the mutant construct failed to respond to PIP2.
Fig. 7.
Fig. 7.
Diagrams depicting how PIP2 works in concert with Ca2+ and calmodulin (CaM) in the proposed activation mechanism of the SK2 channel. (A) The conformational state transition mechanism of the hSK2–CaM complex. (B) The widening of the SK2 intracellular gate through the disruption of the cross-subunit R395:E398 salt bridge by PIP2. (C) The movement of PIP2 into the SK2 activation site. (D) Depiction of the conveyor belt-like movement of PIP2 by binding to multiple basic residues in the CaMBD of SK2 channels.

Similar articles

References

    1. Kohler M., et al. , Small-conductance, calcium-activated potassium channels from mammalian brain. Science 273, 1709–1714 (1996). - PubMed
    1. Zhang X. D., Lieu D. K., Chiamvimonvat N., Small-conductance Ca2+-activated K+ channels and cardiac arrhythmias. Heart Rhythm. 12, 1845–1851 (2015). - PMC - PubMed
    1. Adelman J. P., Maylie J., Sah P., Small-conductance Ca2+-activated K+ channels: Form and function. Annu. Rev. Physiol. 74, 245–269 (2012). - PubMed
    1. Stocker M., Ca2+-activated K+ channels: Molecular determinants and function of the SK family. Nat. Rev. Neurosci. 5, 758–770 (2004). - PubMed
    1. Strassmaier T., et al. , A novel isoform of SK2 assembles with other SK subunits in mouse brain. J. Biol. Chem. 280, 21231–21236 (2005). - PubMed

MeSH terms

Substances

Grants and funding