. 2024 Dec;291(23):5133-5155.
doi: 10.1111/febs.17275. Epub 2024 Sep 17.

Mouse polyomavirus infection induces lamin reorganisation

Affiliations

Mouse polyomavirus infection induces lamin reorganisation

Kateřina Bruštíková et al. FEBS J. 2024 Dec.

Abstract

The nuclear lamina is a dense network of intermediate filaments beneath the inner nuclear membrane. Composed of A-type lamins (lamin A/C) and B-type lamins (lamins B1 and B2), the nuclear lamina provides a scaffold for the nuclear envelope and chromatin, thereby maintaining the structural integrity of the nucleus. A-type lamins are also found inside the nucleus where they interact with chromatin and participate in gene regulation. Viruses replicating in the cell nucleus have to overcome the nuclear envelope during the initial phase of infection and during the nuclear egress of viral progeny. Here, we focused on the role of lamins in the replication cycle of a dsDNA virus, mouse polyomavirus. We detected accumulation of the major capsid protein VP1 at the nuclear periphery, defects in nuclear lamina staining and different lamin A/C phosphorylation patterns in the late phase of mouse polyomavirus infection, but the nuclear envelope remained intact. An absence of lamin A/C did not affect the formation of replication complexes but did slow virus propagation. Based on our findings, we propose that the nuclear lamina is a scaffold for replication complex formation and that lamin A/C has a crucial role in the early phases of infection with mouse polyomavirus.

Keywords: VP1; lamin A/C; lamin B; mouse polyomavirus; viral replication centres.


Conflict of interest statement

The authors declare no conflict of interest.

Figures

Fig. 1
Fig. 1
Two VP1 staining patterns are detected in the nucleus of infected 3T6 cells; a diffuse nucleoplasmic localisation (A) and accumulation at the nuclear periphery (B). Mouse 3T6 cells were infected with MPyV (MOI = 1 pfu per cell), fixed at 32 h post‐infection and VP1 was stained using a specific antibody. Images represent selected confocal sections of the indicated cells. Bar, 5 μm.
Fig. 2
Fig. 2
VP1 accumulates at the nuclear periphery during the late phase of infection. (A, B) Mouse 3T6 cells were infected with MPyV, and at the indicated hours post‐infection (hpi), VP1 (magenta) and lamin A/C (green; A) or lamin B1 (green; B) were stained with specific antibodies. (C, D) Mouse NIH‐3T3 fibroblasts were transfected with plasmid pEF1‐LATE, and 24 h post‐transfection (hpt), VP1 (magenta) and lamin A/C (green; C) or lamin B1 (green; D) were stained with specific antibodies. Images represent selected confocal sections of the indicated cells. Bar, 5 μm.
Fig. 3
Fig. 3
Depletions in lamin staining are detected in the late phase of infection. Mouse 3T6 cells were mock‐infected (A, B) or infected with MPyV (C, D), and at 40 h post‐infection, VP1 (magenta) and lamin A/C (green; A, C) or lamin B1 (green; B, D) were stained using specific antibodies. Images represent selected confocal sections of indicated cells. Enlarged details of the cells, highlighted by the dashed boxed regions in the upper panels, are presented in the lower panels. Bar, 5 μm.
Fig. 4
Fig. 4
Lamin A/C and lamin B1 levels are altered in infected cells. (A) Mouse 3T6 cells were infected and lysed at the indicated hours post‐infection (hpi). (C) WOP cells were transfected with plasmid pEF1‐LATE (pLATE) and lysed 24 h post‐transfection. Lysates were separated by SDS/PAGE, transferred onto a nitrocellulose membrane, and lamin A/C (L A/C), lamin B1 (LB) and GAPDH (GAP) were detected using specific antibodies. Some of the blots were spliced as indicated by the vertical dashed lines. (B, D) Graphic illustration of densitometry analysis of the digital images of western blots from three (D) or four (B) independent experiments. The data show the fold increase relative to mock‐infected or mock‐transfected cells. Error bars represent standard deviation. *P < 0.05 determined by Student's t‐test. Changes in total levels of lamin B1 (B, red columns) were not significant (ns) according to Student's t‐test.
Fig. 5
Fig. 5
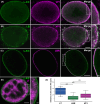
VP1 accumulates nonrandomly in close proximity to the nuclear lamina. Mouse 3T6 cells were infected with MPyV (MOI = 1 pfu per cell) and fixed at 40 h post‐infection. (A) VP1 (magenta) and lamin A/C (L A/C; green), (B) VP1 (magenta) and lamin B1 (LB; green), (C) lamin A/C (green) and lamin B receptor (LBR; magenta) or (D) lamin A/C (green) and LT antigen (magenta) were stained using specific antibodies. Bar, 5 μm. Enlarged details of the cells, indicated by dashed boxed regions, are presented in side panels. Bar, 1 μm. (E) The distance of VP1, LBR (positive control) and LT (negative control) from the border of the nucleus defined by lamin A/C was measured. Each point represents the mean value of distances from one nucleus; the original data resembled log‐normal distribution. White lines represent median values; the bottom and top edges of the box indicate the 25th and 75th percentiles, respectively. The whiskers extend from the box by 1.5× the interquartile range. Outliers would be shown if present. P‐values were obtained by Tukey HSD test following analysis of variance (ANOVA) (P‐value of ANOVA is < 0.000001). ***P < 0.001; ns, not significant. Sample size, n = 15. Samples from groups with more data were randomly sampled using equal probabilities and with no replacement.
Fig. 6
Fig. 6
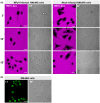
The nuclear envelope remains intact in MPyV‐infected cells. (A) NMuMG cells were mock‐infected or infected with MPyV (MOI = 10 pfu per cell), and at 40 h post‐infection, the cells were permeabilised with digitonin and incubated with high‐molecular‐weight dextran (155 kDa) conjugated with TRITC (TRITC‐Dex) (magenta). Confocal sections of live cells at indicated times after TRITC‐Dex addition are presented (in minutes). (B) In parallel, to confirm infection of the cells, the infected NMuMG were fixed and then LT antigen (green) was stained using specific antibodies. BF, bright field. Bar, 20 μm.
Fig. 7
Fig. 7
Lamin A/C is solubilised in infected cells. (A) Mouse 3T6 cells were infected, fractionated in situ at 40 h post‐infection (hpi) and VP1 (magenta) and lamin A/C (L A/C; green) or lamin B1 (LB; green) were stained with specific antibodies. Images are selected confocal sections of non‐fractionated cells or cells after the final fractionation step. Bar, 5 μm. (B) Mouse 3T6 cells were infected, fractionated in situ at 40 hpi and washed‐out material from each fraction was separated by SDS/PAGE and transferred onto a nitrocellulose membrane. The presence of VP1, LT, lamin A/C and lamin B1 in each washed‐out fraction was determined using specific antibodies.
Fig. 8
Fig. 8
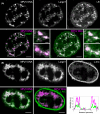
Viral replication centres are associated with nuclear lamins. Mouse 3T6 cells were infected, and at 40 h post‐infection, viral DNA was labelled by fluorescence in situ hybridisation (magenta) and large T antigen (green) and lamin B1 (LB; green) (A) or lamin A/C (L A/C; green) (B) were stained with specific antibodies. Bar, 5 μm. Enlarged details of the cells, indicated by dashed boxed regions, are presented in side panels. Bar, 1 μm. Images are selected confocal sections of the indicated cells. The graph represents the intensities of MPyV DNA and lamin A/C signals corresponding to the dotted line in the last image.
Fig. 9
Fig. 9
Lamin A/C is partially degraded and phosphorylated in infected cells. (A) Mouse 3T6 cells were infected with MPyV for 40 h, then fractionated into cytoplasmic (cyt), nuclear (nuc) and insoluble (ins) fractions. The same proportion of each fraction was separated by SDS/PAGE, transferred to a nitrocellulose membrane. Lamin A/C (L A/C) and as a control, GAPDH or proliferating cell nuclear antigen (PCNA) were detected using a specific antibody. Enlarged details of the western blot marked using a dashed box are presented in the lower panels. A lamin A/C‐positive band found predominantly in the infected cells is marked by an asterisk (*). (B) Mouse 3T6 cells were infected with MPyV and lysed at 40 h post‐infection. Lysates were separated by 6% SDS/PAGE gel supplemented with Phos‐tag (+phTag) or by control 6% SDS/PAGE gel (−phTag). Separated proteins were transferred to a nitrocellulose membrane and lamin A/C was detected with a specific antibody. Lamin A/C is marked by a red arrow and phosphorylated lamin A/C isoforms are marked by blue arrows.
Fig. 10
Fig. 10
Lamin A/C deficiency does not influence the association of VP1 with the nuclear lamina but negatively affects VP1 positioning in the nucleus. (A) Lysates of LMNA KO cells and LMNA wild‐type (wt) cells were separated by SDS/PAGE and transferred to a nitrocellulose membrane, and lamin A/C (L A/C), lamin B1 (LB) and GAPDH were detected with specific antibodies. (B) LMNA KO cells and LMNA wt cells were infected, and at 40 h post‐infection (hpi), lamin B1 (green) and VP1 (magenta) were stained using specific antibodies. Images are confocal sections of the indicated cells. Bar, 5 μm. (C) LMNA KO cells and LMNA wt cells were infected, fractionated in situ at 40 hpi and VP1 (magenta) and lamin B1 (LB; green) were stained using specific antibodies. Images are selected confocal sections of non‐fractionated cells or cells after the final fractionation step. Bar, 5 μm. (D) LMNA KO cells and LMNA wt cells were infected, fractionated in situ at 40 hpi and washed‐out material from each fraction was separated by SDS/PAGE and transferred onto a membrane. The presence of VP1 in each washed‐out fraction and the presence of lamin B1 (LB) in the last (SDS) fraction was determined using specific antibodies. (E) LMNA KO cells and LMNA wt cells were infected, and at 40 hpi, LT (red) was stained with specific antibodies. DNA (blue) was stained with DAPI. Images are confocal sections of the indicated cells. Bar, 5 μm.
Fig. 11
Fig. 11
A lack of lamin A/C slows the virus replication cycle. (A, C) LMNA KO cells and LMNA wt cells were infected, then lysed at 24 (A) or 40 (C) h post‐infection (hpi). Lysates were separated by SDS/PAGE, transferred onto a nitrocellulose membrane, and LT, VP1 and GAPDH were detected using specific antibodies. Western blots were spliced as indicated by the dashed vertical lines. (B, D) Graphic illustration of densitometry analysis of the digital images of western blots from four independent experiments. The data show the fold increase relative to LMNA KO cells. Error bars represent the standard deviation (SD). Student's t‐test was used for statistical analyses. *P < 0.05; **P < 0.01 and ***P < 0.001; ns, not significant. (E) LMNA KO cells and LMNA wt cells were infected and the number of MPyV genomes in cells was measured by quantitative PCR at 24 and 40 hpi. Data are the mean from triplicates of one experiment ± SD. Student's t‐test was used for statistical analyses. ***P < 0.001; ns, not significant. One of two representative experiments is displayed. (F) LMNA KO cells and LMNA wt cells were infected, and at 32 or 48 hpi, MPyV virions were isolated. Mouse 3T6 cells were infected with equal volumes of the virus isolated from the LMNA KO or LMNA wt cells. Cells were fixed at 24 hpi, stained using an LT‐specific antibody and virus titres were assigned. The graph shows the mean values from three independent experiments ± SD. Student's t‐test was used for statistical analyses. *P < 0.05; ns, not significant. (G) LMNA KO cells and LMNA wt cells were infected, and at 18 hpi, LT (red) was stained using specific antibodies. DNA (blue) was stained with DAPI. Images are confocal sections of the indicated cells. Bar, 5 μm. (H) LMNA wt cells and 3T6 cells were infected and lamin A/C (L A/C; green) and LT (magenta) were stained with specific antibodies at the indicated hours post‐infection. Only 18 hpi is shown for LMNA wt cells. Images are confocal sections of the indicated cells. Bar, 5 μm. (I) Mouse 3T6 cells were infected, fractionated in situ at 24 hpi and washed‐out material from each fraction was separated by SDS/PAGE and transferred onto a nitrocellulose membrane. The presence of VP1, LT, lamin A/C and lamin B1 (LB) in each washed‐out fraction was determined using specific antibodies.

Similar articles

Cited by

References

    1. Aebi U, Cohn J, Buhle L & Gerace L (1986) The nuclear lamina is a meshwork of intermediate‐type filaments. Nature 323, 560–564. - PubMed
    1. Gerace L & Burke B (1988) Functional organization of the nuclear envelope. Annu Rev Cell Biol 4, 335–374. - PubMed
    1. Nmezi B, Xu J, Fu R, Armiger TJ, Rodriguez‐Bey G, Powell JS, Ma H, Sullivan M, Tu Y, Chen NY et al. (2019) Concentric organization of A‐ and B‐type lamins predicts their distinct roles in the spatial organization and stability of the nuclear lamina. Proc Natl Acad Sci USA 116, 4307–4315. - PMC - PubMed
    1. Turgay Y, Eibauer M, Goldman AE, Shimi T, Khayat M, Ben‐Harush K, Dubrovsky‐Gaupp A, Sapra KT, Goldman RD & Medalia O (2017) The molecular architecture of lamins in somatic cells. Nature 543, 261–264. - PMC - PubMed
    1. Prokocimer M, Davidovich M, Nissim‐Rafinia M, Wiesel‐Motiuk N, Bar DZ, Barkan R, Meshorer E & Gruenbaum Y (2009) Nuclear lamins: key regulators of nuclear structure and activities. J Cell Mol Med 13, 1059–1085. - PMC - PubMed

MeSH terms

Associated data

LinkOut - more resources