. 2024 Sep 17;9(20):e182660.
doi: 10.1172/jci.insight.182660.

NKG2C and NKG2A coexpression defines a highly functional antiviral NK population in spontaneous HIV control

Affiliations

NKG2C and NKG2A coexpression defines a highly functional antiviral NK population in spontaneous HIV control

Nerea Sánchez-Gaona et al. JCI Insight. .

Abstract

Elite controllers (ECs), a unique group of people with HIV (PWH), exhibit remarkable control of viral replication in the absence of antiretroviral therapy. In this study, we comprehensively characterized the NK cell repertoire in ECs after long-term viral control. Phenotypic profiling of NK cells revealed profound differences compared with other PWH, but marked similarities to uninfected individuals, with a distinctive prevalence of NKG2C+CD57+ memory-like NK cells. Functional analyses indicated that ECs had limited production of functional molecules upon NK stimulation and consequently reduced natural cytotoxicity against non-HIV target cells. Importantly, ECs showed an exceptional ability to kill primary HIV-infected cells by the antibody-dependent cell cytotoxicity adaptive mechanism, which was achieved by a specific memory-like NK population expressing CD16, NKG2A, NKG2C, CD57, and CXCR3. In-depth single-cell RNA-seq unveiled a unique transcriptional signature in these NK cells linked to increased cell metabolism, migration, chemotaxis, effector functions, cytokine secretion, and antiviral response. Our findings underscore a pivotal role of NK cells in the immune control of HIV and identify specific NK cells as emerging targets for immunotherapies.

Keywords: AIDS/HIV; Innate immunity.


Conflict of interest statement

Conflict of interest: The authors have declared that no conflict of interest exists.

Figures

Figure 1
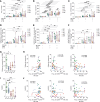
Figure 1. Phenotypic characterization of NK cells in ECs.
The expression of different NK markers was quantified by flow cytometry in different study groups: healthy donors (HD, n = 25), ECs with durable HIV control (DC, n = 21), ECs with aborted immunological control (AC, n = 13), PWH ART-treated individuals (ART, n = 24), and viremic PWH (VIR, n = 18). (A) Representative flow cytometry plots depicting the NK cell subset gating strategy from CD3 cells based on CD56 and CD16 expression (left: CD56+ total, CD56dimCD16hi, and CD56bright) and NKG2C and CD57 expression (right: NKG2C+CD57+ memory-like NK cells). (B) Violin plots depicting the frequency of different NK cell populations identified (left to right: CD56+ total, CD56dimCD16high, and CD56bright). (C) Violin plots depicting the frequency of memory-like NKG2C+CD57+ NK cells. (D) Violin plots depicting the frequency of different NK cell markers in CD56+ total NK cells by study group (left to right: CD158b, CXCR3, KLRG1, NKG2A, NKG2D, NKp30, NKG2C, and CD57). (E) Violin plots depicting the frequency of distinct NK cell receptors in expanded memory-like NKG2C+CD57+ NK cells (frequency >5% and counts >25; left to right: CD158b, CXCR3, KLRG1, NKG2A, NKG2D, and NKp30). Median with range is represented. Statistical comparisons were performed using Kruskal-Wallis 1-way ANOVA followed by Dunn’s multiple-comparison test. *P < 0.05; **P < 0<01; ***P < 0.001; ****P < 0.0001.
Figure 2
Figure 2. Functional profile of NK cells in ECs.
NK cell activation and cytotoxicity subsequent to stimulation were evaluated by study group. The percentages of (A) IFN-γ+, (B) CD107a+, and (C) polyfunctional IFN-γ+CD107a+ within the CD56+ NK cell population were determined in basal conditions, following coculture with K562 target cells, and with additional IL-15 stimulation. Similarly, these metrics were quantified in expanded memory-like NKG2C+CD57+ NK cells (frequency >5%): the percentages of (D) IFN-γ+, (E), CD107a+, and (F) polyfunctional IFN-γ+CD107a+ NK cells after stimulation were evaluated. (G) Violin plots depicting the natural cytotoxicity exhibited by CD56+ total NK cells from the different study groups following coculture with K562 cells. (H) Spearman’s correlations between natural cytotoxic responses and the frequency of distinct NK cell subsets (left to right: CD56dimCD16hi NK cells, CD56bright NK cells, and NKG2C+CD57+ NK cells). (I) Violin plots showing the ADCC activity mediated by CD56+ total NK cells against HIV-expressing cells by study group. (J) Spearman’s correlations between ADCC responses and the frequency of different NK cell populations (left to right: CD56dimCD16hi NK cells, CD56bright NK cells, and NKG2C+CD57+ NK cells). For violin plots, median with range is represented. *P < 0.05; **P < 0.01; ***P < 0.001; ****P < 0.0001 by repeated measures 2-way ANOVA followed by Tukey’s multiple-comparison test (AF) or Kruskal-Wallis test (G and I).
Figure 3
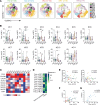
Figure 3. Association between NK cell phenotype and functional responses in EC.
(A) Optimized t-distributed stochastic neighbor embedding (opt-SNE) representation of distinct NK cell clusters, identified through dimensionality reduction based on the expression of the array of distinct NK cell receptors (CD16, CD158b, CXCR3, KLRG1, NKG2A, NKp30, NKG2D, NKG2C, and CD57), by study group (left to right: HD, DC, AC, ART, and VIR). (B) Violin plots showing the frequency of each NK cell cluster in CD56+ total NK cells by study group. (C) Heatmap depicting the normalized median expression of the selected phenotypic NK cell markers within the cell clusters identified in Figure 3A. (D) Correlation matrix depicting Spearman’s correlations between the frequency of NK cell clusters identified by dimensionality reduction based on the expression of phenotypic markers and functional responses. (E) Spearman’s correlations between the frequency of clusters C6 and C7 and natural cytotoxic responses in all study groups. (F and G) Spearman’s correlations between the frequency of C4 and ADCC responses in (F) all study groups and (G) within the DC group. Graphs represent medians and ranges. Each dot represents 1 individual of a specific cohorts, indicated by color code (HD in green, DC in blue, AC in red, ART in orange, VIR in purple). Statistical comparisons were performed using the Kruskal-Wallis test. *P < 0.05; **P < 0.01.
Figure 4
Figure 4. NK cells from DC enriched in specific receptors exhibit an increased ability to kill HIV-infected cells.
Distinct NK cell subsets were isolated from n = 5 DC individuals (median CD4+ T cell count = 1030 cells/μL; median viral load <40 copies HIV-1 RNA/mL) using FACS based on selected receptors, and assessed for ADCC responses. (A) Gating strategy of FACS-isolated NK cell populations based on the expression of CD16, NKG2A, NKG2C, CD57, and CXCR3. Five populations were identified: NKA (CD16+NKG2A+NKG2C+CD57+CXCR3+), NKB (CD16+NKG2ANKG2C+CD57+CXCR3+), NKC (CD16+NKG2A+NKG2CCD57+CXCR3+), NKD (CD16+NKG2ANKG2CCD57+CXCR3+), and NKE (CD16). (B) Violin plot depicting the ADCC activity mediated by each specific NK cell population based on the marker expression presented in A. Graphs include group medians and ranges. Statistical comparisons were performed using Friedman’s test followed by Dunn’s multiple-comparison test. *P < 0.05.
Figure 5
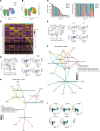
Figure 5. Unique transcriptional signatures define ADCC-mediating NK cells from DC.
Gene expression analysis by single-cell RNA-seq. (A) UMAP visualization of NK cell populations sorted from DC individuals (NKA in red, NKB in green, NKC in blue). (B) UMAP visualization of 13 distinct NK cell clusters identified from NK cell populations sorted by unsupervised hierarchical clustering. (C) Number of cells per cluster and sample as counts (left) or proportions (right). (D) Heatmap depicting the top 5 genes most differentially expressed (upregulated) in each NK cell cluster. (E) The top panel shows a volcano plot illustrating the differentially expressed genes between NKB and NKA subsets. Genes significantly overexpressed in NKB compared with NKA are highlighted in red, while those underexpressed in NKB relative to NKA are shown in blue. The bottom panel presents representative UMAP plots depicting the expression of genes upregulated in NKA compared with NKB. (F) Significant canonical pathways predicted by Gene Ontology Biological Process analysis (GO-BP) of differentially expressed genes in NKA versus NKB. (G) The top panel presents a volcano plot illustrating the differentially expressed genes between NKC and NKA subsets. Genes significantly overexpressed in NKC relative to NKA are shown in red, while those underexpressed in NKC compared with NKA are depicted in blue. The bottom panel displays representative UMAP plots highlighting the expression of genes upregulated in NKA compared with NKC. (H) Significant canonical pathways predicted by GO-BP of differentially expressed genes in NKA relative to NKC. (I) Differentiation trajectory analysis of NK cell clusters, illustrating the progression and differentiation pathways of each population. Five distinct lineages were identified. The pseudotime inference for each NK cell cluster is presented, with UMAP plots color coded by inferred lineages. The scale indicates the maturation state, ranging from yellow (least mature) to dark blue (most mature).

References

    1. Cao Y, et al. Virologic and immunologic characterization of long-term survivors of human immunodeficiency virus type 1 infection. N Engl J Med. 1995;332(4):201–208. doi: 10.1056/NEJM199501263320401. - DOI - PubMed
    1. Pantaleo G, et al. Studies in subjects with long-term nonprogressive human immunodeficiency virus infection. N Engl J Med. 1995;332(4):209–216. doi: 10.1056/NEJM199501263320402. - DOI - PubMed
    1. O’Connell KA, et al. Control of HIV-1 in elite suppressors despite ongoing replication and evolution in plasma virus. J Virol. 2010;84(14):7018–7028. doi: 10.1128/JVI.00548-10. - DOI - PMC - PubMed
    1. Deeks SG, Walker BD. Human immunodeficiency virus controllers: mechanisms of durable virus control in the absence of antiretroviral therapy. Immunity. 2007;27(3):406–416. doi: 10.1016/j.immuni.2007.08.010. - DOI - PubMed
    1. Jiang C, et al. Distinct viral reservoirs in individuals with spontaneous control of HIV-1. Nature. 2020;585(7824):261–267. doi: 10.1038/s41586-020-2651-8. - DOI - PMC - PubMed

MeSH terms