. 2024 Dec;54(12):e2451020.
doi: 10.1002/eji.202451020. Epub 2024 Sep 17.

Langerhans cells orchestrate apoptosis of DNA-damaged keratinocytes upon high-dose UVB skin exposure

Affiliations

Langerhans cells orchestrate apoptosis of DNA-damaged keratinocytes upon high-dose UVB skin exposure

Daniela Ortner et al. Eur J Immunol. 2024 Dec.

Abstract

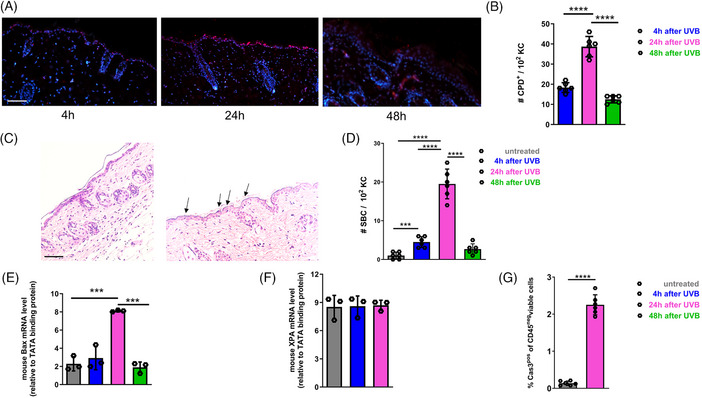
Ultraviolet (UV) irradiation of the skin causes mutations that can promote the development of melanoma and nonmelanoma skin cancer. High-dose UVB exposure triggers a vigorous skin reaction characterized by inflammation resulting in acute sunburn. This response includes the formation of sunburn cells and keratinocytes (KC) undergoing programmed cell death (apoptosis) when repair mechanisms of DNA damage are inadequate. The primary objective of this research was to clarify the involvement of Langerhans cells (LC) in the development of acute sunburn following intense UVB skin irradiation. To address this, we subjected the dorsal skin of mice to a single high-dose UVB exposure and analyzed the immediate immune response occurring within the skin tissue. Acute sunburn triggered an activation of LC, coinciding with a rapid influx of neutrophils that produced TNF-α. Furthermore, our investigation unveiled a marked increase in DNA-damaged KC and the subsequent induction of apoptosis in these cells. Importantly, we demonstrate a crucial link between the inflammatory cascade, the initiation of apoptosis in DNA-damaged KC, and the presence of LC in the skin. LC were observed to modulate the chemokine response in the skin following exposure to UVB, thereby affecting the trafficking of neutrophils. Skin lacking LC revealed diminished inflammation, contained fewer TNF-α-producing neutrophils, and due to the prevention of apoptosis induction, a lingering population of DNA-damaged KC, presumably carrying the risk of enduring genomic alterations. In summary, our results underscore the pivotal role of LC in preserving the homeostasis of UVB-irradiated skin. These findings contribute to a deeper understanding of the intricate mechanisms underlying acute sunburn responses and their implications for UV-induced skin cancer.

Keywords: Apoptosis; Langerhans cells; Neutrophils; Skin inflammation; UVB‐induced sunburn.


Conflict of interest statement

The authors declare no financial or commercial conflict of interest.

Figures

Figure 1
Figure 1
DNA damage and apoptosis induction in KC upon a single high‐dose UVB exposure. A single UVB exposure of 1000 J/m2 was administered to the dorsal skin of C57BL/6 mice. (A) Representative images of skin sections for immunofluorescence detection of cyclobutane pyrimidine dimers (CPD)+ cells 4, 24, and 48 h upon UVB irradiation. CPD+ cells (red fluorescence) are counterstained with nuclei staining by DAPI (blue fluorescence). Scale bar = 100 µm. (B) Quantification of CPD+ cells in skin sections at different time points (4, 24, and 48 h) after UVB skin exposure. CPD+ cells were counted in 4 areas per section, each data point represents the mean of the 4 areas per individual mouse (n = 6 mice, two independent experiments). (C) Representative H&E staining of skin sections 24 h after UVB exposure shows characteristic sunburn cell (SBC) formation indicating apoptotic KC with its pyknotic nucleus and eosinophilic cytoplasm as indicated by black arrows in the epidermis of irradiated skin (right) compared with untreated (healthy) skin (left). (D) The number of SBC+ cells was evaluated at different time points (4, 24, and 48 h) after UVB irradiation. SBC were counted in 4 areas per section, each data point represents the mean of the 4 areas per individual mouse (n = 6 mice, two independent experiments). (E) mRNA expression level for Bax was analyzed in skin samples at different time points (4, 24, and 48 h) after UVB irradiation (n = 3 mice, one experiment). (F) mRNA expression level for XPA was analyzed 4 and 24 h after UVB irradiation and compared with untreated skin of C57BL/6 mice (n = 3 mice, one experiment). G) Skin cell suspensions were analyzed by flow cytometry for act‐Cas3+ cells, pregated on viable CD45 cells 24 h after UVB irradiation. A summary graph of 6 mice per group is shown from two independent experiments. All graphs show mean ± SEM and each data point represents an individual mouse. *p < 0.05; **p < 0.01; ***p < 0.001; unpaired t‐test.
Figure 2
Figure 2
TNF‐α is crucial for apoptosis induction by high‐dose UVB skin irradiation. C57BL/6 mice were irradiated with a single UVB exposure using 1000 J/m2 on the back skin. (A) mRNA expression level for TNF‐α in skin was analyzed 4 and 24 h after UVB irradiation (n = 6 mice, two independent experiments). (B) Mice were injected intraperitoneally with 100 µg anti‐TNF‐α antibody 1 day before and immediately after UVB irradiation. SBC numbers were evaluated in UVB irradiated skin 24 h after treatment and were counted in 4 areas per section, each data point represents the mean of the 4 areas per individual mouse. (C) The percentages of act‐Cas3+CD45 viable cells were determined by flow cytometry in skin 24 h after UVB irradiation. (D) Antibodies that specifically recognize the cell surface marker CD45 and act‐Cas‐3 were used to characterize viable CD45 cells in skin cell suspensions by flow cytometry. Graphs display mean ± SEM, each data point represents an individual mouse, and the summary graph for 3 mice per group analyzed in one experiment is shown for (B) and (C); *p < 0.05; **p <0.01; ***p <0.001; unpaired t‐test.
Figure 3
Figure 3
The crucial role of LC during sunburn cell formation and apoptosis induction of KC. C57BL/6 or huLangerin‐DTR mice were irradiated with a single UVB exposure using 1000 J/m2 on the back skin. (A) The numbers of CD45+CD11c+CD103CD207+ viable LC were determined by flow cytometry 24 and 96 h after UVB irradiation in C57BL/6 mice (n = 6 mice, two independent experiments). (B) LC were identified as CD45+CD11c+CD103CD207+ viable cells. CD86 median fluorescence intensity (MFI) was determined by flow cytometry (n = 3 mice, one experiment). Representative flow cytometry plots show the gating strategy for CD86+ LC. (C) Skin cell suspensions of huLangerin‐DTR mice injected intraperitoneally with 0.5 µg DT 2 days prior to UVB irradiation were analyzed for the presence of LC 24 h after UVB n by flow cytometry (n = 6 mice, two independent experiments). (D) mRNA expression levels for TNF‐α were analyzed 24 h after UVB irradiation comparing the skin of huLangerin‐DTR mice in the presence and absence of LC during UVB irradiation (n = 6 mice, two independent experiments). (E) The numbers of SBC were evaluated in the skin of depleted and non‐depleted huLangerin‐DTR mice 24 h after UVB irradiation. SBC were counted in 4 areas per section, and summary graphs for s mice per group from two independent experiments are shown. (F) The percentages of act‐Cas3+CD45 viable cells were determined in the skin of depleted and non‐depleted huLangerin‐DTR mice by flow cytometry 24 h after UVB irradiation (n = 6 mice, two independent experiments). (G) Representative images of skin sections for immunofluorescence staining of CPD+ cells 48 h after UVB irradiation of mice depleted (right) or nondepleted (left) of LC are shown. CPD+ cells (red fluorescence) are counterstained with nuclei staining by DAPI (blue fluorescence). Scale bar = 100 µm. (H) Quantification of CPD+ cells in skin sections 48 h after UVB skin exposure. CPD+ cells were counted in three areas per section, each data point represents the mean of the three areas per individual mouse (n = 6 mice, two independent experiments). All graphs display mean ± SEM, each data point represents an individual mouse. *p < 0.05; **p < 0.01; ***p < 0.001; unpaired t‐test.
Figure 4
Figure 4
LC are important for the recruitment of TNF‐α‐producing neutrophils to acute sunburn skin. huLangerin‐DTR mice were irradiated with a single UVB exposure using 1000 J/m on the back skin. LC were depleted 2 days before UVB irradiation by intraperitoneal injection of 0.5 µg of DT. (A) The mRNA expression level of CXCL‐1 and CXCL‐2 in the skin of depleted and non‐depleted huLangerin‐DTR mice was analyzed 12 h after UVB treatment; n = 3 mice, one experiment. (B) Skin cell suspensions of depleted or non‐depleted huLangerin‐DTR mice were analyzed for the numbers of neutrophils (CD45+CD11b+Ly6G + viable cells) 24 h after irradiation by flow cytometry (n = 6 mice, two independent experiments). (C) Representative flow cytometry gating strategies for analyzing TNF‐α production in CD45 keratinocytes (KC), Langerin+ LC, and Ly6G+ neutrophils in the skin 24 h after UVB exposure are shown. The comparison of TNF‐α production by KC, LC, and neutrophils is displayed as the median fluorescence intensity (MFI) by flow cytometry (n = 3 mice, one experiment). (D) huLangerin‐DTR mice were injected intraperitoneally with anti‐Gr‐1 or PBS 2 days before and on the day of UVB irradiation. Skin cell suspensions of depleted or non‐depleted huLangerin‐DTR mice were analyzed for the numbers of CD45+CD11b+Ly6G+ viable neutrophils 24 h after UVB irradiation by flow cytometry (n = 6 mice, two independent experiments). (E) The number of sunburn cells (SBC) was evaluated in skin 24 h after UVB irradiation. SBC were counted in three areas per section (n = 6 mice, two independent experiments). (F) The percentages of act‐Cas3+ CD45 viable cells were determined by flow cytometry; n = 6 mice, two independent experiments. (G) Representative images of H&E‐stained histological sections displaying epidermal thickening 48 h after UVB exposure comparing the skin of mice not depleted to skin depleted of LC or neutrophils. Scale bars = 100 µm. (H) Epidermal thickness was measured using ImageJ software 48 h following UVB exposure. Three areas of each slide have been examined; each data point represents the mean of the 3 areas per one individual mouse (n = 6 mice, two independent experiments). All graphs display mean ± SEM, each data point represents an individual mouse. *p < 0.05; **p < 0.01; ***p < 0.001; unpaired t‐test.

References

    1. Narayanan, D. L. , Saladi, R. N. and Fox, J. L. , Ultraviolet radiation and skin cancer. Int. J. Dermatol. 2010. 49: 978–986. - PubMed
    1. Pfeifer, G. P. , Mechanisms of UV‐induced mutations and skin cancer. Genome Instab. Dis. 2020. 1: 99–113. - PMC - PubMed
    1. Mullenders, L. H. F. , Solar UV damage to cellular DNA: from mechanisms to biological effects. Photochem. Photobiol. Sci. 2018. 17: 1842–1852. - PubMed
    1. Vink, A. A. and Roza, L. , Biological consequences of cyclobutane pyrimidine dimers. J. Photochem. Photobiol. B 2001. 65: 101–104. - PubMed
    1. Tyrrell, R. M. , Ultraviolet radiation and free radical damage to skin. Biochem. Soc. Symp. 1995. 61: 47–53. - PubMed

Substances