. 2024 Sep 12;30(9):gaae033.
doi: 10.1093/molehr/gaae033.

Maturational competence of equine oocytes is associated with alterations in their 'cumulome'

Affiliations

Maturational competence of equine oocytes is associated with alterations in their 'cumulome'

Jasmin Walter et al. Mol Hum Reprod. .

Abstract

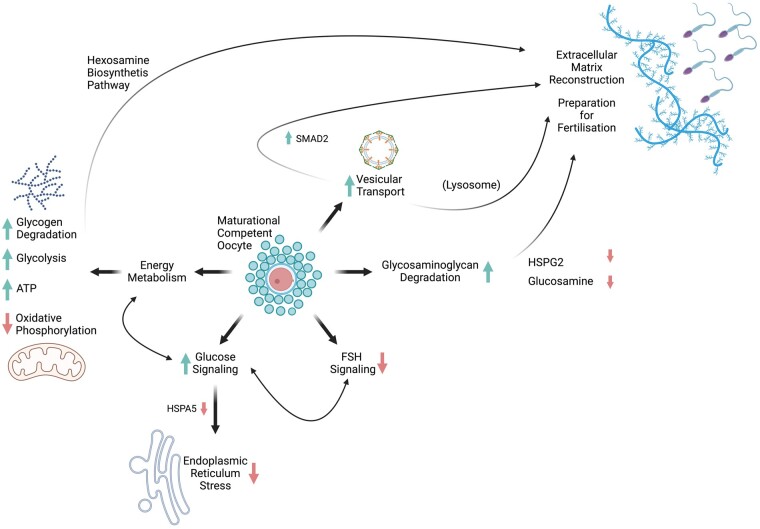
Assisted reproductive technologies are an emerging field in equine reproduction, with species-dependent peculiarities, such as the low success rate of conventional IVF. Here, the 'cumulome' was related to the developmental capacity of its corresponding oocyte. Cumulus-oocyte complexes collected from slaughterhouse ovaries were individually matured, fertilized by ICSI, and cultured. After maturation, the cumulus was collected for proteomics analysis using label-free mass spectrometry (MS)-based protein profiling by nano-HPLC MS/MS and metabolomics analysis by UPLC-nanoESI MS. Overall, a total of 1671 proteins and 612 metabolites were included in the quantifiable 'cumulome'. According to the development of the corresponding oocytes, three groups were compared with each other: not matured (NM; n = 18), cleaved (CV; n = 15), and blastocyst (BL; n = 19). CV and BL were also analyzed together as the matured group (M; n = 34). The dataset revealed a closer connection within the two M groups and a more distinct separation from the NM group. Overrepresentation analysis detected enrichments related to energy metabolism as well as vesicular transport in the M group. Functional enrichment analysis found only the KEGG pathway 'oxidative phosphorylation' as significantly enriched in the NM group. A compound attributed to ATP was observed with significantly higher concentrations in the BL group compared with the NM group. Finally, in the NM group, proteins related to degradation of glycosaminoglycans were lower and components of cumulus extracellular matrix were higher compared to the other groups. In summary, the study revealed novel pathways associated with the maturational and developmental competence of oocytes.

Keywords: IVF; IVM; biomarker; cumulus cells; developmental competence; equine; maturation; metabolomics; oocyte; proteomics.


Conflict of interest statement

The authors declare that they have no conflict of interest.

Figures

Graphical Abstract
Graphical Abstract
Cumulus signaling associated with oocyte developmental competence. HSPA5, endoplasmic reticulum chaperone BiP; HSPG2, basement membrane-specific heparan sulfate proteoglycan core protein; SMAD2, mothers against decapentaplegic homolog 2.
Figure 1.
Figure 1.
Experimental design with sample distribution on developmental groups.
Figure 2.
Figure 2.
Results of the between-group analysis (BGA). The groups show some overlaps but considering the shift of the cluster centers along the horizontal axis 1, there is a clear separation, especially between the not matured group (NM, blue) and the two matured groups: cleaved (CV, green) and blastocyst (BL, red). Left: Metabolomics data; Right: Proteomics data; grid line distance d = 20.
Figure 3.
Figure 3.
Enrichment analysis using STRING-DB. The analysis was conducted on 243 proteins (241 matched with database, minimum required interaction score 0.7) with significant higher expression (both FC>1.2, one P<0.05) in the cleaved (CV) or blastotyst (BL) groups compared to the not matured group (NM). Highlighted are proteins in the overrepresented KEGG groups ‘glycolysis/gluconeogenesis’ (hsa00010, FDR 0.01, orange nodes), ‘fructose and mannose metabolism’ (hsa00051, FDR<0.01, yellow nodes), and ‘starch and sucrose metabolism’ (hsa00500, FDR<0.05, green nodes). Also, proteins overrepresented in the pathways ‘endocytosis’ (hsa04144, FDR <1E−07, pink nodes) and ‘protein processing in endoplasmic reticulum’ (hsa04141, FDR=0.001, turquoise nodes) are indicated. The complete enrichment analysis can be accessed online on STRING-DB (https://version-11-5.string-db.org/cgi/network?networkId=bxhDLO88HwDV). Enriched KEGG pathways are listed in Supplementary Table S3.
Figure 4.
Figure 4.
Energy metabolism. Visualized are the affected pathways of glycogen degradation, glycolysis, tricarboxylic acid cycle, and oxidative phosphorylation. The illustration includes 15 proteins (blue labels) and 6 metabolites (green labels) with significant differences in abundance between not matured (NM) and/or cleaved (CV)/blastocyst (BL) groups that belong to the KEGG pathways ‘starch and sucrose metabolism’ (hsa00500), ‘glycolysis/gluconeogenesis’ (hsa00010), and ‘fructose and mannose metabolism’ (hsa00051). Box plots were generated on ASINH normalized abundances (Whiskers from min to max; red: NM, orange: CV, green: BL). Significant differences in the pairwise comparison are marked with a bar. For ATP the sum of compounds 6.25_426.0214m/z and 6.25_506.9957n is illustrated. Adapted from ‘Warburg Effect’ template, using BioRender.com (2021). ACO1, Cytoplasmic aconitate hydratase; AKR1B1, Aldo-keto reductase family 1 member B1; ALDH9A1, 4-trimethylaminobutyraldehyde dehydrogenase; ALDOC, Fructose-bisphosphate aldolase C; ENO3, Beta-enolase; FBP1, Fructose-Bisphosphatase 1; GLUT, Glucose Transporter; GPI, Glucose-6-phosphate isomerase; GYS1, Glycogen Synthase 1; HK1, Hexokinase-1; MCT, Monocarboxylate Transporter; MPI, Mannose-6-phosphate isomerase; NDUFS8, NADH dehydrogenase (ubiquinone) iron-sulfur protein 8, mitochondrial; PFKFB3, 6-phosphofructo-2-kinase/fructose-2,6-bisphosphatase 3; PGLS, 6-phosphogluconolactonase; PGM1, Phosphoglucomutase-1; PKM, Pyruvate kinase PKM; PYGB, Glycogen phosphorylase, brain form; PYGL, Glycogen phosphorylase, liver form.
Figure 5.
Figure 5.
Vesicular transport with endocytic and secretory pathways. The illustration includes 28 proteins (blue labels) with significant differences in the abundance between the not matured (NM) and/or cleaved (CV)/blastocyst (BL) groups and belonging to the KEGG pathways ‘endocytosis’ (hsa04144) or ‘protein processing in endoplasmic reticulum’ (hsa04141). Box plots were generated on ASINH normalized abundances (Whiskers from min to max; red: NM, orange: CV, green: BL). Significant differences in the pairwise comparison are marked with a bar. Adapted from the ‘Intracellular Transport’ template using BioRender.com (2021). AP1G1, AP-1 complex subunit gamma-1; BAX, Apoptosis regulator BAX; BCAP31, B-cell receptor-associated protein 31; CAPN1, Calpain-1 catalytic subunit; HSPA5, Endoplasmic reticulum chaperone BiP; HSPH1, Heat shock protein 105 kDa; IGF2R, Cation-independent mannose-6-phosphate receptor; RAB7A, Ras-related protein Rab-7a; SEC23A, Protein transport protein Sec23A; SEC23B, Protein transport protein Sec23B; SEC24A, Protein transport protein Sec24A; SEC24C, Protein transport protein Sec24C; SEC24D, Protein transport protein Sec24D; SEC61A1, Protein transport protein Sec61 subunit alpha isoform 1.
Figure 6.
Figure 6.
Glycosaminoglycan degradation. The illustration includes four proteins (blue labels) and one metabolite (green label) with significant differences in the abundance between not matured (NM) and/or cleaved (CV)/blastocyst (BL) groups and belonging to the KEGG pathway ‘glycosaminoglycan degradation’ (hsa00531). Box plots were generated on ASINH normalized abundances (Whiskers from min to max; red: NM, orange: CV, green: BL). Significant differences in the pairwise comparison are marked with a bar. Created with BioRender.com. GNS, N-acetylglucosamine-6-sulfatase; GUSB, Beta-glucuronidase; HEXA, Beta-hexosaminidase subunit alpha; HSPG2, Basement membrane-specific heparan sulfate proteoglycan core protein; HYAL, Hyaluronidase.

References

    1. Abbassi L, El-Hayek S, Carvalho KF, Wang W, Yang Q, Granados-Aparici S, Mondadori R, Bordignon V, Clarke HJ.. Epidermal growth factor receptor signaling uncouples germ cells from the somatic follicular compartment at ovulation. Nat Commun 2021;12:1438. - PMC - PubMed
    1. Adriaenssens T, Wathlet S, Segers I, Verheyen G, De Vos A, Van der Elst J, Coucke W, Devroey P, Smitz J.. Cumulus cell gene expression is associated with oocyte developmental quality and influenced by patient and treatment characteristics. Hum Reprod 2010;25:1259–1270. - PubMed
    1. Aguila L, Treulen F, Therrien J, Felmer R, Valdivia M, Smith LC.. Oocyte selection for in vitro embryo production in bovine species: noninvasive approaches for new challenges of oocyte competence. Animals 2020;10:2196. - PMC - PubMed
    1. Alberts B, Johnson A, Lewis J, Morgan D, Raff M, Roberts K, Walter P.. Molecular Biology of the Cell, 6th edn. New York, NY, USA: Garland Science, 2008.
    1. Allworth AE, Albertini DF.. Meiotic maturation in cultured bovine oocytes is accompanied by remodeling of the cumulus cell cytoskeleton. Dev Biol 1993;158:101–112. - PubMed

LinkOut - more resources