. 2024 Sep 17;81(1):409.
doi: 10.1007/s00018-024-05447-1.

A naturally occurring 22-amino acid fragment of human hemoglobin A inhibits autophagy and HIV-1

Affiliations

A naturally occurring 22-amino acid fragment of human hemoglobin A inhibits autophagy and HIV-1

Dennis Freisem et al. Cell Mol Life Sci. .

Abstract

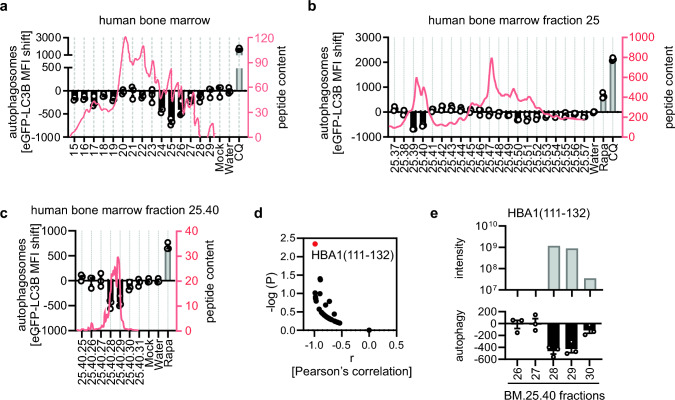
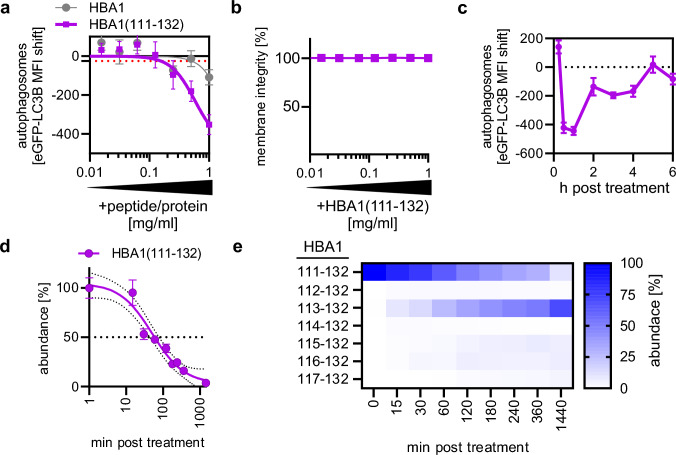
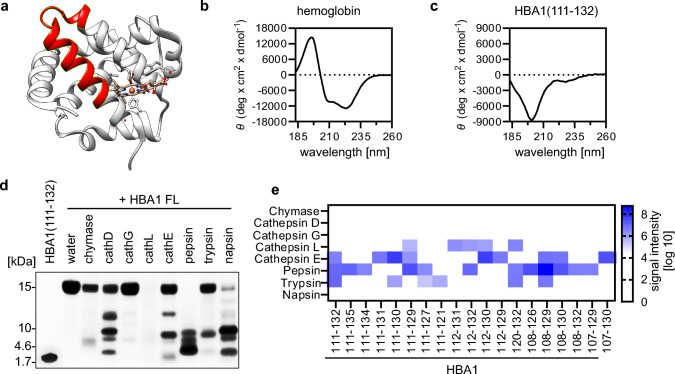
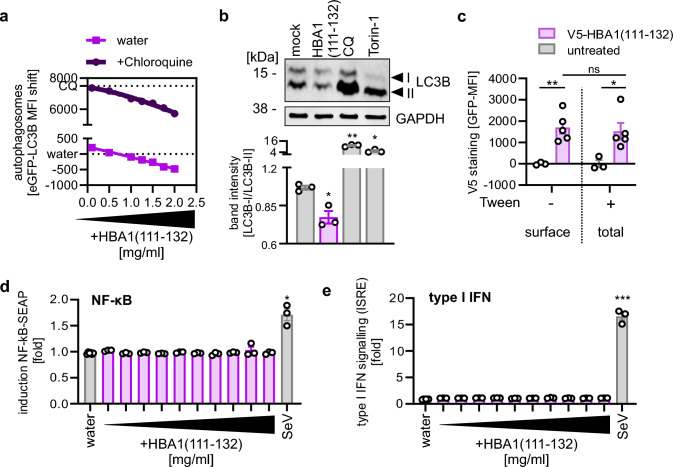
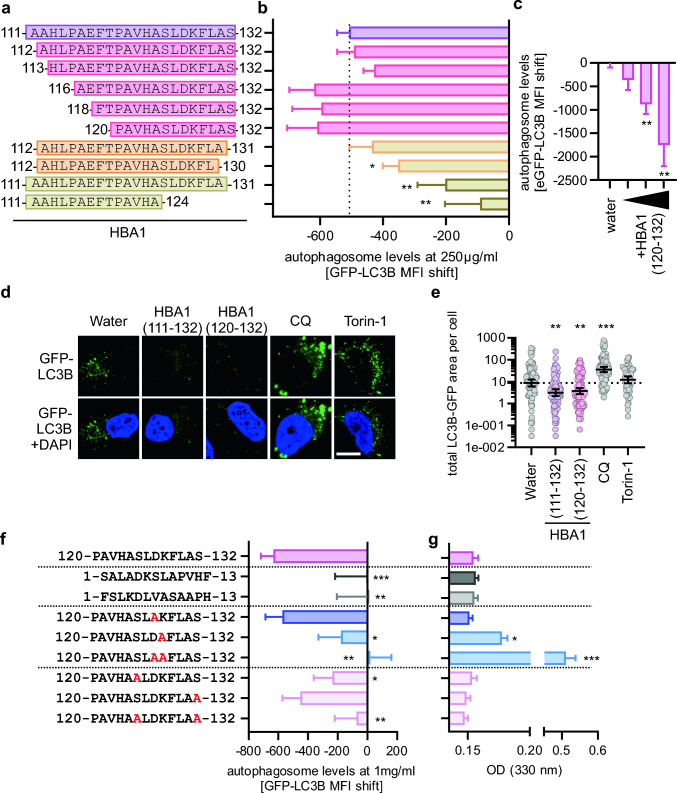
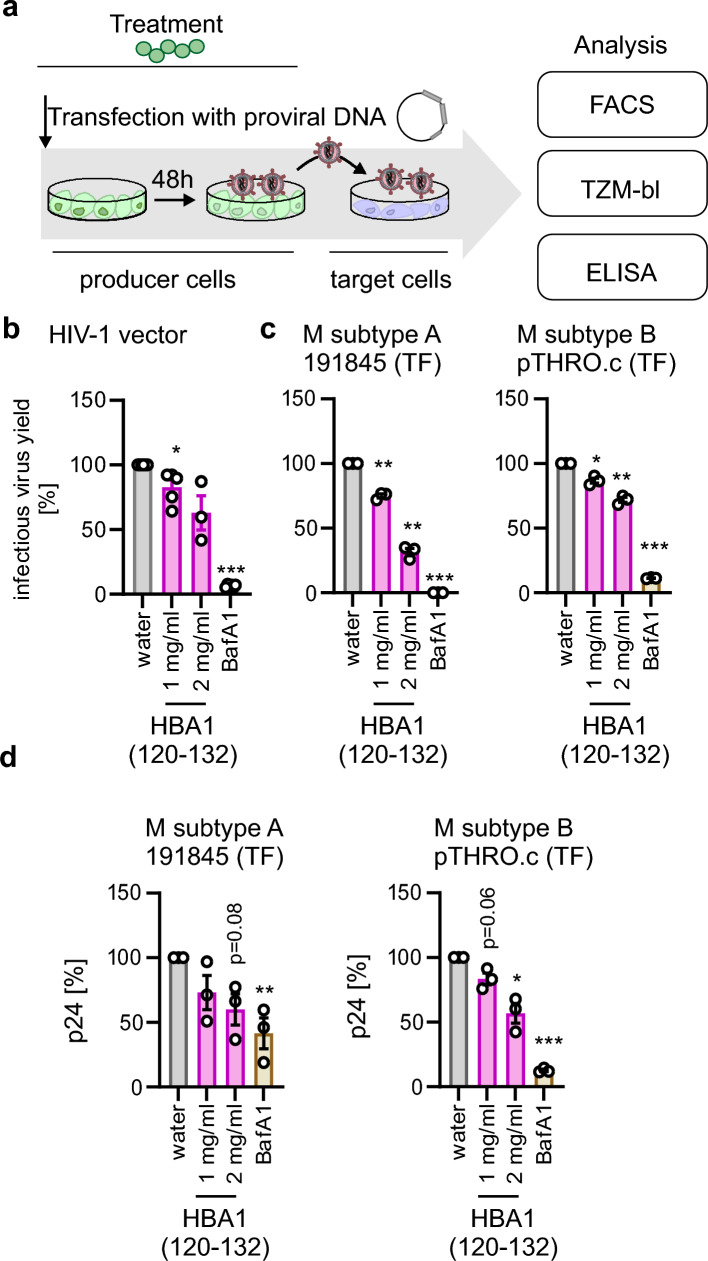
Autophagy is an evolutionarily ancient catabolic pathway and has recently emerged as an integral part of the innate immune system. While the core machinery of autophagy is well defined, the physiological regulation of autophagy is less understood. Here, we identify a C-terminal fragment of human hemoglobin A (HBA1, amino acids 111-132) in human bone marrow as a fast-acting non-inflammatory inhibitor of autophagy initiation. It is proteolytically released from full-length HBA1 by cathepsin E, trypsin or pepsin. Biochemical characterization revealed that HBA1(111-132) has an in vitro stability of 52 min in human plasma and adopts a flexible monomeric conformation in solution. Structure-activity relationship studies revealed that the C-terminal 13 amino acids of HBA1(120-132) are sufficient to inhibit autophagy, two charged amino acids (D127, K128) mediate solubility, and two serines (S125, S132) are required for function. Successful viruses like human immunodeficiency virus 1 (HIV-1) evolved strategies to subvert autophagy for virion production. Our results show that HBA1(120-132) reduced virus yields of lab-adapted and primary HIV-1. Summarizing, our data identifies naturally occurring HBA1(111-132) as a physiological, non-inflammatory antagonist of autophagy. Optimized derivatives of HBA1(111-132) may offer perspectives to restrict autophagy-dependent viruses.

Keywords: Autophagy; HIV; Hemoglobin; Innate immunity.


Conflict of interest statement

DRT collaborated with Novartis Pharma AG (Basel, Switzerland), Probiodrug (Halle (Saale), Germany), GE Healthcare (Amersham, UK), and Janssen Pharmaceutical Companies (Beerse, Belgium). All other authors declare no conflict of interest.

Figures

Fig. 1
Fig. 1
Identification of HBA1(111–132) in autophagy inhibiting fractions of a human bone marrow library. a–c Autophagosome levels in HeLa reporter cells stably expressing GFP-LC3B (HeLa GL) as assessed by flow cytometry 4 h post treatment with fractions of a human bone marrow peptide library (a), subfractions of human bone marrow fraction 25 (b), subfractions of human bone marrow library 25.40 (c). Fraction numbers are indicated. Water control set to 0. Bars represent mean of n = 3 ± SEM. CQ, Chloroquine (1 µM). Rapa, Rapamycin (1 µM). Absorbance at 214 nm is displayed as red line (right y-axis). d Pearson’s correlation between activity (autophagosome levels) and abundance (peptide intensity) of the hundred most abundant hits (x-axis). Significance of the correlation, -log(p) (y-axis). Red dot indicates HBA1(111–132). e Autophagy modulating activity in BM.25.40.26–30 as in (c) and mass spectrometry intensity for HBA1(111–132) in indicated fraction
Fig. 2
Fig. 2
HBA1(111–132) reduces autophagic flux. a Autophagosome levels in HeLa GL cells assessed by flow cytometry 4 h post treatment with full-length HBA1 and synthesized HBA1(111–132) in a concentration range of 1 mg/ml–7.8 µg/ml. Red dotted line indicates the standard error. Dots represent mean of n = 3 ± SEM. b Membrane integrity of HeLa GL cells after treatment with varying concentrations (1 mg/ml–7.8 µg/ml) of HBA1(111–132) for 4 h, assessed by flow cytometry. Bars represent mean of n = 3 ± SEM. c Autophagosome levels in HeLa GL cells assessed by flow cytometry at indicated time points (15 min–6 h) post treatment with synthesized HBA1(111–132) at a concentration of 1 mg/ml. Dots represent mean of n = 3 ± SEM. d Abundance of synthesized HBA1(111–132) after incubation in human plasma at different time points as monitored by mass spectrometry. Small dotted lines indicate the 95% confidence interval. Big dotted line indicates 50% abundance. n = 9 (3 technical replicates of 3 biological replicates) ± SEM. e Heatmap of fragments originating from synthesized HBA1(111–132) after incubation with human plasma. Abundance % represents the intensity ratio of the respective fragment in regard to the total intensities of all fragments at this time point as assessed via mass spectrometry.
Fig. 3
Fig. 3
Biochemical analyses and origin of HBA1(111–132). a Visualization of full-length hemoglobin with amino acid sequence 111–132 highlighted in red. Structure derived from PDB: 6BB5. b–c Circular dichroism spectrum of full-length recombinant HBA1 (b) and HBA1(111–132) (c) in 10 mM PBS pH = 7.4 at 25 °C. d Exemplary SDS-PAGE of digested full-length hemoglobin with indicated proteases. Stained using Coomassie Brilliant Blue. HBA1 FL, Hemoglobin A full-length. e Identification of HBA1 fragments from mass spectrometry analysis of gel section at expected height of HBA1(111–132) in (d). Color code represents the signal intensity as analyzed by label-free mass spectrometry. Cathepsin (cath)
Fig. 4
Fig. 4
HBA1(111–132) inhibits early autophagy without causing inflammation. a Quantification of autophagosome levels in HeLa stably expressing GFP-LC3B reporter cells 4 h post treatment with HBA1(111–132) (2 mg/ml – 0.1 mg/ml) (lower panel) and co-treated with 20 µM Chloroquine (CQ) (upper panel) by flow cytometry. Dots represent mean of n = 3 ± SEM. b Exemplary immunoblot analysis of LC3B‑I/-II levels in HeLa cells treated for 4 h with HBA1(111–132) (1 mg/ml), CQ (2 µM) and Torin-1 (1.25 µM). Lower panel: Corresponding quantification of band intensity ratio from LC3B-I to LC3B-II, normalized to mock control. Bars represent mean of n = 3 ± SEM. c Flow cytometry analysis of permeabilized (Tween +) and non-permeabilized (Tween-) HeLa cells treated for 30 min with V5-tagged HBA1(111–132) (1 mg/ml) or mock. n = 3–5 ± SEM. d-e Quantification of NF-κB driven SEAP expression (d) or ISRE driven luciferase expression (e) in THP1-Dual cells treated with HBA1(111–132) (1 mg/ml–2 µg/ml). Sendai virus (SeV, MOI 0.03) was used as a positive control. Bars represent mean of n = 3 ± SEM. Student’s t-test with Welch correction or two-way ANOVA (c). *p < 0.05; **p < 0.01; ***p < 0.001
Fig. 5
Fig. 5
Structure activity relationship studies on HBA1(111–132). a Schematic depiction of the synthesized variants of HBA1. b Quantification of the autophagosome levels in HeLa GL via flow cytometry 4 h post treatment with indicated HBA1 fragments (a) at a concentration of 250 µg/ml. Bars represent mean of n = 6–12 ± SEM. c Analysis of autophagosomes in HeLa GL treated with HBA1(120–132) (250 µg/ml, 0.5 mg/ml, 1 mg/ml) for 4 h, assessed by flow cytometry. d Representative confocal microscopy images of GFP-LC3B (green) puncta formation in HeLa GL cells, treated for 4 h with HBA1(111–132) (1 mg/ml), HBA1(120‑132) (1 mg/ml), Chloroquine (CQ, 10 µM), Torin-1 (1 µM). Scale bar, 10 µm. DAPI (blue), nuclei. e Quantitative analysis of the LC3B-GFP area per cell of the data in (d). Lines represent geometric mean with 95% confidence interval, n = 32–110. Dotted line represents the geometric mean of the water sample. f Quantification of autophagosome levels in HeLa GL cells after 4 h of treatment with indicated version of HBA1(120–132) and co-treatment of 20 µM Chloroquine (CQ). Bars represent mean of n = 10–24 ± SEM. g Assessment of solubility of peptides indicated in (f) via optical density measurement of respective mutation of HBA1(120–132) in PBS. Student’s t-test with Welch correction. *p < 0.05; **p < 0.01; ***p < 0.001
Fig. 6
Fig. 6
HBA1(120–132) inhibits HIV-1 production. a Schematic depiction of virus production and treatment procedure. 15 min before transfection HEK293T cells are treated with HBA1(120–132) or BafA1 (Bafilomycin A1, 250 nM). Cells are then transfected with a pro-viral construct and medium is changed 16 h post transfection. Cells are re-treated with HBA1(120–132) 16 h and 24 h post transfection. After 48 h, supernatant (SN) is transferred to reporter cells (TZM-bl) and 2 days post infection reporter cells are analyzed, either via β-galactosidase assay or flow cytometry. Additionally, the supernatant is analyzed for the presence of p24 capsid protein. b Infectious virus yields as assessed by GFP flow cytometry of TZM-bl cells infected with SN from HEK293T transfected with a lentiviral vector, VSV-G, HIV-1 rev and gag/pol and treated as in (a). The number of infected (GFP +) cells was normalized to water control. Bars represent the mean of n = 3–6 ± SEM. c Infectious virus yields of HEK293T cells transfected with indicated primary transmitted founder (TF) HIV infectious molecular clones as assessed by β-galactosidase assay of TZM-bl 72 h post infection. Treatment with HBA1(120-132) as in (a). BafA1 (Bafilomycin A1, 250 nM). Bars represent the mean of n = 3 ± SEM. d ELISA quantifying HIV-1 48 h post transfection p24 in the supernatant of HEK293T transfected with indicated pro-viral constructs and treated with different amounts of HBA1(120–132). Bars represent mean of n = 3 ± SEM. b, c Student’s t-test with Welch correction. d Ratio paired t test. *p < 0.05; **p < 0.01; ***p < 0.001

References

    1. Levine B, Mizushima N, Virgin HW (2011) Autophagy in immunity and inflammation. Nature 469:323–335. 10.1038/nature09782 - PMC - PubMed
    1. Choi Y, Bowman JW, Jung JU (2018) Autophagy during viral infection - a double-edged sword. Nat Rev Microbiol 16:341–354. 10.1038/s41579-018-0003-6 - PMC - PubMed
    1. Klute S, Sparrer KMJ (2024) Friends and foes: the ambivalent role of autophagy in HIV-1 infection. Viruses 16:500. 10.3390/v16040500 - PMC - PubMed
    1. Kim J, Kundu M, Viollet B, Guan K-L (2011) AMPK and mTOR regulate autophagy through direct phosphorylation of Ulk1. Nat Cell Biol 13:132–141. 10.1038/ncb2152 - PMC - PubMed
    1. Hoenigsperger H, Koepke L, Acharya D et al (2023) CSNK2 suppresses autophagy by activating FLN-NHL-containing TRIM proteins. Autophagy. 10.1080/15548627.2023.2281128 - PMC - PubMed

Substances

LinkOut - more resources