. 2025 Apr;32(2):760-769.
doi: 10.3758/s13423-024-02577-2. Epub 2024 Sep 17.

An object numbering task reveals an underestimation of complexity for typically structured scenes

Affiliations

An object numbering task reveals an underestimation of complexity for typically structured scenes

Alex A Carter et al. Psychon Bull Rev. 2025 Apr.

Abstract

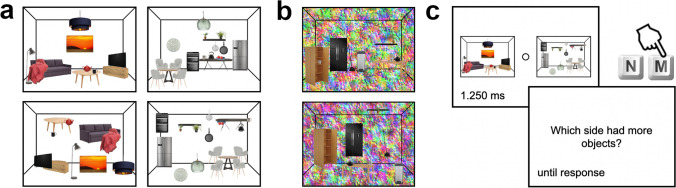
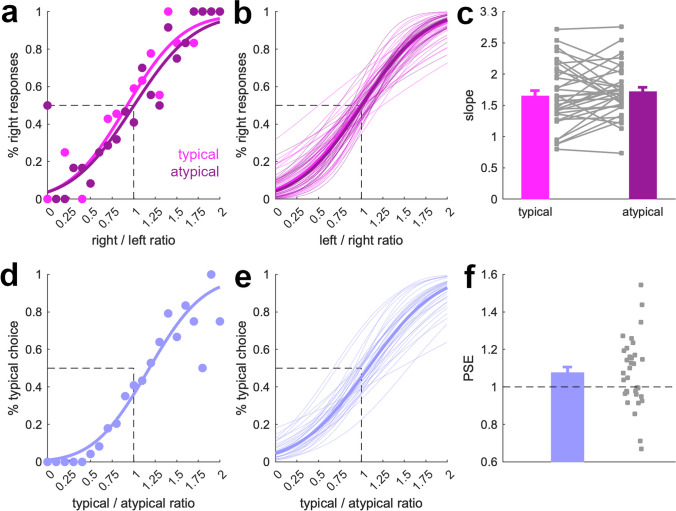
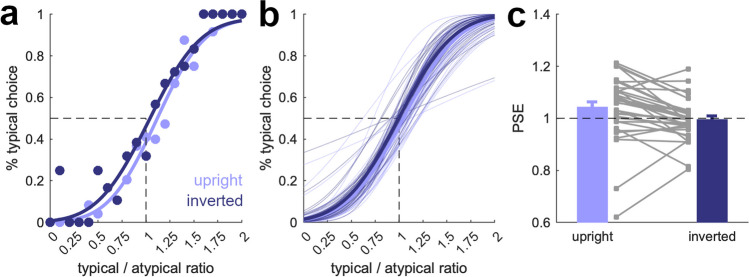
Our visual environments are composed of an abundance of individual objects. The efficiency with which we can parse such rich environments is remarkable. Previous work suggests that this efficiency is partly explained by grouping mechanisms, which allow the visual system to process the objects that surround us as meaningful groups rather than individual entities. Here, we show that the grouping of objects in typically and meaningfully structured environments directly relates to a reduction of perceived complexity. In an object numerosity discrimination task, we showed participants pairs of schematic scene miniatures, in which objects were structured in typical or atypical ways and asked them to judge which scene consisted of more individual objects. Critically, participants underestimated the number of objects in typically structured compared with atypically structured scenes, suggesting that grouping based on typical object configurations reduces the perceived numerical complexity of a scene. In two control experiments, we show that this overestimation also occurs when the objects are presented on textured backgrounds, and that it is specific to upright scenes, indicating that it is not related to basic visual feature differences between typically and atypically structured scenes. Together, our results suggest that our visual surroundings appear less complex to the visual system than the number of objects in them makes us believe.

Keywords: Complexity; Numerosity; Object regularities; Scene perception.


Conflict of interest statement

Declarations. Conflicts of interest: The authors have no competing interests to declare. Ethics approval: Procedures were approved by the general ethical committee of the Justus Liebig University Gießen. Consent to participate: Each participant provided written informed consent prior to the experiments. Consent for publication: Each participant provided written informed consent to sharing their data publicly in anonymized form.

Figures

Fig. 1
Fig. 1
Stimuli and paradigm. a Stimuli were schematic scene miniatures (kitchens and living rooms), consisting of 10 to 20 individual objects. Scenes could be typically structured, resembling real-world regularities in object configurations (top row), or atypically structured, with object locations shuffled (bottom row). Examples show rooms with 10 objects (left column) or 20 objects (right column). b In Experiment 2, the same scene miniatures were shown on a colored texture background, as illustrated. c On each experimental trial, participants were asked to judge which of two simultaneously presented scenes contained more objects
Fig. 2
Fig. 2
Results from Experiment 1. First, we fitted participant-specific psychometric functions to trials in which either two typically structured scenes or two atypically structured scenes were shown. a Data and psychometric functions for an example participant. b Psychometric functions based on the average slope and PSE across participants (bold lines) and for all individual participants (fine lines). c Slopes were shallower when object numerosities were discriminated between two typically structured scenes than when they were discriminated between two atypically structured scenes. Error bars show standard errors of the mean. Gray squares are data from individual participants. Second, we fitted psychometric functions to trials in which a typically structured scene was shown together with an atypically structured scene. d Data and psychometric function for an example participant. e Psychometric functions based on the average slope and PSE across participants (bold lines) and for all individual participants (fine lines). f PSEs were shifted positively, indicating an underestimation of numerosity in typically structured, compared with atypically structured, scenes. Error bars show standard errors of the mean. Gray squares are data from individual participants
Fig. 3
Fig. 3
Results from Experiment 2. First, we fitted participant-specific psychometric functions to trials in which either two typically structured scenes or two atypically structured scenes were shown. a Data and psychometric functions for an example participant. b Psychometric functions based on the average slope and PSE across participants (bold lines) and for all individual participants (fine lines). c Slopes were shallower when object numerosities were discriminated between two typically structured scenes than when they were discriminated between two atypically structured scenes. Error bars show standard errors of the mean. Gray squares are data from individual participants. Second, we fitted psychometric functions to trials in which a typically structured scene was shown together with an atypically structured scene. d Data and psychometric function for an example participant. e Psychometric functions based on the average slope and PSE across participants (bold lines) and for all individual participants (fine lines). f PSEs were shifted positively, indicating an underestimation of numerosity in typically structured, compared with atypically structured, scenes. Error bars show standard errors of the mean. Gray squares are data from individual participants
Fig. 4
Fig. 4
Results from Experiment 3. Here, we examined trials, in which a typically structured scene was shown together with an atypically structured scene (as in Fig. 2d–f). We fitted participant-specific psychometric functions separately for trials in which the scenes were upright or inverted. a Data and psychometric functions for an example participant. b Psychometric functions based on the average slope and PSE across participants (bold lines) and for all individual participants (fine lines). c For the upright scenes, PSEs were shifted positively, replicating the result from Experiment 1. This shift was absent for inverted scenes. Error bars show standard errors of the mean. Gray squares are data from individual participants

References

    1. Anobile, G., Cicchini, G. M., & Burr, D. C. (2016). Number as a primary perceptual attribute: A review. Perception,45(1/2), 5–31. - PMC - PubMed
    1. Biederman, I., Mezzanotte, R. J., & Rabinowitz, J. C. (1982). Scene perception: Detecting and judging objects undergoing relational violations. Cognitive Psychology,14(2), 143–177. - PubMed
    1. Brainard, D. H. (1997). The psychophysics toolbox. Spatial Vision,10(4), 433–436. - PubMed
    1. Chakravarthi, R., Nordqvist, A., Poncet, M., & Adamian, N. (2023). Fundamental units of numerosity estimation. Cognition,239, 105565. - PubMed
    1. Feigenson, L., Dehaene, S., & Spelke, E. (2004). Core systems of number. Trends in Cognitive Sciences,8(7), 307–314. - PubMed

LinkOut - more resources