. 2024 Sep 17;15(1):8136.
doi: 10.1038/s41467-024-52276-8.

Atomic vacancies of molybdenum disulfide nanoparticles stimulate mitochondrial biogenesis

Affiliations

Atomic vacancies of molybdenum disulfide nanoparticles stimulate mitochondrial biogenesis

Kanwar Abhay Singh et al. Nat Commun. .

Abstract

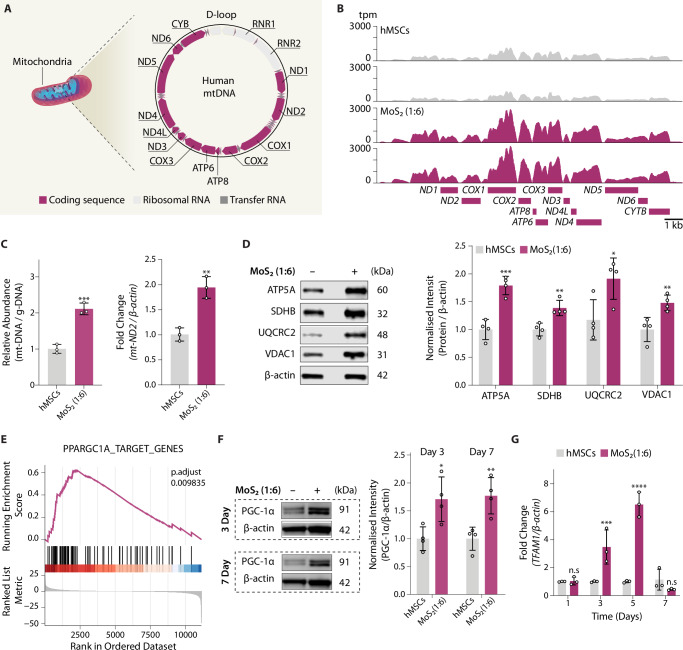
Diminished mitochondrial function underlies many rare inborn errors of energy metabolism and contributes to more common age-associated metabolic and neurodegenerative disorders. Thus, boosting mitochondrial biogenesis has been proposed as a potential therapeutic approach for these diseases; however, currently we have a limited arsenal of compounds that can stimulate mitochondrial function. In this study, we designed molybdenum disulfide (MoS2) nanoflowers with predefined atomic vacancies that are fabricated by self-assembly of individual two-dimensional MoS2 nanosheets. Treatment of mammalian cells with MoS2 nanoflowers increased mitochondrial biogenesis by induction of PGC-1α and TFAM, which resulted in increased mitochondrial DNA copy number, enhanced expression of nuclear and mitochondrial-DNA encoded genes, and increased levels of mitochondrial respiratory chain proteins. Consistent with increased mitochondrial biogenesis, treatment with MoS2 nanoflowers enhanced mitochondrial respiratory capacity and adenosine triphosphate production in multiple mammalian cell types. Taken together, this study reveals that predefined atomic vacancies in MoS2 nanoflowers stimulate mitochondrial function by upregulating the expression of genes required for mitochondrial biogenesis.


Conflict of interest statement

The authors declare the following competing interests. A.K.G., K.A.S., V.M.G., and I.S. have filed a patent application related to the work presented in this article. The remaining authors declare no competing interests.

Figures

Fig. 1
Fig. 1. Synthesis and characterization of MoS2 nanoflowers with predefined atomic vacancies.
A Atomic arrangement of Mo and S in 2D MoS2. Changing molybdenum: sulfur precursor ratio leads to the formation of MoS2 with different degrees of atomic vacancies. Transmission electron microscopy (TEM) images show MoS2 nanoflower assembly consisting of multiple individual MoS2 nanosheets. X-ray diffraction (XRD) peaks of MoS2 nanoflowers (002, 100, 110) show the presence of hexagonal crystal structure. B X-ray photoelectron spectra (XPS) show the binding energies (BE) for Mo and S within MoS2 nanoflowers. 1 T (trigonal prismatic) and 2H phase (hexagonal symmetry) within the trigonal prismatic MoS2 crystal. C Cyclic voltagrams for MoS2 coated electrode in comparison with standard uncoated electrode. The density of active sites calculated from these voltagrams are presented in the table in moles/g. The density of active sites increases with increasing sulfur precursor ratio. D The effect of MoS2 nanoflowers concentration (with differing degree of atomic vacancies) on cell viability in hMSCs following 24 h of exposure. MoS2 nanoflowers exhibit half-inhibitory concentration (IC50) of ~400 µg/mL. (data represented as mean ± SD, with n = 4 biological replicates). E Cell membrane integrity in presence of MoS2 was determined by monitoring release of LDH in media following 24 h of exposure. No significant effect of atomic vacancies is observed at lower concentration ( < IC50) of MoS2 nanoflowers.(data represented as mean ± SD, with n = 4 biological replicates). F Effect of atomic vacancies of MoS2 nanoflowers (1:6) on cell cycle is determined after 72 h. (data represented as average cell population within each phase of the cell cycle, with n = 3 biological replicates). G Internalization of MoS2 nanoflower (1:6) is evident from fluorescence images of cells after 24 h. Green: MoS2 nanoflowers, Purple: actin cytoskeleton. Blue: DAPI, nucleus. H Cellular internalization of MoS2 nanoflowers was determined using ICP-MS elemental analysis following 18 h of exposure to nanoflowers. The levels of Mo are plotted for hMSCs treated with and without MoS2 nanoflowers. (Data represented as mean ± SD, with n = 3 biological replicates. Statistical significance was determined using one way ANOVA with post hoc Tukey test, *p < 0.05; **p < 0.01, ***p < 0.001).
Fig. 2
Fig. 2. Role of atomic vacancies of MoS2 on transcriptomic profile of human mesenchymal stem cells.
A Principal component analysis (PCA) of hMSC samples treated with MoS2 nanoflower with predefined atomic vacancies (1:1 (blue) and 1:6 (purple)) based on mRNA expression obtained from RNA-seq (n = 2, technical replicates). Untreated hMSCs are used as control (gray). The PCA was done on the mRNA expression (Log2FPKM) of 20% of the most variable genes across all samples (n = 2214). B MA plot showing differences in gene expression [Log2(fold change)] between hMSC samples treated with MoS2 nanoflower (1:1 and 1:6). Genes with significantly high expression are shown in red (P-adj < 0.05), while genes with significantly low expression (P-adj < 0.05) are shown in blue. Gray denotes genes that do not significantly exhibit differences. C Hierarchical clustering of hMSC samples treated with MoS2 nanoflower (1:1 and 1:6) based on mRNA expression obtained from RNA-seq. The heatmap shows the DEGs (Log2FPKM of DEGs; P-adj < 0.05) across all treatment groups compared with control hMSC samples (red, up-regulated; blue, down-regulated). The total number of distinct DEGs across all samples is 2214. D Semantic comparisons of GO annotations for hMSC samples treated with MoS2 nanoflower (1:6), resulting in seven broad clusters of GO terms: morphogenesis, extracellular matrix, cell−matrix regulation, cellular locomotion component, mitochondrial electron chain transport, triphosphate metabolic, and protein catabolic targeting membrane.
Fig. 3
Fig. 3. Effect of atomic vacancies in MoS2 nanoflowers on nuclear-encoded mitochondrial genes.
A Heatmap showing the DEGs (Log2FPKM of DEGs; P-adj < 0.01) known to encode mitochondrial proteins. Samples treated with vacancy rich MoS2 show consistent upregulation of mitochondrial genes as compared to untreated hMSC samples. B Volcano plot highlighting genes involved in mitochondrial ATP synthesis coupled proton transport (GO:0042776) and mitochondrial electron transport, cytochrome c to oxygen (GO:0006123) for high vacancies MoS2 nanoflowers (1:6). Gray, all of the expressed genes; Blue, all genes associated with the GO term; Red, genes associated with the GO term that show significant difference. MoS2 nanoflowers with high atomic vacancies enhance the transcription of key MRC genes, including those in the adenosine triphosphate (ATP) and mitochondrial cytochrome c oxidase (COX) families. C RNA-seq tracks showing normalized mRNA expression (aligned reads normalized by total library size—transcript per million (TPM)) at the genomic locus of ATP5E and COX5A. D GSEA shows positive enrichment of MRC related terms. Positive NES indicates a significant number of genes belonging to these processes are upregulated. E GSEA enrichment results showing NES for Hallmark: Reactive oxygen species, Hallmark: OXPHOS and Hallmark: Fatty acid metabolism for MoS2 (1:6) treatment. The vertical black lines (bar code) represent the projection onto the ranked gene list of individual genes of the gene set. The horizontal bar in graded color from red (left) to blue (right) represents the gene list ranked from up-regulated on the left to down-regulated on the right. F Sub-cellular localization of MoS2 nanoflowers was determined by co-staining mitochondrial (green) and MoS2 nanoflowers (purple). The nucleus and mitochondria were stained using DAPI and Mito tracker red, respectively. The arrow points towards MoS2 nanoflowers that were visualized using reflective light imaging. G Quantification of mitochondrial morphology with and without MoS2 exposure by Mito Hacker analysis. Mitochondrial network parameters were graphed to observe any effect of MoS2 on mitochondrial morphology. (Data represented volin plots with horizontal lines indicating the median and quartiles. n = 28 cells analyzed from three distinct sets of confocal images. Statistical significance was determined using two-tailed student t test, n.s. p > 0.05).
Fig. 4
Fig. 4. Treatment with MoS2 nanoflowers stimulates mitochondrial biogenesis.
A Schematic showing mitochondrial genome (mt-DNA), indicating mitochondrial encoded proteins. B Visualization of mitochondrial gene expression in cells with and without MoS2 (1:6) treatment. Data indicates enhanced expression of the entire mitochondrial genome in cells treated with MoS2 (1:6). C The effect of high atomic vacancies MoS2 on mitochondrial biogenesis. A significant increase in mt-DNA encoded transcript (ND2), as well as copy number (mitochondrial DNA / nuclear DNA), shows that MoS2 (1:6) treatment results in a significant increase in mitochondrial biogenesis. (Data represented as mean ± SD, with n = 3 biological replicates. Statistical significance was determined using two-tailed student t test, *p < 0.05; **p < 0.01, ***p < 0.001). D Western blotting is used to determine the relative expression of key mitochondrial proteins. MoS2 (1:6) treatment results in significant upregulation of ATP5B, SDHB, UQCRC2, VDAC1 (Data represented as mean ± SD, with n = 4 biological replicates. Statistical significance was determined using one-tailed student t test, *p < 0.05; **p < 0.01, ***p < 0.001). E GSEA enrichment of C3: Regulatory Target (TFT: Transcription Factor Targets) for cells following treatment with MoS2 (1:6). F Relative protein levels of PGC-1α in cells following treatment with MoS2 (1:6) were evaluated using Western blotting. MoS2 treated cells show increased expression of PGC-1α at both 3 and 7 days respectively, following treatment. (Data represented as mean ± SD, with n = 4 biological replicates. Statistical significance was determined using two-tailed student t test, *p < 0.05; **p < 0.01). G Temporal expression of TFAM was monitored for 7 days with and without MoS2 (1:6) treatment. A 6-fold increase in peak expression due to treatment with MoS2 (1:6) was observed. (Data represented as mean ± SD, with n = 4 biological replicates. Statistical significance was determined using two-way ANOVA with Sidak multiple comparisons tests, n.s. p > 0.05, *p < 0.05; **p < 0.01, ***p < 0.001, ****p < 0.0001).
Fig. 5
Fig. 5. High atomic vacancy MoS2 decreases oxidative stress and enhances mitochondrial bioenergetics.
A The effect of MoS2 on OCR was determined in C2C12 cells treated with different concentrations of MoS2 (1:6) (0, 10 and 25 µg/mL). A concentration-dependent increase in spare respiratory capacity was observed, indicating the ability of MoS2 to activate mitochondrial respiration machinery. (n = 3 biological replicates). B Evaluation of ATP levels in cells treated with MoS2 (1:6) suggests a marked increase in ATP levels, compared to untreated hMSCs. (n = 4 biological replicates). C Effect of MoS2 on mitochondrial membrane potential. Cells treated with MoS2 (1:6) showed no significant changes in mitochondrial membrane potential as compared to untreated cells. Cell number variation was normalized using nuclear stain (DAPI). (n = 4 biological replicates). D The amount of intracellular ROS is determined before and after treatment with MoS2 (1:6). MoS2 treatment significantly suppressed ROS production. (n = 3 biological replicates). E The amount of mitochondrial ROS is determined using MitoSox before and after treatment with MoS2 nanoflowers (1:6). MoS2 treatment significantly suppressed mitochondrial ROS production. (n = 3 biological replicates). F RNA-seq data demonstrates the upregulation of multiple genes related to antioxidant activity (GO: 0016209). G PGC-1α expression in C2C12 transduced with either empty vector (pLKO) or shRNA targeting PGC-1α (n = 3 biological replicates). H Evaluation of relative mitochondrial copy number in transduced cells following treatment with MoS2 for 72 h. (n = 3 biological replicates). I Mitochondrial copy number in hMSCs following treatment with N-acetyl cysteine (NAC), resveratrol, and vacancy-rich MoS2. Cells were treated with either NAC (3 mM), resveratrol (25 µm), or MoS2 (1:6) (25 µg/mL) for 72 h. (n = 3 biological replicates). J Proposed mechanism of action of MoS2 with high atomic vacancies on triggering mitochondrial biogenesis. It is expected that atomic vacancies of MoS2 exhibit free radical scavenging activity through rapid reactions with reactive oxygen species (ROS), including hydrogen peroxide (H2O2), superoxide anions (O2•−), and hydroxyl radicals (OH). Reduction in intracellular ROS due to the presence of atomic vacancies on MoS2 is expected to trigger the SIRT1/PGC1α/NRF2 pathway. For (A), (B), (C), (D), (E), (G), (H), and (I), data represented as mean ± SD. For (C), (D), (E), (I) Statistical significance was determined using one way ANOVA with post hoc Tukey test. For (G), (H) Statistical significance was determined using a two-tailed student t test. For all data sets n.s. p > 0.05, *p < 0.05, **p < 0.01, ***p < 0.001, ****p < 0.0001.

References

    1. Friedman, J. R. & Nunnari, J. Mitochondrial form and function. Nature505, 335–343 (2014). - PMC - PubMed
    1. Nunnari, J. & Suomalainen, A. Mitochondria: in sickness and in health. Cell148, 1145–1159 (2012). - PMC - PubMed
    1. Seimon, R. V. et al. Effect of weight loss via severe vs moderate energy restriction on lean mass and body composition among postmenopausal women with obesity: the TEMPO diet randomized clinical trial. JAMA Netw. Open2, e1913733 (2019). - PMC - PubMed
    1. Park, Y. M. et al. Estradiol-mediated improvements in adipose tissue insulin sensitivity are related to the balance of adipose tissue estrogen receptor α and β in postmenopausal women. PLoS One12, e0176446 (2017). - PMC - PubMed
    1. Khalid, A. B. & Krum, S. A. Estrogen receptors alpha and beta in bone. Bone87, 130–135 (2016). - PMC - PubMed

Publication types

Associated data

LinkOut - more resources