. 2024 Sep 17;15(1):8159.
doi: 10.1038/s41467-024-52340-3.

Distinct mechanisms regulate ventricular and atrial chamber wall formation

Affiliations

Distinct mechanisms regulate ventricular and atrial chamber wall formation

Marga Albu et al. Nat Commun. .

Abstract

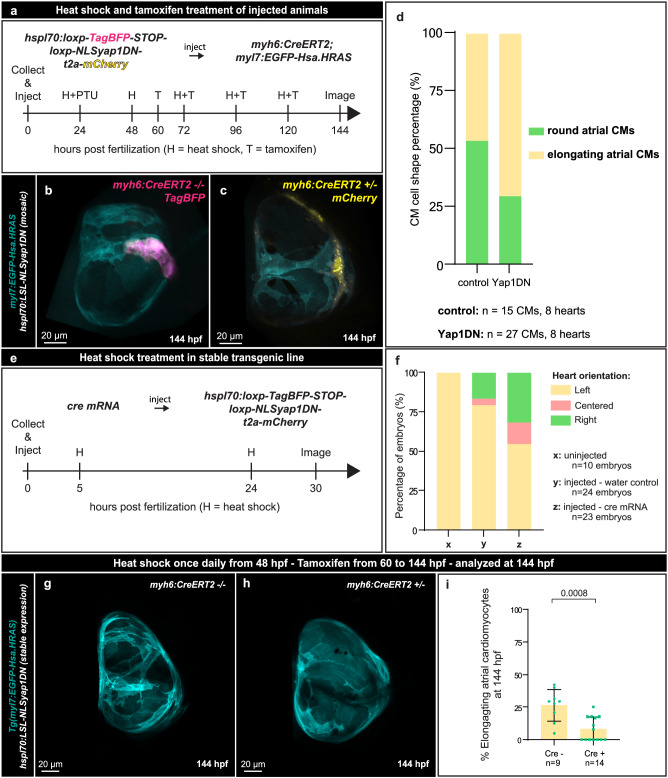
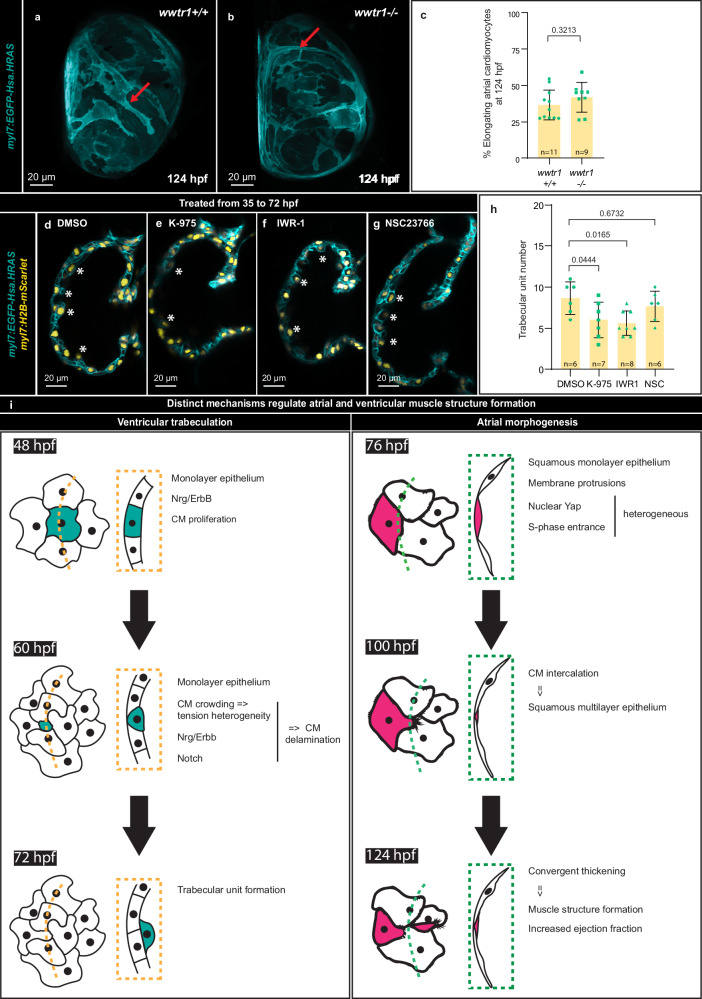
Tissues undergo distinct morphogenetic processes to achieve similarly shaped structures. In the heart, cardiomyocytes in both the ventricle and atrium build internal structures for efficient contraction. Ventricular wall formation (trabeculation) is initiated by cardiomyocyte delamination. How cardiomyocytes build the atrial wall is poorly understood. Using longitudinal imaging in zebrafish, we found that at least 25% of the atrial cardiomyocytes elongate along the long axis of the heart. These cell shape changes result in cell intercalation and convergent thickening, leading to the formation of the internal muscle network. We tested factors important for ventricular trabeculation including Nrg/ErbB and Notch signaling and found no evidence for their role in atrial muscle network formation. Instead, our data suggest that atrial cardiomyocyte elongation is regulated by Yap, which has not been implicated in trabeculation. Altogether, these data indicate that distinct cellular and molecular mechanisms build the internal muscle structures in the atrium and ventricle.


Conflict of interest statement

The authors declare no competing interests.

Figures

Fig. 1
Fig. 1. A subset of atrial cardiomyocytes gradually elongate along the long axis of the heart.
a Schematic of 3D longitudinal imaging. Created with BioRender.com, released under a Creative Commons Attribution-NonCommercial-NoDerivs 4.0 International license. b, b’ 3D image processing used throughout the study. 3D airyscan images of a 100 hpf larva showing both the atrium and ventricle (b) and only the atrium (b’) after 3D cropping in Imaris; CM membranes shown in cyan (myl7:EGFP-Hsa.HRAS) and CM nuclei in yellow (myl7:H2B-mScarlet); magenta square and arrow indicate cropped region; the solid line in b’ is the longest line through one atrial CM, and the dashed lines show how the angle (relative to the AVC) of the highlighted atrial CM (yellow dashed outline) was measured. ce’ 3D airyscan longitudinal imaging of the atrium at 100, 124, and 146 hpf; CM membranes shown in cyan (myl7:EGFP-Hsa.HRAS) and CM nuclei in yellow (myl7:H2B-mScarlet); one elongating CM shown in 3D (magenta). f 3D quantification of atrial CM shape at 76, 100, and 124 hpf (n = 43 atrial CMs from 6 hearts at 76 hpf, and n = 44 atrial CMs from 6 hearts at 100 and 124 hpf; each data point represents one atrial CM; average of 8 CMs per heart; ordinary one-way ANOVA with Tukey’s multiple comparison test). g Percentage of elongating atrial CMs at 76, 100, and 124 hpf (n = 6 hearts for all time points; each data point represents one heart; average of 20 CMs per heart; Kruskal-Wallis test with Dunn’s multiple comparison test). hh”, Atrial CM angle measured at 76, 100, and 124 hpf (n = 43 atrial CMs from 6 hearts at 76 hpf, and n = 44 atrial CMs from 6 hearts at 100 and 124 hpf; each data point represents one atrial CM; average of 8 CMs per heart; Kruskal-Wallis test with Dunn’s multiple comparison test; 76 vs 100 hpf p-value = 0.32*10−4, 76 vs 124 hpf p-value = 0.67*10−7). Error bars are mean ± SD.
Fig. 2
Fig. 2. Atrial cardiomyocyte elongation leads to cell intercalation and convergent thickening.
ad 3D airyscan imaging of the same larva every 12 h from 82 to 118 hpf; CM membranes shown in white (myl7:mCherry-CAAX) and mosaic CM cytoplasmic expression in magenta (myl7:mTagBFP2). a’d” 3D segmentation of two elongating and intercalating CMs reconstructed with opaque (a’d’) and transparent (a”d”) surfaces, revealing cell intercalation; orange arrow points to the segmented CMs; squares and dashed lines indicate cross-section region. a”’d”’, Cross-sections through elongating atrial CMs; dashed lines outline the two intercalating CMs; N-cadherin shown in cyan (cdh2:cdh2-EGFP); lat–lateral adhesion; ap–apical adhesion, ba – basal adhesion; (ad”’) all 3D surfaces of the mTagBFP2+ CM shown in magenta and all 3D surfaces of the mTagBFP2- CM in white. e, f Outer surface views of 3D airyscan images of the same atrium at 76 hpf and 7 dpf; CM membranes shown in cyan (myl7:EGFP-Hsa.HRAS) and CM nuclei in yellow (myl7:H2B-mScarlet). e’, f’ Inner surface views of the same 3D airyscan images at 76 hpf and 7 dpf; orange arrows point to CMs in the inner ridges.
Fig. 3
Fig. 3. Elongated cardiomyocytes form the inner atrial muscle structures.
ac 3D surface rendering of a 14 dpf fixed atrium; outer layer myocardium shown in white and inner layer myocardium in cyan. a’c’ 3D confocal image of the atrium from which the surface rendering was created; CM membranes shown in white for outer layer CMs and in cyan for inner layer CMs; all CM nuclei are shown in yellow.
Fig. 4
Fig. 4. Atrial cardiomyocytes elongate through membrane protrusion formation.
a Schematic of the membrane protrusion labeling of a few CMs, i.e., mosaic expression of the PH domain of Akt1 in CMs. Created with BioRender.com, released under a Creative Commons Attribution-NonCommercial-NoDerivs 4.0 International license. bd’ 3D airyscan imaging at 76, 100, and 124 hpf; CM membranes shown in white (myl7:EGFP-Hsa.HRAS) and PH-Akt1 localization in magenta (myl7:PH-Akt1-tdTomato-PEST). e, f 3D confocal images of the atrium from control sibling and IRSp53DN overexpressing (myl7:gal4; UAS:IRSp53DN-RFP) larvae at 124 hpf; CM membranes shown in white (myl7:EGFP-Hsa.HRAS). g Percentage of elongating atrial CMs in 124 hpf control sibling and IRSp53DN overexpressing larvae (n = 9 control and n = 8 IRSp53DN; each data point represents one heart; two-tailed Mann-Whitney test). hh”, Atrial CM angle measured in 124 hpf control siblings and IRSp53DN overexpressing larvae (n = 109 atrial CMs from 9 control hearts and n = 102 atrial CMs from 8 IRSp53DN overexpressing hearts; each data point represents one atrial CM; two-tailed Mann-Whitney test). i, j 3D confocal images of the atrium from DMSO-treated (i) and Rac1 inhibitor-treated (j) larvae at 124 hpf; CM membranes shown in cyan (myl7:EGFP-Hsa.HRAS) and CM nuclei in yellow (myl7:H2B-mScarlet). k Percentage of elongating atrial CMs in DMSO- or Rac1 inhibitor-treated larvae at 124 hpf (n = 7 DMSO and n = 6 Rac1 inhibitor; each data point represents one heart; two-tailed Mann-Whitney test). ll”, Atrial CM angle measured in 124 hpf DMSO-treated and Rac1 inhibitor-treated larvae (n = 109 atrial CMs from 7 DMSO hearts and n = 105 atrial CMs from 6 Rac1 inhibitor hearts; each data point represents one heart; two-tailed Mann-Whitney test). Error bars are mean ± SD.
Fig. 5
Fig. 5. Hippo pathway inhibition affects atrial cardiomyocyte elongation.
ad 3D airyscan images of atria from 124 hpf larvae treated from 72 to 124 hpf with DMSO (a, c), K-975 (b), or IWR-1(d); CM membranes shown in cyan (myl7:EGFP-Hsa.HRAS) and CM nuclei in yellow (myl7:H2B-mScarlet). e, g 3D quantification of atrial CM shape in 124 hpf larvae treated from 72 to 124 hpf with DMSO, K-975, or IWR-1 (n = 41 atrial CMs from 4 DMSO hearts, n = 36 atrial CMs from K-975 hearts, n = 52 atrial CMs from 5 DMSO hearts, and n = 58 atrial CMs from 5 IWR-1 hearts; each data point represents one atrial CM; average of 10 CMs per heart two-tailed Mann-Whitney test (e); two-tailed unpaired Student’s t-test p-value = 0.48*10-4 (g)). ff”, hh”, Atrial CM angle measured in 124 hpf larvae treated from 72 to 124 hpf with DMSO, K-975, or IWR-1 (n = n = 41 atrial CMs from 4 DMSO hearts, n = 36 atrial CMs from 4 K-975 hearts, n = 49 atrial CMs from 5 DMSO hearts, and n = 59 atrial CMs from 5 IWR-1 hearts; each data point represents one atrial CM; average of 10 CMs per heart; two-tailed Mann-Whitney tests). Error bars are mean ± SD.
Fig. 6
Fig. 6. Yap modulates atrial cardiomyocyte elongation.
a Schematic of mosaic Yap1DN overexpression in CMs. b, c 3D confocal images of 144 hpf atria from control mosaic labeled (b) (creERT2-, TagBFP+) and Yap1DN mosaic overexpressing (c) (creERT2+, mCherry+) larvae; CM membranes shown in cyan (myl7:EGFP-Hsa.HRAS), control mosaic labeling in magenta (hspl70:LSL-NLSyap1DN, myh6:creERT2-), and Yap1DN mosaic labeling in yellow (hspl70:LSL-NLSyap1DN, myh6:creERT2+). d Percentage of elongating CMs from control labeled or Yap1DN overexpressing CMs (n = 8 hearts, 15 control labeled CMs; n = 8 hearts, 27 YAP1DN overexpressing CMs). e schematic of Yap1DN overexpression using the stable transgenic line. f Percentage of left, centered, and right oriented hearts at 30 hpf from uninjected, water injected, and cre mRNA injected hspl70:LSL-NLSyap1DN embryos (n = 10 uninjected controls, n = 24 water injected controls, and n = 23 cre mRNA injected embryos). g, h 3D airyscan images of 144 hpf atria from hspl70:LSL-NLSyap1DN control larvae (g) and hspl70:LSL-NLSyap1DN; myh6:CreERT2 siblings (h); CM membranes shown in cyan (myl7:EGFP-Hsa.HRAS); larvae were heat shocked once daily from 48 hpf and kept in Tamoxifen from 60 to 144 hpf, refreshed once daily. i, Percentage of elongating atrial CMs at 144 from hspl70:LSL-NLSyap1DN control larvae and hspl70:LSL-NLSyap1DN; myh6:CreERT2 siblings (n = 9 Cre- controls and n = 14 Cre+ siblings, two-tailed Mann-Whitney test). Error bars are mean ± SD.
Fig. 7
Fig. 7. Distinct mechanisms regulate atrial and ventricular muscle structure formation.
a, b 3D airyscan images of atria from homozygous wild-type siblings and wwtr1 mutants at 124 hpf; CM membranes shown in cyan (myl7:EGFP-Hsa.HRAS). c Percentage of elongating atrial CMs in 124 hpf homozygous wild-type siblings and wwtr1 mutants (n = 11 wild types, n = 9 mutants; each data point represents one heart; two-tailed Mann-Whitney test). Error bars are mean ± SD. dg 2D confocal planes of ventricles from 72 hpf larvae treated from 35 to 72 hpf with DMSO, K-975, IWR-1, or Rac1 inhibitor; CM membranes shown in cyan (myl7:EGFP-Hsa.HRAS) and nuclei in yellow (myl7:H2B-mScarlet). h Number of trabecular units in 72 hpf larvae treated from 35 to 72 hpf with DMSO, K-975, IWR-1, or Rac1 inhibitor (n = 5 DMSO, n = 7 K-975, n = 8 IWR-1, n = 6 Rac1 inhibitor; each data point represents one heart; ordinary one-way ANOVA with Dunnett’s multiple comparison test); red arrows point to elongating CMs; white asterisks indicate trabecular units. Error bars are mean ± SD. i Schematic summarizing the cellular and molecular processes involved in ventricular (left) and atrial (right) wall morphogenesis (manually rendered using Adobe Illustrator).

References

    1. Sedmera, D., Pexieder, T., Vuillemin, M., Thompson, R. P. & Anderson, R. H. Developmental patterning of the myocardium. Anat. Rec.258, 319–337 (2000). - PubMed
    1. Staudt, D. & Stainier, D. Uncovering the molecular and cellular mechanisms of heart development using the zebrafish. Annu Rev. Genet46, 397–418 (2012). - PMC - PubMed
    1. Wu, T.-J. et al. Role of pectinate muscle bundles in the generation and maintenance of intra-atrial reentry. Circulation Res.83, 448–462 (1998). - PubMed
    1. Ho, S. Y., Anderson, R. H. & Sánchez-Quintana, D. Gross structure of the atriums: more than an anatomic curiosity? Pacing Clin. Electrophysiol.25, 342–350 (2002). - PubMed
    1. Dobrzynski, H. et al. Computer three-dimensional reconstruction of the sinoatrial node. Circulation111, 846–854 (2005). - PubMed

Publication types

Associated data