Meta-Analysis
. 2024 Sep 17;14(1):379.
doi: 10.1038/s41398-024-03088-3.

Endogenous mu-opioid modulation of social connection in humans: a systematic review and meta-analysis

Affiliations
Meta-Analysis

Endogenous mu-opioid modulation of social connection in humans: a systematic review and meta-analysis

Guro Løseth et al. Transl Psychiatry. .

Abstract

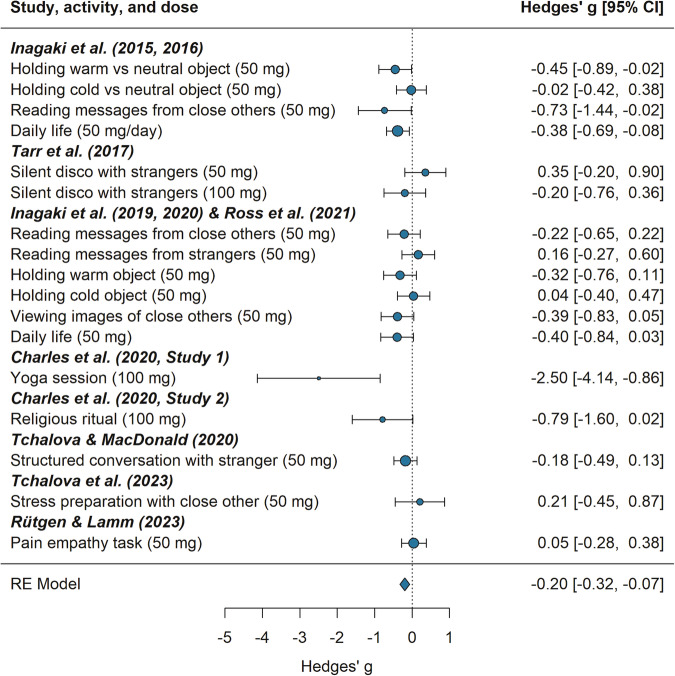
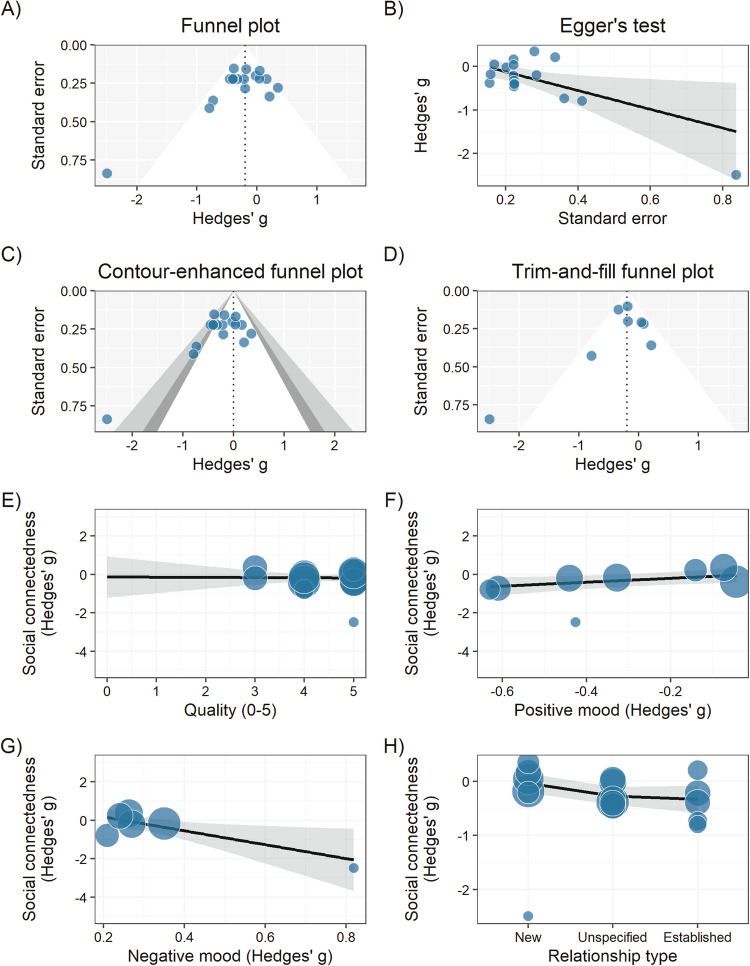
Social bonding, essential for health and survival in all social species, depends on mu-opioid signalling in non-human mammals. A growing neuroimaging and psychopharmacology literature also implicates mu-opioids in human social connectedness. To determine the role of mu-opioids for social connectedness in healthy humans, we conducted a preregistered ( https://osf.io/x5wmq ) multilevel random-effects meta-analysis of randomised double-blind placebo-controlled opioid antagonist studies. We included data from 8 publications and 2 unpublished projects, totalling 17 outcomes (N = 455) sourced from a final literature search in Web of Science, Scopus, PubMed and EMBASE on October 12, 2023, and through community contributions. All studies used naltrexone (25-100 mg) to block the mu-opioid system and measured social connectedness by self-report. Opioid antagonism slightly reduced feelings of social connectedness (Hedges' g [95% CI) = -0.20] [-0.32, -0.07]. Results were highly consistent within and between studies (I2 = 23%). However, there was some indication of bias in favour of larger effects among smaller studies (Egger's test: B = -2.16, SE = 0.93, z = -2.33, p = 0.02), and publication bias analysis indicated that the effect of naltrexone might be overestimated. The results clearly demonstrate that intact mu-opioid signalling is not essential for experiencing social connectedness, as robust feelings of connectedness are evident even during full pharmacological mu-opioid blockade. Nevertheless, antagonism reduced measures of social connection, consistent with a modulatory role of mu-opioids for human social connectedness. The modest effect size relative to findings in non-human animals, could be related to differences in measurement (subjective human responses versus behavioural/motivation indices in animals), species specific neural mechanisms, or naltrexone effects on other opioid receptor subtypes. In sum, these results help explain how mu-opioid dysregulation and social disconnection can contribute to disability, and conversely-how social connection can buffer risk of ill health.


Conflict of interest statement

The authors declare no competing interests.

Figures

Fig. 1
Fig. 1. Forest plot.
Hedges’ g is the effect size and indicates the standardised mean difference in social connectedness between the naltrexone and placebo conditions. Circles indicate individual study effects and error bars indicate their corresponding 95% confidence intervals. The diamond indicates the average effect size and corresponding 95% confidence interval obtained with the three-level random-effects meta-analysis. Negative effect sizes indicate lower social connectedness after administration of naltrexone than after administration of placebo. The vertical dotted line indicates an effect size of Hedges’ g = 0 (i.e., no difference in social connectedness between the naltrexone and placebo conditions).
Fig. 2
Fig. 2. Small-study effects and meta-regressions.
In all plots, Hedges’ g is the effect size and indicates the standardised mean difference between the naltrexone and placebo conditions in ratings of social connectedness (AE), positive mood, and negative mood (F, G). Negative effect sizes indicate lower social connectedness/positive mood/negative mood after administration of naltrexone compared to placebo. A Funnel plot. The vertical dotted line indicates the average effect size of g = −0.20 obtained with multilevel random-effects meta-analysis. White shading indicates the 95% confidence interval (CI) around this average effect size at various levels of precision (i.e., standard error). B Egger’s test. Meta-regression assessing the relationship between effect size and precision. The medium grey band is the 95% confidence band around the solid black regression line. C Contour-enhanced funnel plot. The vertical dotted line indicates an effect size of g = 0 (i.e., no difference in social connectedness between the naltrexone and placebo conditions). White, dark grey and medium grey shading indicates the 90%, 95%, and 99% CI (respectively) around this null-effect at various levels of precision. D Trim-and-fill funnel plot. Because the trim-and-fill method has not been generalised to multilevel random-effects meta-analysis, this method was applied to aggregated study effect sizes. Effect sizes within studies were aggregated in R using the aggregate function from the metafor package [50]. The vertical dotted line indicates the adjusted average effect size of g = −0.20 obtained with the trim-and-fill method. White shading indicates the 95% CI around this adjusted average effect size at various levels of precision. Circles indicate aggregated observed effect sizes. EG Meta-regressions assessing predictors of the effect of naltrexone (vs placebo) on social connectedness. These predictors include (E) study quality as assessed with the Jadad Scale (possible range = 0–5) [53]; (F) the effect of naltrexone (vs placebo) on positive mood; (G) the effect of naltrexone (vs placebo) on negative mood; and (H) the likely type of relationships (new, unspecified or established) considered by participants when rating their feelings of social connectedness. The medium grey band represents the 95% confidence interval around the solid black regression line. Individual effect sizes are scaled according to their relative weight in each model, with larger circles indicating greater relative weight.

Similar articles

References

    1. Noah Snyder-Mackler et al. Social determinants of health and survival in humans and other animals. Science 368, eaax9553 (2020). 10.1126/science.aax9553. - PMC - PubMed
    1. House JS, Landis KR, Umberson D. Social relationships and health. Science. 1988;241:540–5. - PubMed
    1. Helgeson VS. Social support and quality of life. Qual Life Res. 2003;12:25–31. - PubMed
    1. Holt-Lunstad J, Smith TB, Layton JB. Social relationships and mortality risk: a meta-analytic review. PLoS Med. 2010;7:e1000316. - PMC - PubMed
    1. Young LJ, Wang Z. The neurobiology of pair bonding. Nat Neurosci. 2004;7:1048–54. - PubMed

MeSH terms

LinkOut - more resources