Observational Study
. 2024 Sep 17;15(1):8167.
doi: 10.1038/s41467-024-52283-9.

DNA Methylation signatures underpinning blood neutrophil to lymphocyte ratio during first week of human life

Affiliations
Observational Study

DNA Methylation signatures underpinning blood neutrophil to lymphocyte ratio during first week of human life

David Martino et al. Nat Commun. .

Abstract

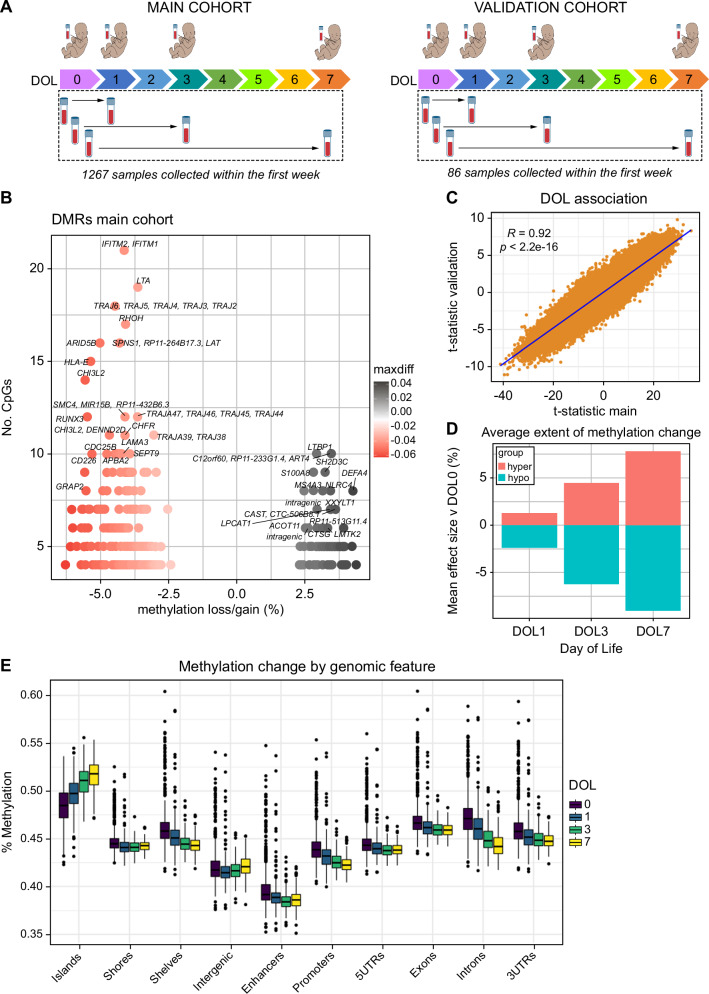
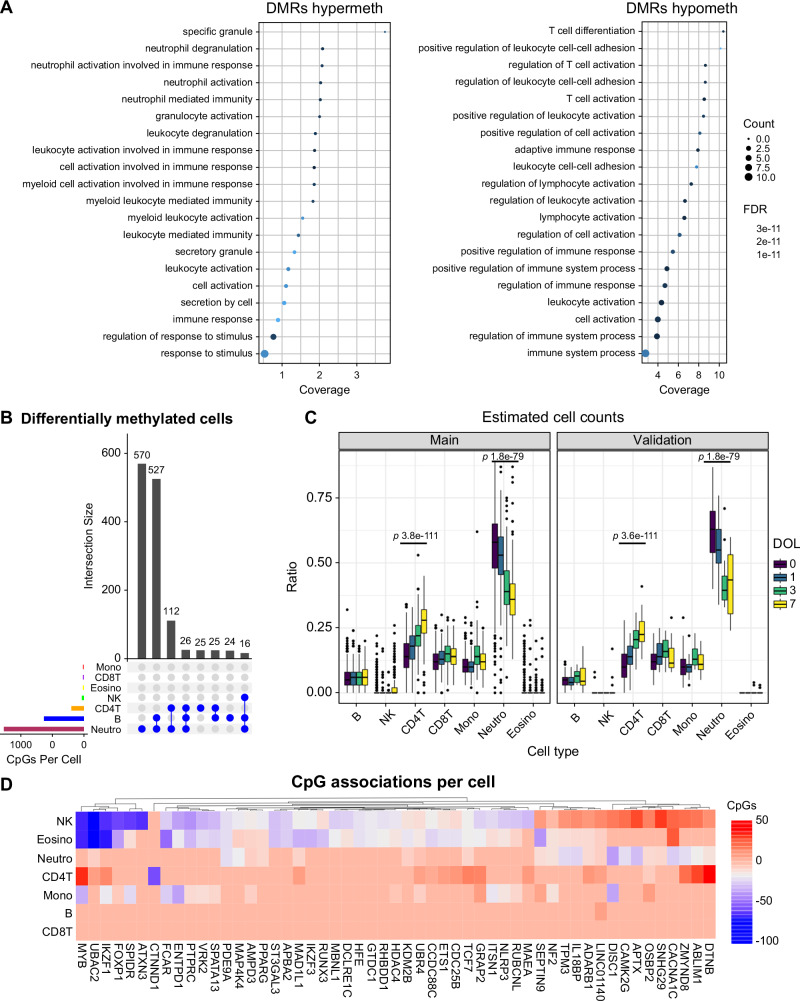
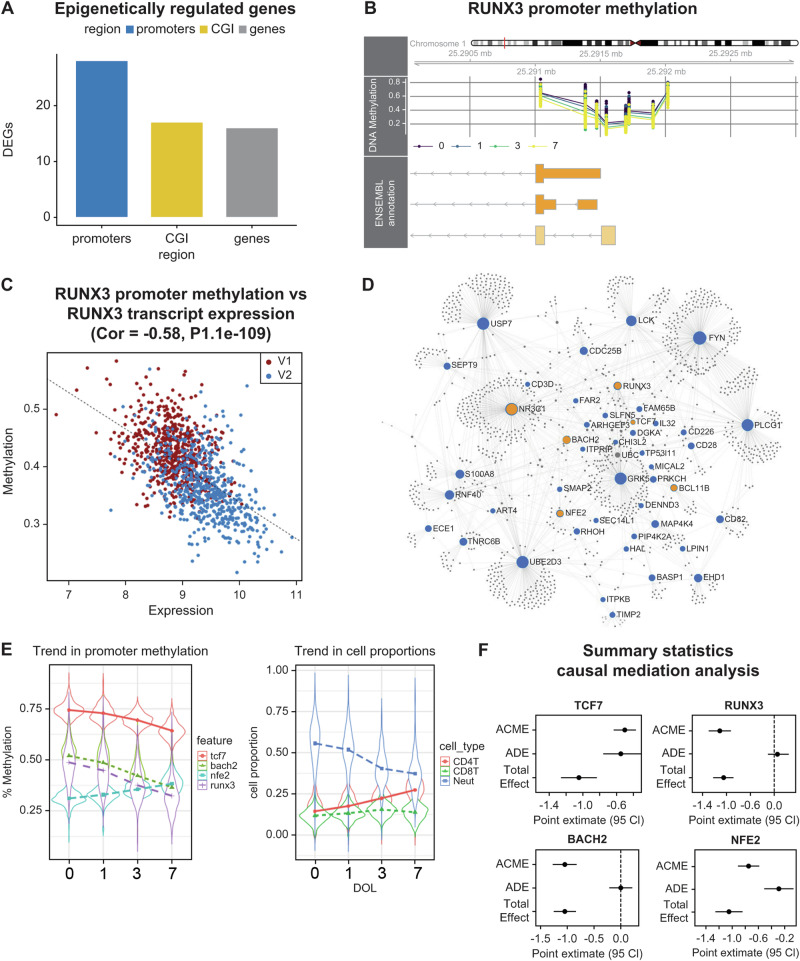
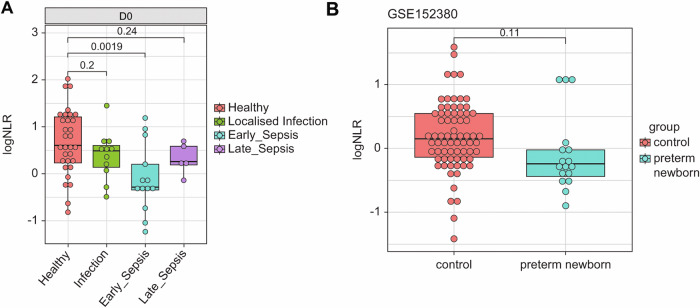
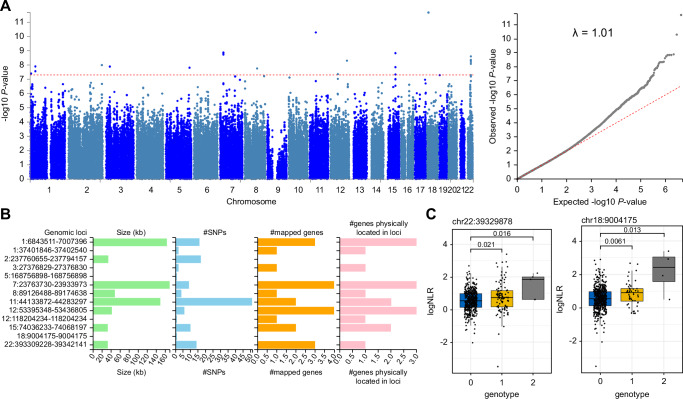
Understanding of newborn immune ontogeny in the first week of life will enable age-appropriate strategies for safeguarding vulnerable newborns against infectious diseases. Here we conducted an observational study exploring the immunological profile of infants longitudinally throughout their first week of life. Our Expanded Program on Immunization - Human Immunology Project Consortium (EPIC-HIPC) studies the epigenetic regulation of systemic immunity using small volumes of peripheral blood samples collected from West African neonates on days of life (DOL) 0, 1, 3, and 7. Genome-wide DNA methylation and single nucleotide polymorphism markers are examined alongside matched transcriptomic and flow cytometric data. Integrative analysis reveals that a core network of transcription factors mediates dynamic shifts in neutrophil-to-lymphocyte ratios (NLR), which are underpinned by cell-type specific methylation patterns in the two cell types. Genetic variants are associated with lower NLRs at birth, and healthy newborns with lower NLRs at birth are more likely to subsequently develop sepsis. These findings provide valuable insights into the early-life determinants of immune system development.


Conflict of interest statement

OL is the inventor of patents helped by Boston Children’s Hospital relating to vaccine adjuvants (EP3709998A1) and human in vitro systems that model responses to immunomodulators and vaccines (e.g., US20150152385A1). Hi is an advisor to GlaxoSmithKline (GSK) and Hillevax and a cofounder of and advisor to Ovax Inc. The remaining authors declare no competing interests.

Figures

Fig. 1
Fig. 1. Genome-wide analysis of DNA methylation in peripheral blood samples shows rapid changes in the first week of life.
A Overview of study design and sample collection from each day of life (DOL). B Volcano plot of differentially methylated regions significantly associated with DOL. The X-axis represents the average methylation change from DOL0-7, and the y-axis shows the number of CpGs within each region, which is a function of region size. C Correlation of t-test statistics for DOL regression model between main and validation cohorts. Each point is an individual observation from n = 308,655 data points measured in both cohorts. The solid line indicates the linear regression fit for DOL. A two-sided P-value for Pearson’s correlation coefficient (R) is shown. D Cross-sectional analyses of mean effect size (% methylation) at each time point, stratified by hypermethylation (gain) or hypomethylation (loss). E Methylation ratios expressed as percentage (y-axis) for DOL associated CpGs stratified by genomic feature (x-axis). Boxplots show the median and interquartile range (IQR, 25th-75th percentile). Whiskers extend to the most extreme data points within 1.5 times the IQR from the box hinges (the 25th and 75th percentiles). Points outside this range are considered outliers and are plotted individually). UTR = untranslated region.Total n = 1267 samples.
Fig. 2
Fig. 2. Differentially methylated cell type analysis reveals enrichment in neutrophils and lymphocyte populations.
A Dotchart of gene ontology enrichment analysis of the DOL ontogeny signature highlighting significantly enriched pathways. B Upset plot showing counts of shared and unique differentially methylated CpGs among blood cell populations from DMCT analysis. C Deconvoluted whole blood cellular ratios inferred from DNA methylation profiles. Boxplots show the median and interquartile range (IQR, 25th-75th percentile). Whiskers extend to the most extreme data points within 1.5 times the IQR from the box hinges (the 25th and 75th percentiles). Points outside this range are considered outliers and are plotted individually). P-values are one-way repeated measures ANOVA. D Heatmap visualization of the number of CpG associations per cell for the top 50 ranked genes. Positive associations are shown in red, and negative associations in blue. *** = P < 0.001, repeated measures ANOVA. Total n = 1267 samples.
Fig. 3
Fig. 3. Integrative analysis of newborn DNA methylation and transcriptomic changes in the main cohort.
A Number of differentially expressed genes (DEG) correlated with day of life associated with differentially methylated regions in each genomic context. B Visualization of RUNX3 promoter methylation levels measured on the main cohort. Average methylation ratios are shown on the y-axis colored by day of life (0, 1, 3, and 7). Each point on the plot is a CpG dinucleotide. Their relative position to RUNX3 promoter isoforms is shown in the orange boxes. C Pearson’s correlation between RUNX3 promoter methylation and gene expression. Data points are colored according to visit number (V1 = day of life 0; V2 = day of life 1, or 3, or 7). D First-order protein-protein interaction network from InnateDB. Key transcription factors are colored in yellow, blue nodes are seed nodes from the list of epigenetically regulated genes, and gray nodes are interactors. Interactions between nodes are denoted by edge lines. E Violin plots showing average changes in transcription factor promoter methylation and cell proportions as a function of day of life (DOL). Plots show the median (white dot) and interquartile range (IQR), and the thin line extends to the most extreme data points within 1.5x IQR. Points outside this are considered outliers and plotted individually. The violin shape represents the probability density of the data. F Summary statistics from causal mediation analysis. Point estimates from mediation models are shown with 95% confidence intervals (CI). ACME=average causal mediation effect, ADE=average direct effect. Total n = 1265.
Fig. 4
Fig. 4. Lower Neutrophil to lymphocyte ratios at birth in term newborns who later developed sepsis and in preterm newborns.
A Median difference in epigenetic NLR at birth (D0) between infants that developed localized infection or clinical sepsis within the first seven days in the EPIC-002 cohort. Exact p-values by t-test. Total n = 54. B Difference in median epigenetic NLR from preterm and term (control) umbilical cord blood samples. Exact p-values by t test. Total n = 90. Boxplots show the median and interquartile range (IQR, 25th-75th percentile). Whiskers extend to the most extreme data points within 1.5 times the IQR from the box hinges (the 25th and 75th percentiles). Points outside this range are considered outliers and are plotted individually).
Fig. 5
Fig. 5. Genome-wide association analysis of baseline NLR trait in African newborns from the main cohort.
A GWAS summary statistics for linear regression under the additive genetic model with genome-wide significance threshold is shown in red (left panel). The quantile-quantile plot of P-values with genomic inflation score (right panel). B Thirteen genomic-risk loci were identified from GWAS summary statistics using the FUMA GWAS tool. Genomic location is shown on the y-axis with region size, number of SNPs and mapped genes shown for each region. C Median difference in log NLR shown as a function of genotype for two top-ranked SNPs on Chromosome 22 (left panel) and Chromosome 18 (right panel). Exact P-values are shown using the Wilcox test. Boxplots show the median and interquartile range (IQR, 25th-75th percentile). Whiskers extend to the most extreme data points within 1.5 times the IQR from the box hinges (the 25th and 75th percentiles). Points outside this range are considered outliers and are plotted individually). Genotype codes indicate the presence of a minor allele of the SNP variant; 0 = homozygous major allele, 1 = hemizygous, 2 = homozygous minor allele. Total n = 557.

Similar articles

Cited by

References

    1. Collaborators, G. B. D. C. O. D. Global, regional, and national age-sex-specific mortality for 282 causes of death in 195 countries and territories, 1980-2017: a systematic analysis for the Global Burden of disease study 2017. Lancet392, 1736–1788 (2018). - PMC - PubMed
    1. Oza, S., Cousens, S. N. & Lawn, J. E. Estimation of daily risk of neonatal death, including the day of birth, in 186 countries in 2013: a vital-registration and modelling-based study. Lancet Glob. Health2, e635–e644 (2014). - PubMed
    1. Fleischmann-Struzek, C. et al. The global burden of paediatric and neonatal sepsis: a systematic review. Lancet Respir. Med.6, 223–230 (2018). - PubMed
    1. Collins, A., Weitkamp, J.-H. & Wynn, J. L. Why are preterm newborns at increased risk of infection? Arch. Dis. Child. Fetal Neonatal Ed.103, F391–F394 (2018). - PMC - PubMed
    1. Kollmann, T. R., Marchant, A. & Way, S. S. Vaccination strategies to enhance immunity in neonates. Science368, 612–615 (2020). - PMC - PubMed

Publication types

Associated data