. 2024 Sep 17;15(1):8171.
doi: 10.1038/s41467-024-52522-z.

Quantifiable blood TCR repertoire components associate with immune aging

Affiliations

Quantifiable blood TCR repertoire components associate with immune aging

Jing Hu et al. Nat Commun. .

Abstract

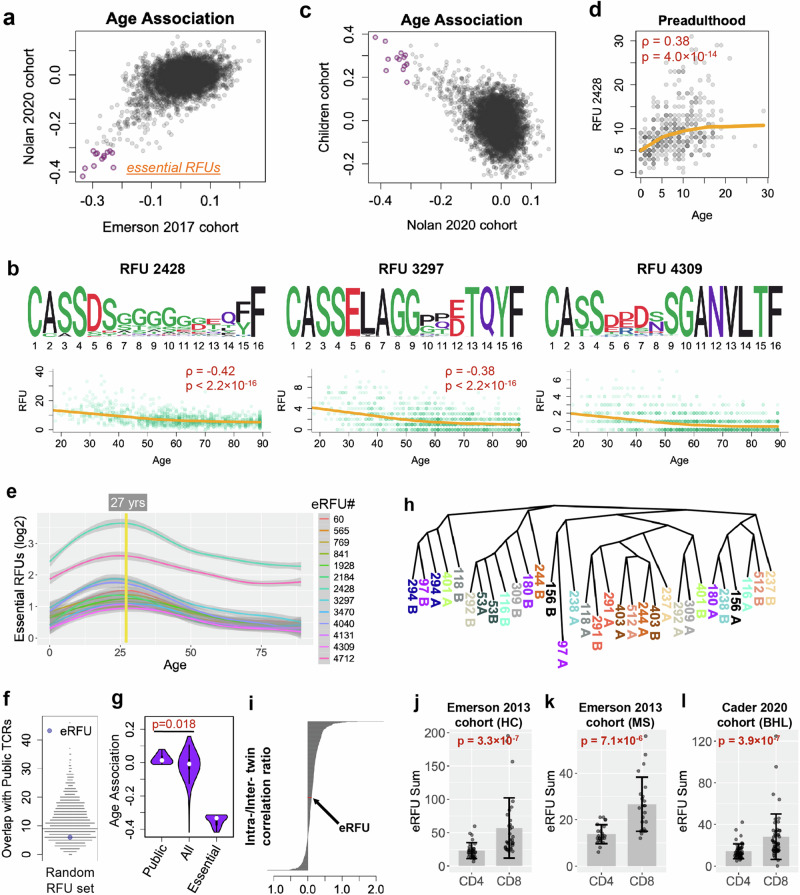
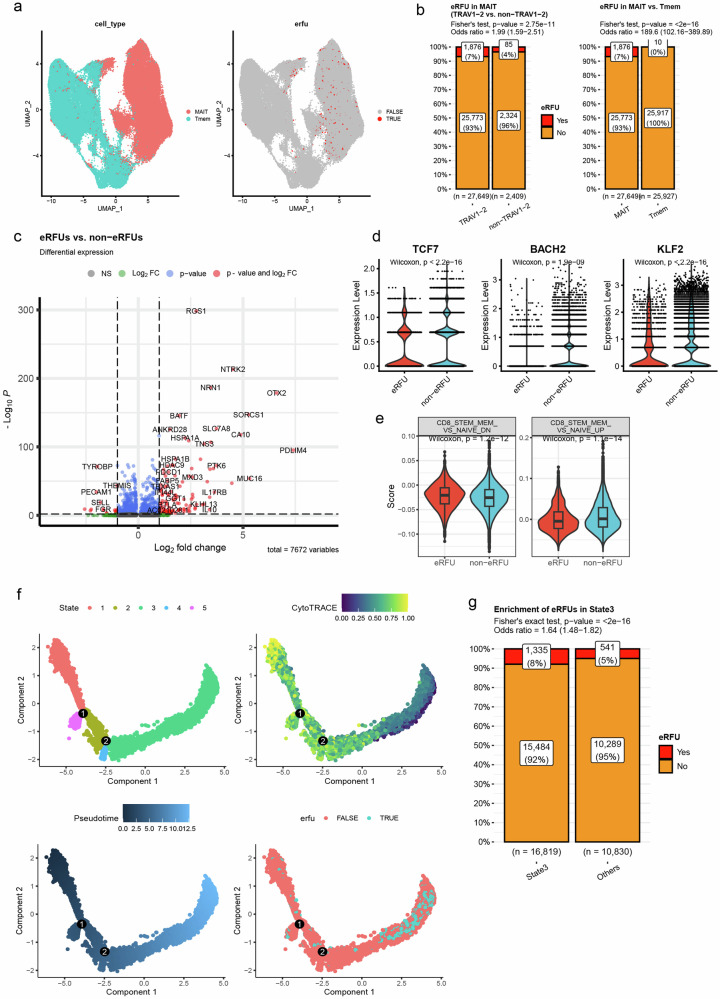
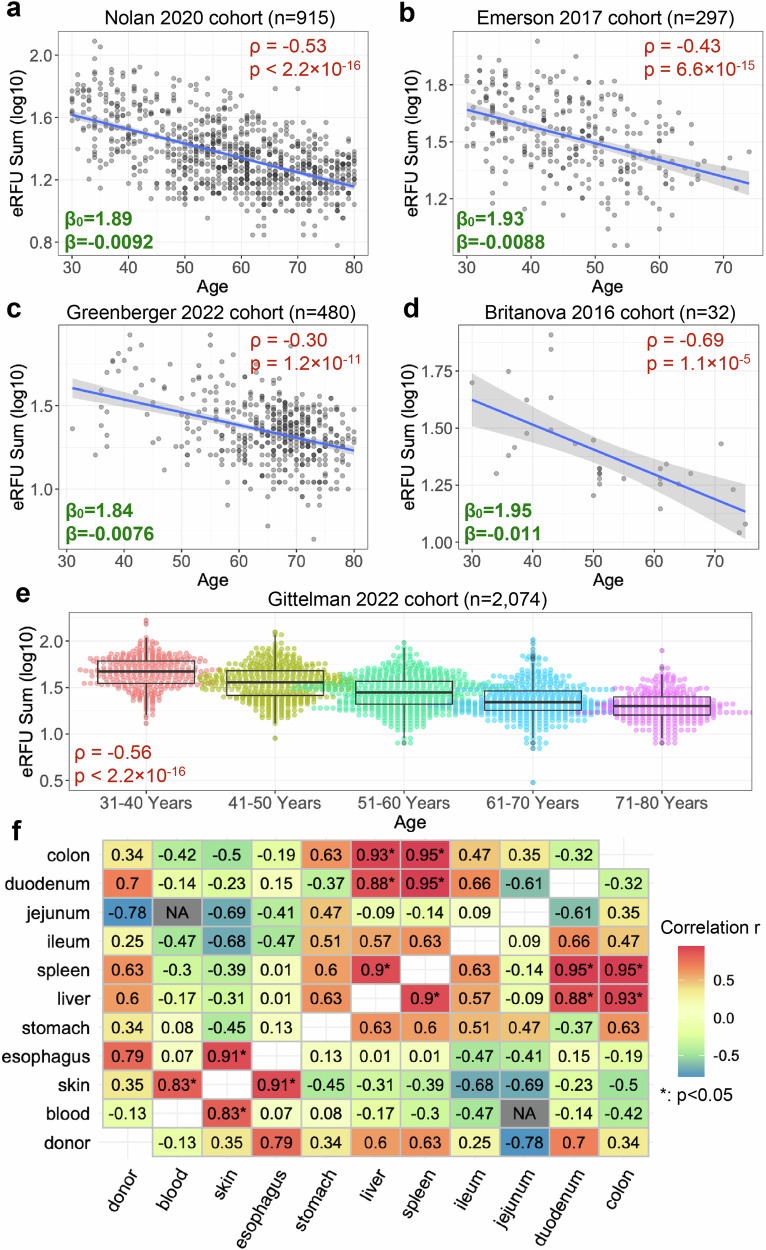
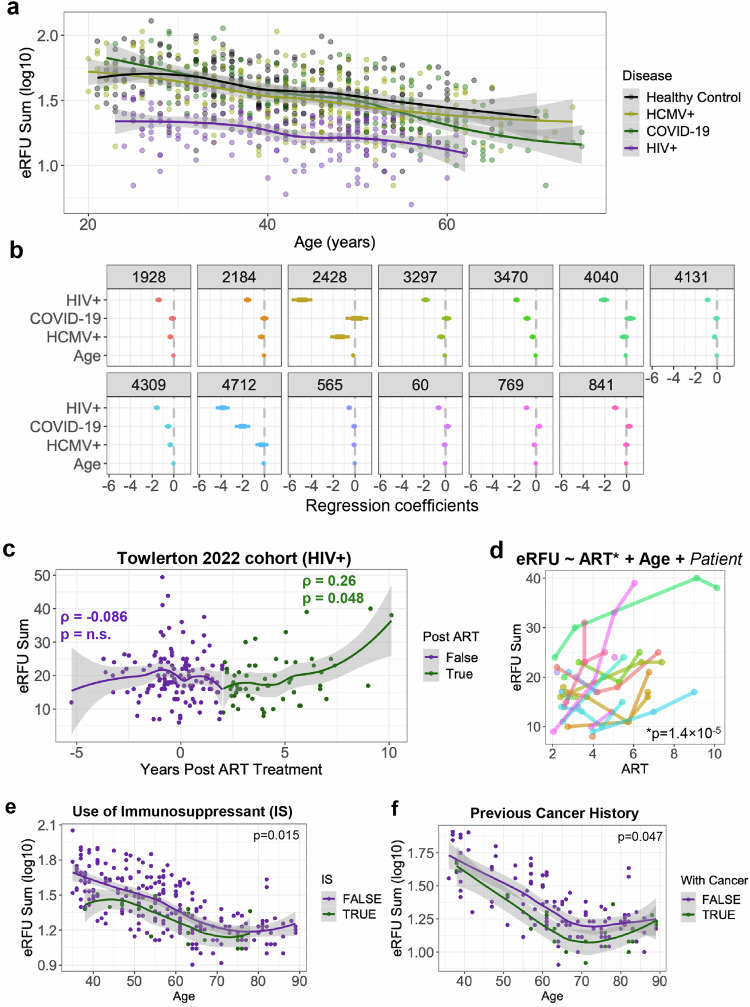
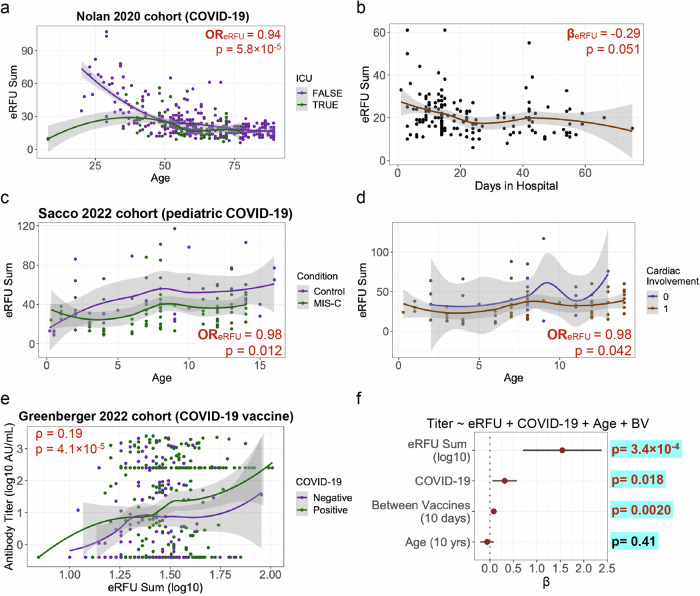
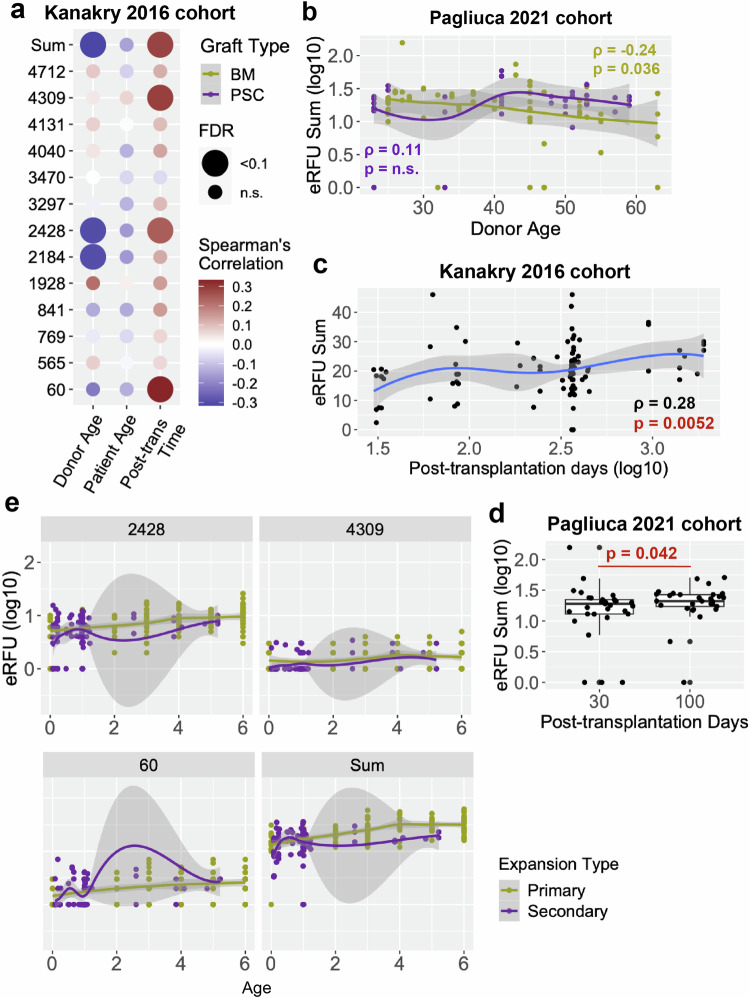
T cell senescence alters the homeostasis of distinct T cell populations and results in decayed adaptive immune protection in older individuals, but a link between aging and dynamic T cell clone changes has not been made. Here, using a newly developed computational framework, Repertoire Functional Units (RFU), we investigate over 6500 publicly available TCR repertoire sequencing samples from multiple human cohorts and identify age-associated RFUs consistently across different cohorts. Quantification of RFU reduction with aging reveals accelerated loss under immunosuppressive conditions. Systematic analysis of age-associated RFUs in clinical samples manifests a potential link between these RFUs and improved clinical outcomes, such as lower ICU admission and reduced risk of complications, during acute viral infections. Finally, patients receiving bone marrow transplantation show a secondary expansion of the age-associated clones upon stem cell transfer from younger donors. Together, our results suggest the existence of a 'TCR clock' that could reflect the immune functions in aging populations.


Conflict of interest statement

The authors declare no competing interest.

Figures

Fig. 1
Fig. 1. Identification and characterization of age-associated essential RFUs (eRFUs).
a Scatter plot showing the aligned age associations calculated from two large sample cohorts. Selection criteria of eRFUs were described in the main text. RFUs were defined by mapping the top 10,000 most abundant TCR clones in a repertoire to the embedding space. Statistical significance was evaluated using two-sided Spearman’s correlation test, with FDR corrected using the Benjamini-Hochberg approach. b Sequence logo plot paired with scatter plot showing the direct age association for 3 eRFUs. c Scatter plot showing the anti-aligned age associations from one adult and one childhood cohort, with eRFUs labeled with red circles. d Positive age association of a selected eRFU in the childhood cohort. Statistical significance of the association in b and d was evaluated using two-sided Spearman’s correlation test, with FDR corrected using the Benjamini-Hochberg approach. e Smoothed lines showing dynamic changes with age for all 13 eRFUs. The shaded areas show 95% confidence intervals, which were calculated using 95% standard error estimated by Loess polynomial fitting. f Beeswarm plot showing the distribution of overlaps of public TCRs with each of 1000 random RFU set. eRFU was colored in purple. g) Violin plots comparing age associations for 3 groups of RFUs. Statistical significance was estimated with one-way ANOVA. h Neighbor joining tree showing the relationships between pairs of twins with distance matrix calculated using the 13 eRFUs. i) Barplot showing the ratio of intra-/inter- twin associations of random RFU sets or eRFU. Associations were calculated as Spearman’s correlation using RFU as markers between a pair of individuals. jl Boxplots showing enrichment of eRFUs into CD4 or CD8 subsets in 3 independent adult cohorts. Data are presented as mean values  ±  SD. Statistical significance was evaluated using two-sided Wilcoxon rank sum test. Source data are provided as a Source Data file.
Fig. 2
Fig. 2. MAIT signatures and differentiation status of eRFU cells.
a UMAP plot showing the distribution of MAIT or memory T cells in the gene expression space (left) and the distribution of eRFU expressing T cells on the UMAP (right). b Percentage plots for eRFU expressing T cells enrichment in TRAV1-2 vs non-TRAV1-2 (left) T cell subsets or in MAIT vs Tmem (right). Statistical significance was evaluated using two-sided Fisher’s exact test. c Volcano plot showing the differentially expressed genes between eRFU and non-eRFU cells. Statistical significance was evaluated using two-sided Wilcoxon rank sum test, with FDR corrected using the Benjamini-Hochberg approach. Red color marks absolute log2 fold change greater than 1. Blue color indicates statistical significance at FDR = 0.05. d Violin plot showing the distributions of three putative T cell stemness markers. e Violin plot showing the distribution of two scores measuring the signature genes that either down- (left) or up- (right) regulated in CD8 stem memory cells vs naïve CD8 T cells. Statistical significance of the difference in d and e was evaluated using two-sided Wilcoxon rank sum test. f Monocle pseudotime trajectory plot of all the MAIT cells with direction of differentiation determined by CytoTRACE, where lower value indicates higher differentiation status. g Percentage plot showing eRFU cells enrichment in state 3. Statistical significance was evaluated using two-sided Fisher’s exact test. Source data are provided as a Source Data file.
Fig. 3
Fig. 3. Quantification of eRFU loss with age in adult cohorts.
ad Regression analysis of eRFU sum on age in four different adult cohorts. All individuals are within the range of 30 to 80 years. The solid lines denote linear regression fits between eRFU sum and age. The shaded areas show 95% confidence intervals, which were calculated using 1.96 standard deviation estimated from the model. Top right text boxes show the Spearman’s correlation and p values between eRFU sum and age. e Association of eRFU sum with age group information. All box plots display the median, interquartile range (IQR), whiskers extending up to 1.5 times the IQR, and individual data points representing the minimum and maximum values. Two-sided Spearman’s correlation test was applied to evaluate statistical significance. The p-values in a and e are less than 2.2 × 1016 and are denoted as < 2.2 × 1016. f Heatmap showing correlation of eRFU sums between a pair of tissue samples collected from 10 patients (postmortem). Statistical significance was evaluated using two-sided Pearson’s correlation test. Source data are provided as a Source Data file.
Fig. 4
Fig. 4. eRFUs are decreased in patients under immunosuppressive conditions.
a Scatter plot showing eRFU loss with age in different patient groups. b Coefficient plot for all 13 eRFUs from linear regression with age and viral infection categories as covariates. c eRFU sum dynamics pre- or post- ART treatment. Color change marks 2-year post ART. Two-sided Spearman’s correlation test was implemented to estimate statistical significance. d Dynamics of eRFU sum post ART treatment for each patient. Statistical significance was estimated using linear mixed effect model. eRFU dynamics with age stratified by the use of immunosuppressant (e) or existence of past cancer diagnosis (f). Statistical significance was estimated by logistic regression controlled for age. The shaded areas in a, c, e and f show 95% confidence intervals. Source data are provided as a Source Data file.
Fig. 5
Fig. 5. Clinical impacts of eRFUs in COVID-19 patients.
a Trending of eRFU sum with age stratified by ICU admission status. Odds ratio and p value were estimated using logistic regression controlled for patient age. b eRFU sum trending with days in hospital. Linear regression controlled for age was used to estimate the impact of eRFU sum and p value. eRFU sum over age among pediatric COVID-19 patients stratified by disease groups: healthy control vs MIS-C (c) or cardiac involvement status (d). Odds ratio and p value were estimated using logistic regression controlled for patient age. e Scatter plot showing the relationship between eRFU sum and antibody titer after COVID-19 vaccination in an adult cohort. Statistical significance was evaluated using two-sided Spearman’s correlation test for both groups combined. The shaded areas in ae show 95% confidence intervals. f Coefficient plot of linear regression analysis with related clinical covariates in the COVID-19 vaccination cohort. Estimate of coefficients are shown as points, and 95% confidence intervals as bars. Source data are provided as a Source Data file.
Fig. 6
Fig. 6. Secondary expansion of eRFUs after bone marrow transplantation.
a Heatmap showing the correlation of eRFU values and age (donors and recipient patients) or post-transplantation time (patients only). Statistical significance was evaluated using two-sided Spearman’s correlation test with FDR corrected using the Benjamini-Hochberg approach. Graft types included bone marrow (BM) or peripheral stem cell (PSC). b Association of eRFU sum with donor age stratified by graft types. c Increase of eRFU sum with post-transplantation days. For both (c) and (d), statistical significance was evaluated using two-sided Spearman’s correlation test. d Boxplot showing eRFU increase after transplantation in Pagiluca 2021 cohort. The boxplot display the median, interquartile range (IQR), whiskers extending up to 1.5 times the IQR, and individual data points representing the minimum and maximum values. One-sided Wilcoxon rank sum test was implemented to estimate statistical significance. e Comparisons of primary and secondary expansions of selected eRFU clones or the summed value. Age (x-axis) was measured in years. The shaded areas in b, c and e show 95% confidence intervals. Source data are provided as a Source Data file.

References

    1. Ventura, M. T., Casciaro, M., Gangemi, S. & Buquicchio, R. Immunosenescence in aging: between immune cells depletion and cytokines up-regulation. Clin. Mol. Allergy15, 21 (2017). - PMC - PubMed
    1. Shaw, A. C., Joshi, S., Greenwood, H., Panda, A. & Lord, J. M. Aging of the innate immune system. Curr. Opin. Immunol.22, 507–513 (2010). - PMC - PubMed
    1. Weiskopf, D., Weinberger, B. & Grubeck-Loebenstein, B. The aging of the immune system. Transpl. Int22, 1041–1050 (2009). - PubMed
    1. Chen, K. & Kolls, J. K. T cell-mediated host immune defenses in the lung. Annu Rev. Immunol.31, 605–633 (2013). - PMC - PubMed
    1. Farhood, B., Najafi, M. & Mortezaee, K. CD8(+) cytotoxic T lymphocytes in cancer immunotherapy: A review. J. Cell Physiol.234, 8509–8521 (2019). - PubMed

Publication types

Substances

LinkOut - more resources