. 2024 Sep 18;15(1):8176.
doi: 10.1038/s41467-024-52429-9.

Claustrum and dorsal endopiriform cortex complex cell-identity is determined by Nurr1 and regulates hallucinogenic-like states in mice

Affiliations

Claustrum and dorsal endopiriform cortex complex cell-identity is determined by Nurr1 and regulates hallucinogenic-like states in mice

Ioannis Mantas et al. Nat Commun. .

Abstract

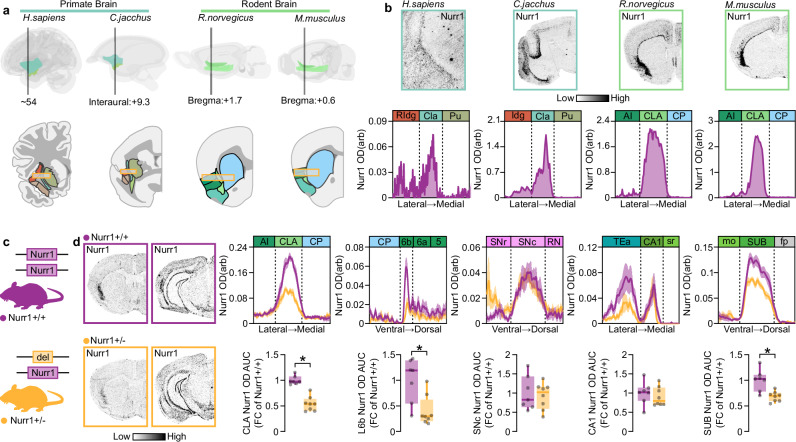
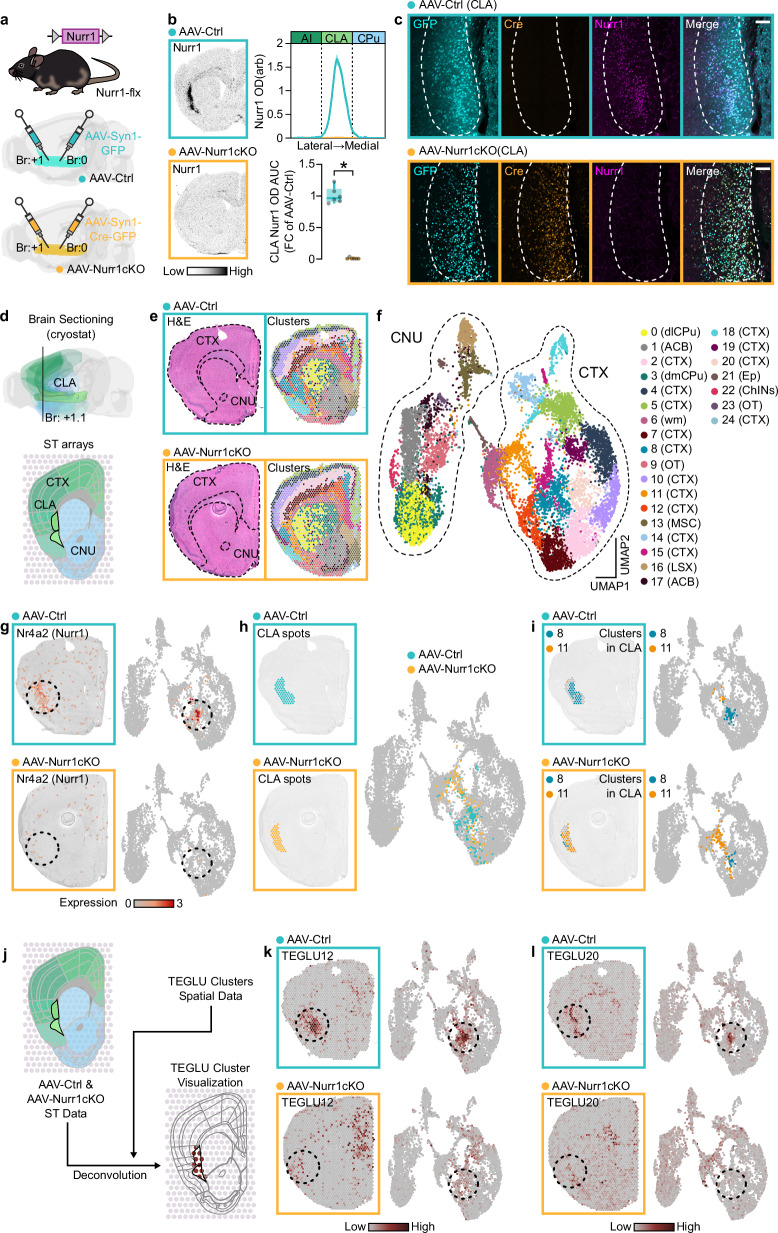
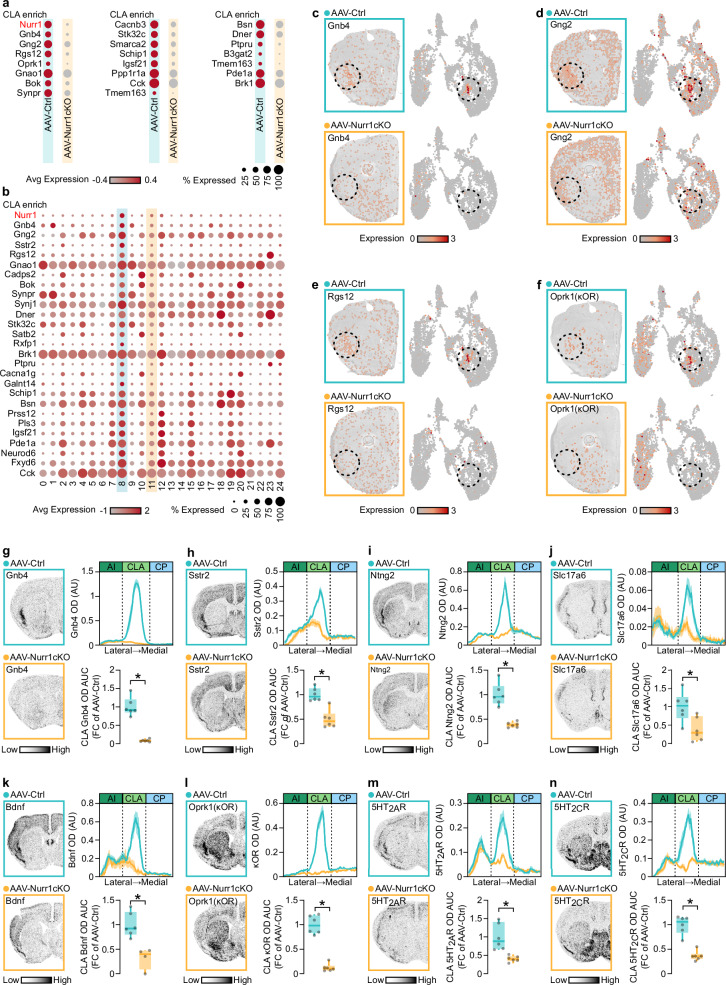
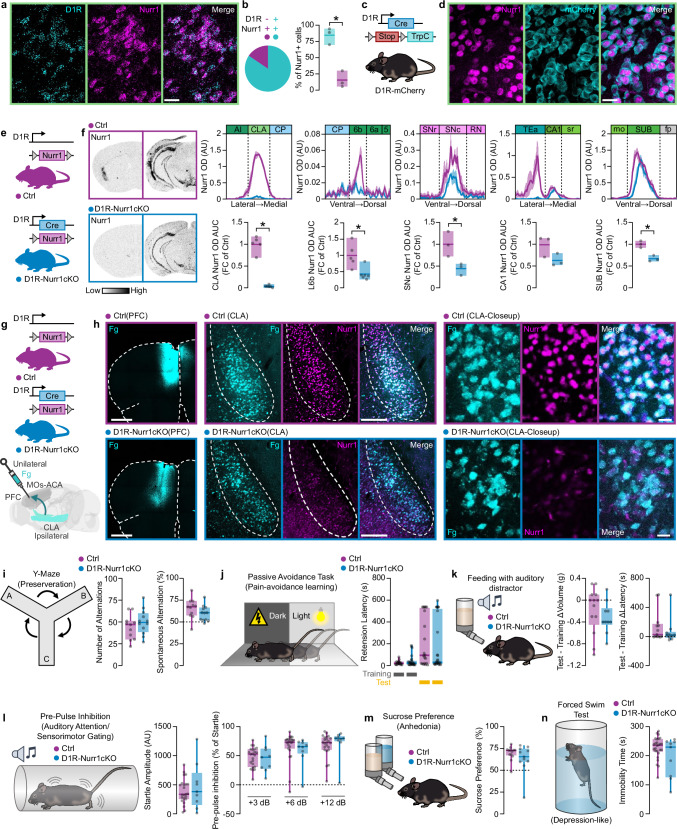
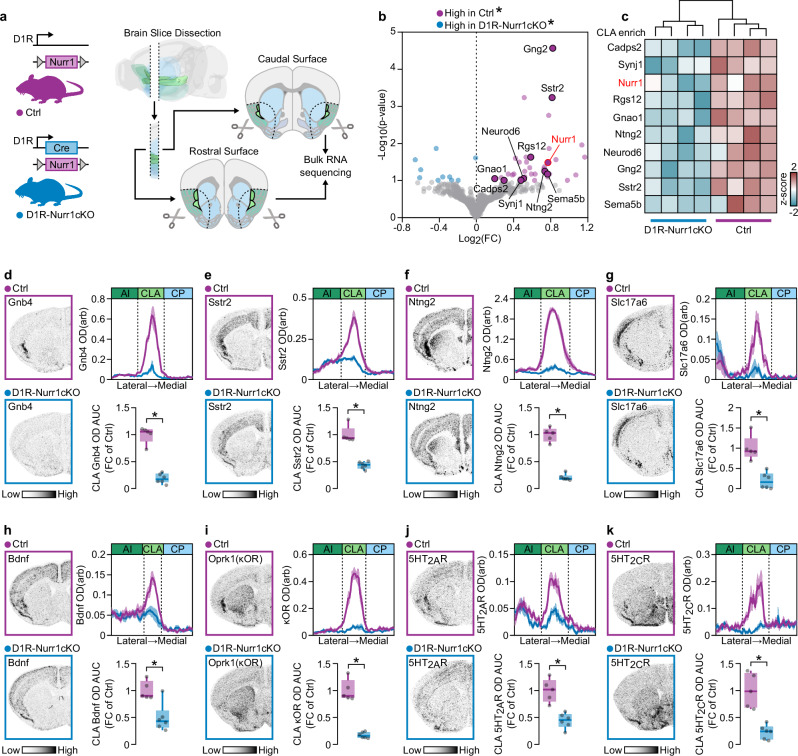
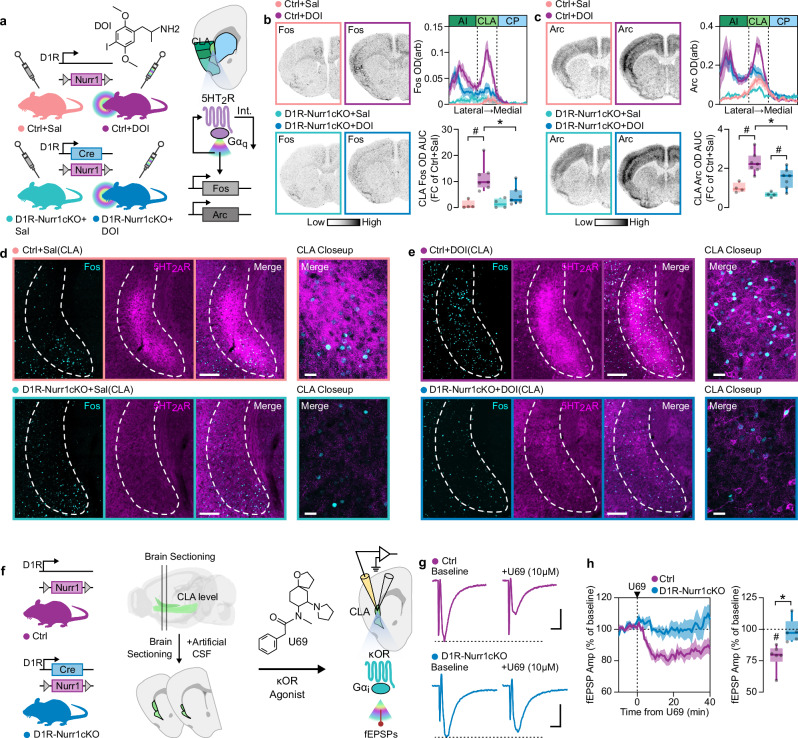
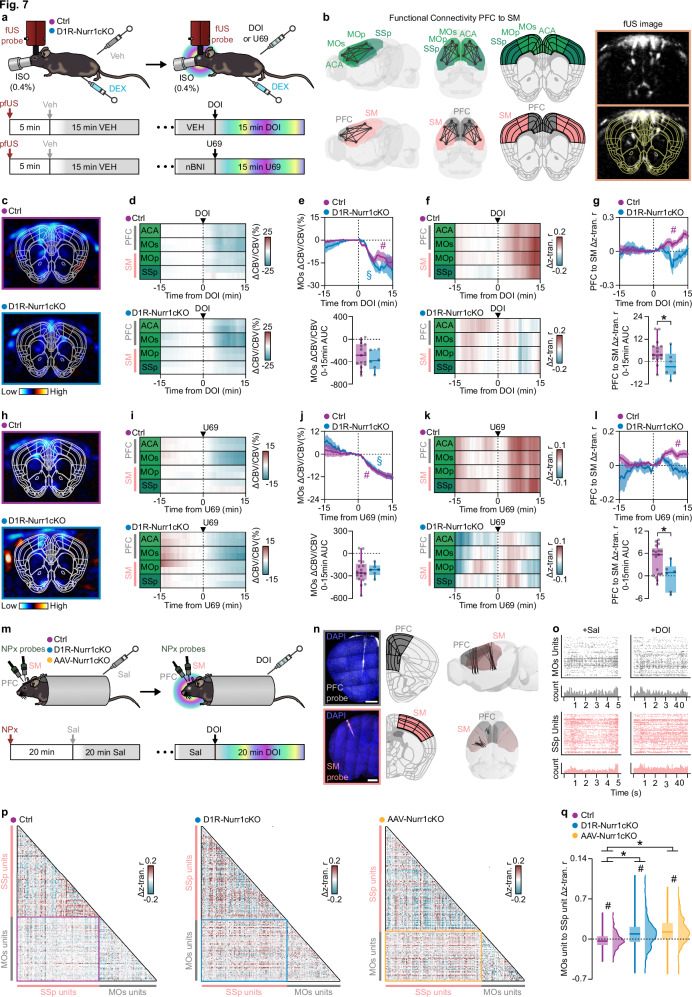
The Claustrum/dorsal endopiriform cortex complex (CLA) is an enigmatic brain region with extensive glutamatergic projections to multiple cortical areas. The transcription factor Nurr1 is highly expressed in the CLA, but its role in this region is not understood. By using conditional gene-targeted mice, we show that Nurr1 is a crucial regulator of CLA neuron identity. Although CLA neurons remain intact in the absence of Nurr1, the distinctive gene expression pattern in the CLA is abolished. CLA has been hypothesized to control hallucinations, but little is known of how the CLA responds to hallucinogens. After the deletion of Nurr1 in the CLA, both hallucinogen receptor expression and signaling are lost. Furthermore, functional ultrasound and Neuropixel electrophysiological recordings revealed that the hallucinogenic-receptor agonists' effects on functional connectivity between prefrontal and sensorimotor cortices are altered in Nurr1-ablated mice. Our findings suggest that Nurr1-targeted strategies provide additional avenues for functional studies of the CLA.


Conflict of interest statement

I.F. was employee at Boehringer Ingelheim Pharma GmbH & Co. KG during the time of the study. T.I. and B.H. are employees at Boehringer Ingelheim Pharma GmbH & Co. KG. S.F. and S.G. are scientific advisors to 10x Genomics Inc, which holds IP rights to the ST technology. S.G. holds 10x Genomics stocks. All other authors report no competing interests.

Figures

Fig. 1
Fig. 1. CLA Nurr1 mRNA is conserved among species and is dependent on Nurr1 gene dosage.
a Schematic depiction of the CLA in primate (H. sapiens and C. jacchus) and rodent (R. norvegicus and M. musculus) brain and its location between the Insular cortex and Striatum. Yellow framed rectangles are centered on CLA and delineate the axis across the average OD traces were measured b Nurr1 mRNA is enriched in human (H. sapiens), marmoset (C. jacchus), rat (R. norvegicus) and murine (M. musculus) CLA. c Illustration of Nurr1+/− mouse line. d Left: ISH autoradiographs showing Nurr1 mRNA at CLA and SNc level. Right: Line-graphs (upper) and boxplots (lower) showing the Nurr1 mRNA OD quantification in CLA, L6b, SNc, CA1, and SUB of Nurr1+/+ and Nurr1+/− mice (Nurr1+/+: n = 7, Nurr1+/−: n = 8; CLA: *p < 0.0001, L6b: *p = 0.0067, SUB: *p = 0.0021, Two-sided Unpaired t-test). Data in line-graphs are expressed as mean ± SEM. Boxplots show all data points, the 25th and 75th percentile (box), the median (center), and the maxima (whiskers). OD: optic density, arb: arbitrary units, RIdg: rostral dysgranular insular cortex, Idg: insular dysgranular cortex, Cla: human claustrum/dorsal endopiriform cortex complex/dorsal endopiriform cortex complex, Pu: putamen, AI: agranular insula, CLA: rodent claustrum/dorsal endopiriform cortex complex/dorsal endopiriform cortex complex, CP: caudoputamen, AUC: area under the curve, FC: fold change, L6b: cortical layer 6b, SNr: substantia nigra reticular part, SNc: substantia nigra compact part, RN: reticular nucleus, TEa: temporal association areas, sr: stratum radiatum of CA1, mo: molecular layer of dentate gyrus, SUB: subiculum, fp: posterior forceps of corpus callosum. ISH: in situ hybridization. Source data are provided as a Source Data file.
Fig. 2
Fig. 2. Nurr1 loss changes the transcriptomic profile of the CLA.
a Illustration of Nurr1-flx mouse line construct and the viral strategy of Nurr1 deletion in CLA. b ISH autoradiographs (left) and graphs (right) showing Nurr1 mRNA at the CLAs of AAV-Ctrl and AAV-Nurr1cKO mice. (AAV-Ctrl: n = 6, AAV-Nurr1cKO: n = 6; *p < 0.0001, Two-sided Unpaired t-test). c Immunofluorescence showing GFP, Cre, and Nurr1 expression in the CLAs of AAV-Ctrl (upper) and AAV-Nurr1cKO (lower) mice (scale-bar: 200 μm). d Illustration showing the level and the brain structures of the coronal sections that were hybridized on ST arrays. e H&E-stained brain sections (left) and on-tissue visualization of the 25 molecular clusters in AAV-Ctrl and AAV-Nurr1cKO brains (AAV-Ctrl: n = 3, AAV-Nurr1cKO: n = 3). f 2D-UMAP with a categorical color code to visualize the spots’ distribution in the 25 identified molecular clusters. g On-tissue (left) and 2D-UMAP (right) visualization of Nurr1 expression in AAV-Ctrl and AAV-Nurr1cKO sections. h On-tissue (left) and 2D-UMAP (right) visualization of the spots located in the CLA region from AAV-Ctrl and AAV-Nurr1cKO sections. i On-tissue (left) and 2D-UMAP (right) visualization of clusters 8 and 11 in CLA region from AAV-Ctrl and AAV-Nurr1cKO sections. j Schematic depiction of the deconvolution analysis using the dataset from Zeisel et al. 2018. k, l On-tissue (left) and 2D-UMAP (right) visualization of TEGLU12 (k) and TEGLU20 (l) from AAV-Ctrl and AAV-Nurr1cKO sections. Data in line-graphs are expressed as mean ± SEM. Boxplots show all data points, the 25th and 75th percentile (box), the median (center), and the maxima (whiskers). The dashed circle denotes the CLA region. AAV: adeno-associated virus, ISH: in situ hybridization, GFP: green fluorescent protein, OD: optic density, arb: arbitrary units, AI: agranular insula, CLA: claustrum/dorsal endopiriform cortex complex, CP: caudoputamen, AUC: area under the curve, FC: fold change, ST: spatial transcriptomics, CTX: cerebral cortex, CNU: cerebral nuclei, H&E: hematoxylin & eosin staining, dlCP: dorsolateral caudoputamen, dmCP: dorsomedial caudoputamen, ACB: nucleus accumbens, wm: white matter, OT: olfactory tubercle, MSC: medial septal complex, LSX: lateral septal complex, Ep: ependymal cells, ChINs: striatal cholinergic interneurons, TEGLU: telencephalon excitatory projecting neurons. Source data are provided as a Source Data file.
Fig. 3
Fig. 3. Loss of Nurr1 in CLA reduces the expression of CLA-enriched genes.
a Dot plot showing the expression of the differentially expressed CLA-enriched genes between AAV-Ctrl and AAV-Nurr1cKO CLA spots. b Dot plot showing the expression of the CLA-enriched genes that were differentially expressed in cluster 8. cf On-tissue (left) and 2D-UMAP (right) visualization of Gnb4 (c), Gng2 (d), Rgs12 (e), Oprk1 (κOR) (f) expression in AAV-Ctrl and AAV-Nurr1cKO sections. gn ISH autoradiographs (left) and graphs (right) showing Gnb4 (g), Sstr2 (h), Ntng2 (i), Slc17a6 (j), Bdnf (k), Oprk1 (κOR) (l), 5HT2AR (m) and 5HT2CR (n) mRNA at CLA of AAV-Ctrl and AAV-Nurr1cKO mice (AAV-Ctrl: n = 6, AAV-Nurr1cKO: n = 6, AAV-Nurr1cKO in k: n = 4; g: *p < 0.0001, h: *p = 0.0003, i: *p < 0.0001, j: *p = 0.0147, k: *p = 0.0022, l: *p < 0.0001, m: *p = 0.0027, n: *p < 0.0001, Two-sided Unpaired t-test). Data in line-graphs are expressed as mean ± SEM. Boxplots show all data points, the 25th and 75th percentile (box), the median (center), and the maxima (whiskers). The dashed circle denotes CLA region. Avg: average, CLA: claustrum/dorsal endopiriform cortex complex, OD: optic density, arb: arbitrary units, AI: agranular insula, CP: caudoputamen, AUC: area under the curve, FC: fold change, ISH: in situ hybridization. Source data are provided as a Source Data file.
Fig. 4
Fig. 4. Loss of Nurr1 in CLA does not affect claustrocortical projections.
a RNAscope images showing cells that co-express Nurr1 and D1R mRNA in murine CLA (scale-bar: 30 µm). b Pie-chart and bar-graph showing the percentage of Nurr1/D1R double-positive cells (*p = 0.0027, Two-sided Paired t-test). c Illustration of the D1R-mCherry mouse-line construct. d Immunofluorescent images showing Nurr1/TrpC double-positive cells in CLA (scale-bar: 30 µm). e Illustration of D1R-Nurr1cKO mouse strain construct. f Left: ISH autoradiographs showing Nurr1 mRNA at CLA and SNc level. Right: Line-graphs (upper) and bar graphs (lower) showing the Nurr1 mRNA OD quantification in CLA, L6b, SNc, CA1, and SUB (Ctrl-CLA and Ctrl-L6b: n = 5, D1R-Nurr1cKO-CLA and D1R-Nurr1cKO-L6b: n = 6, Ctrl-SNc, Ctrl-CA1, and Ctrl-SUB: n = 3, D1R-Nurr1cKO-SNc, D1R-Nurr1cKO-CA1, and D1R-Nurr1cKO-SUB: n = 3; CLA: *p < 0.0001, L6b: *p = 0.0002, SNc: *p = 0.0384, SUB: *p = 0.0055, Two-sided Unpaired t-test). g, h Illustration (g) and fluorescent images (h) showing unilateral retrograde tracing of CLA with Fg (left scale bar: 1 mm, central scale-bar: 200 µm, right scale-bar: 20 µm). in Illustration of behavioral task (left) and boxplots (right) showing mice’ performance at Y-maze (i) (Ctrl: n = 11, D1R-Nurr1cKO: n = 12), passive avoidance task (j) (Ctrl: n = 20, D1R-Nurr1cKO: n = 25), auditory destruction task auditory destruction task (k) (Ctrl: n = 13, D1R-Nurr1cKO: n = 10), pre-pulse inhibition task (l) (Ctrl: n = 23, D1R-Nurr1cKO: n = 9), sucrose preference task (m) (Ctrl: n = 13, D1R-Nurr1cKO: n = 11) and forced swim test (n) (Ctrl: n = 26, D1R-Nurr1cKO: n = 9). Data in line-graphs and bar graphs are expressed as mean ± SEM and mean ± minima/maxima respectively. Boxplots show all data points, the 25th and 75th percentile (box), the median (center), and the minima/maxima (whiskers). OD: optic density, arb: arbitrary units, AI: agranular insula, CLA: rodent claustrum/dorsal endopiriform cortex complex, CP: caudoputamen, AUC: area under the curve, FC: fold change, SNr: substantia nigra reticular part, SNc: substantia nigra compact part, RN: reticular nucleus, TEa: temporal association areas, sr: stratum radiatum of CA1, mo: molecular layer of dentate gyrus, SUB: subiculum, fp: posterior forceps of corpus callosum. ISH: in situ hybridization, MOs: secondary motor area, ACA: anterior cingulate area, Fg: fluorogold, rgAAV: retrograde adeno-associated virus, Tdt: tdtomato. Source data are provided as a Source Data file.
Fig. 5
Fig. 5. D1R-Nurr1cKO mice display reduced expression of CLA-enriched genes.
a Illustration of D1R-Nurr1cKO mouse strain construct (left) and the coronal brain levels that were dissected for bulk RNA sequencing (right). b Volcano plot showing the CLA-enriched genes that were significantly downregulated in D1R-Nurr1cKO mice (Ctrl: n = 4, D1R-Nurr1cKO: n = 4; *p-value adjusted < 0.1, Benjamini & Hochberg correction). c Heatmap showing the expression z-score of the CLA-enriched genes across the different samples. dk ISH autoradiographs (left) and graphs (right), showing Gnb4 (d), Sstr2 (e), Ntng2 (f), Slc17a6 (g), Bdnf (h), Oprk1 (κOR) (i), 5HT2AR (j) and 5HT2CR (k) mRNA at CLA of Ctrl and D1R-Nurr1cKO mice (Ctrl: n = 5, D1R-Nurr1cKO: n = 6; d: *p < 0.0001, e: *p < 0.0001, f: *p < 0.0001, g: *p = 0.0006, h: *p = 0.0046, i: *p < 0.0001, j: *p = 0.0006, k: *p = 0.0004, Two-sided Unpaired t-test). Data in line-graphs are expressed as mean ± SEM. Boxplots show all data points, the 25th and 75th percentile (box), the median (center), and the maxima (whiskers). OD: optic density, arb: arbitrary units, AI: agranular insula, CLA: claustrum/dorsal endopiriform cortex complex, CP: caudoputamen, AUC: area under the curve, FC: fold change, ISH: in situ hybridization. Source data are provided as a Source Data file.
Fig. 6
Fig. 6. D1R-Nurr1cKO display suppressed hallucinogen-receptor-induced effects in CLA.
a Illustration showing the DOI (8 mg/kg ip) administration experimental setup and the 5HT2R-mediated effects on the CLA, (upregulation of Fos and Arc, 5HT2R internalization). b ISH autoradiographs (Left) and graphs (Right) showing Fos mRNA in CLA of Ctrl and D1R-Nurr1cKO mice treated with DOI. (Ctrl+Sal: n = 4, Ctrl+DOI: n = 7, D1R-Nurr1cKO+Sal: n = 4, D1R-Nurr1cKO+DOI: n = 7; Two-way ANOVA, Genotype×Treatment: F(1,18) = 5.281, p = 0.0338; Ctrl vs D1R-Nurr1cKO: *p = 0.0045, Sal vs DOI: #p = 0.0006, Sidak’s post-hoc test). c ISH autoradiographs (Left) and graphs (Right) showing Arc mRNA in CLA of Ctrl and D1R-Nurr1cKO mice treated with DOI. (Ctrl+Sal: n = 4, Ctrl+DOI: n = 7, D1R-Nurr1cKO+Sal: n = 4, D1R-Nurr1cKO+DOI: n = 7; Two-way ANOVA, Genotype: F(1,18) = 8.667, p = 0.0087, Treatment: F(1,18) = 29.42, p < 0.0001; Ctrl vs D1R-Nurr1cKO: *p = 0.0061, Sal vs DOI: #p < 0.05, Sidak’s post-hoc test). d, e Fluorescent images showing the immunolabeling of 5HT2AR and Fos in CLA of Ctrl and D1R-Nurr1cKO mice treated with Sal (d) or DOI (e). f Illustration depicting the experimental procedure for recording fEPSPs following the application of the κOR agonist U69 (10 µM) in CLA sections, along with the proposed κOR-induced suppression of fEPSPs. g Representative current traces of extracellular fEPSP recording in CLA of Ctrl and D1-Nurr1cKO sections by using U69 (vertical scale-bar: 2 mV, horizontal scale-bar: 60 ms). h Line-graphs(left) and boxplots (right) showing the CLA fEPSP response of Ctrl and D1R-Nurr1cKO mice, after the application of U69. (*p = 0.008, Two-sided Unpaired t-test; #p < 0.05, Two-sided One-sample t-test, mean = 100). Data in line-graphs are expressed as mean ± SEM. Boxplots show all data points, the 25th and 75th percentile (box), the median (center), and the maxima (whiskers). DOI: 2,5-dimethoxy-4-iodoamphetamine, ip: intraperitoneal, CLA: claustrum/dorsal endopiriform cortex complex, Sal: saline, Int.: internalization, arb: arbitrary units, AUC: area under the curve, FC: fold change, U69: U-69,593, fEPSPs: field excitatory postsynaptic potentials. Source data are provided as a Source Data file.
Fig. 7
Fig. 7. Changes in cortical functional connectivity in response to hallucinogen receptor agonists are influenced by Nurr1 deletion in the CLA.
a, b Illustrations and coronal fUS image showing the experimental procedure the brain regions that were selected (PFC: gray, SM: pink). ce pfUS images (c), heatmaps (d), and graphs (e) showing CBV changes after DOI (p = 0.4181, Two-sided Unpaired t-test). f Heatmaps showing the mean Δz-transformed-r-coefficient (correlation with the rest cortical regions) over time after DOI. g Graphs showing the Δz-transformed r-coefficient over time between PFC and SM (*p = 0.045, Two-sided Unpaired t-test). hj pfUS images (h), heatmaps (i), and graphs (j) showing CBV changes after U69 (p = 0.7830, Two-sided Unpaired t-test). k Heatmaps showing the mean Δz-transformed r-coefficient (correlation with the rest cortical regions) change over time after U69. l Graphs showing the Δz-transformed r-coefficient change over time between PFC and SM regions (*p = 0.0282, Two-sided Unpaired t-test). m Illustration showing the neuropixel probe electrophysiological recordings. n Fluorescent images and 3d brain reconstruction showing the course of neuropixel probes in the brain (scale-bars: 1 mm). o Represenative raster plots showing the firing rate of the units after DOI. p Representative correlograms showing the Δz-transformed r-coefficient between the units of the two neuropixel probes (MOs and SSp probe). q Boxplot/violin plot graph showing the MOs to SSp unit Δz-transformed r-coefficient (Ctrl mice: n = 3, Ctrl-units: n = 281, D1R-Nurr1cKO-mice: n = 4, D1R-Nurr1cKO-units: n = 387, AAV-Nurr1cKO-mice: n = 3, AAV-Nurr1cKO-units: n = 351; #p < 0.001, Two-sided One-sample Wilcoxon signed rank test, mean = 0; Kruskal–Wallis test, p < 0.0001, *p < 0.01, Dunn’s post-hoc test). Data in line-graphs are expressed as mean ± SEM (Ctrl: DOI/U69 vs baseline: #FDR < 0.05, D1R-Nurr1cKO: DOI/U69 vs baseline: §FDR < 0.05). Animal numbers in all pfUS graphs: Ctrl: n = 15, D1R-Nurr1cKO: n = 6. Boxplots show all data points, the 25th and 75th percentile (box), the median (center), and the maxima (whiskers). pfUS: pharmacological functional ultrasound, fc: functional connectivity, DOI: 2,5-dimethoxy-4-iodoamphetamine, U69: U-69,593, ISO: isoflurane, DEX: dexmedetomidine, Veh: vehicle, SSp: primary somatosensory area, ACA: anterior cingulate area, MOs: secondary motor area, MOp: primary motor area, PFC: prefrontal cortex, SM: sensorimotor areas, CBV: cerebral blood volume, AUC: area under the curve, NPx: neuropixel, Sal: saline. Source data are provided as a Source Data file.

References

    1. Mathur, B. N. The claustrum in review. Front. Syst. Neurosci.8, 48 (2014). - PMC - PubMed
    1. Peng, H. et al. Morphological diversity of single neurons in molecularly defined cell types. Nature598, 174–181 (2021). - PMC - PubMed
    1. Crick, F. C. & Koch, C. What is the function of the claustrum? Philos. Trans. R. Soc. B Biol. Sci.360, 1271 (2005). - PMC - PubMed
    1. Smith, J. B., Lee, A. K. & Jackson, J. The claustrum. Curr. Biol.30, R1401–R1406 (2020). - PubMed
    1. Stewart, B. W. et al. Pathological claustrum activity drives aberrant cognitive network processing in human chronic pain. Curr. Biol.34, 1953–1966.e6 (2024). - PubMed

Publication types

MeSH terms

Substances

Associated data