. 2024 Sep 17;15(1):8164.
doi: 10.1038/s41467-024-52465-5.

Mixed effects of honey bees on pollination function in the Tibetan alpine grasslands

Affiliations

Mixed effects of honey bees on pollination function in the Tibetan alpine grasslands

Lin-Lin Wang et al. Nat Commun. .

Abstract

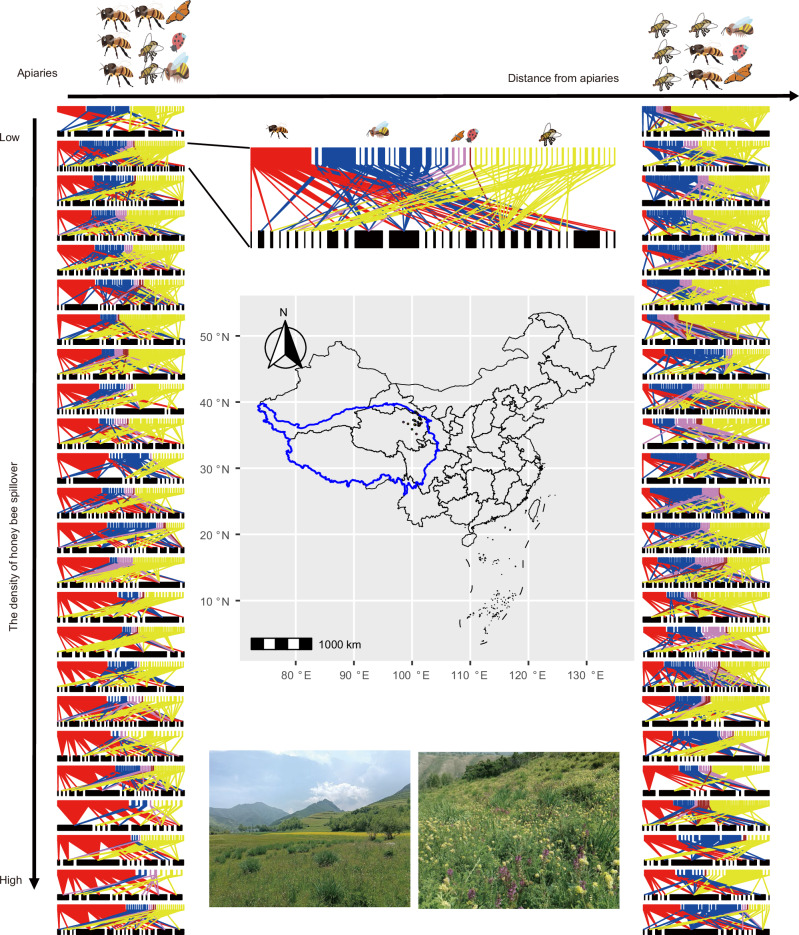
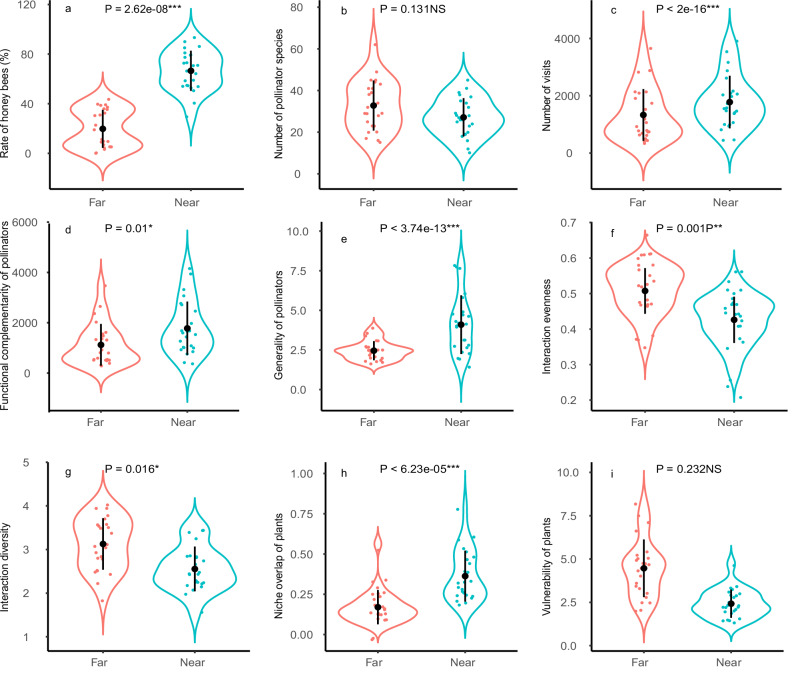
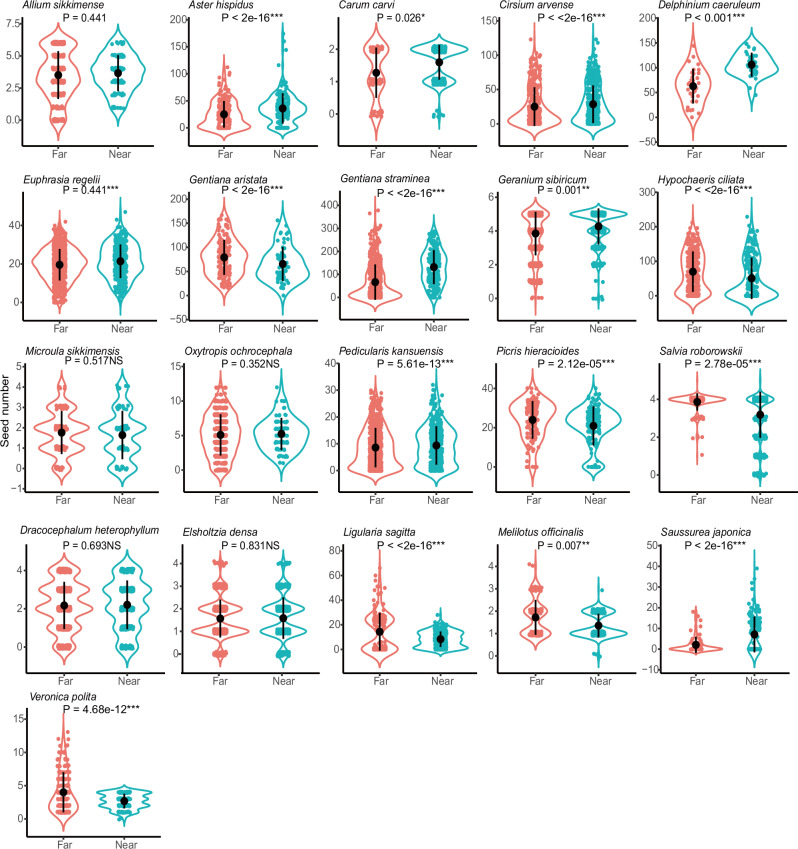
The global expansion of domesticated plant and animal species has profoundly impacted biodiversity and ecosystem functions. However, the spillover effect of non-native honey bees from mass-flowering crops into adjacent natural vegetation on pollination function within plant communities remains unclear. To address this, we conduct field experiments to investigate the ecological impacts of honey bees (Apis mellifera) and a mass-flowering crop (Brassica rapa var. oleifera) on pollinator communities, plant-pollinator interactions, and reproductive performance of wild plants in 48 pollinator-limited alpine grasslands. Our findings indicate that the transition of dominant pollinators from flies to honey bees enhances visitation fidelity of pollinator species and reconfigures pollination interactions due to an increase in competition between honey bees and native pollinator species. Additionally, honey bees increase, decrease or do not alter plant reproductive success, depending on the plant species. Here, we report the mixed effects of honey bees on pollination function in pollinator-limited alpine grasslands.


Conflict of interest statement

The authors declare no competing interests.

Figures

Fig. 1
Fig. 1. The study sites and pollination networks.
Forty-eight typical alpine grassland communities were selected with 24 bee-near sites (high honey bee density: 1 km) and 24 bee-far sites (low honey bee density: 3 km) for the apiaries in the northeastern of the Tibetan alpine grasslands (blue line). At each of the 24 bee-near (From top to bottom, they are HCXSK, JFWJ, MCTC, QJK, TETC, MQCC, HKZ, XGJ, DYC, CHSC, ZLDS, XGLJ, XGL, XQC, ELJ, STL, TET, HCX, STMC, HMYDJ, GZH, QHHLB, QHHMSKZ, SJC) and bee-far sites (From top to bottom, they are BYC, DKEC, QSZFLZ, HSW, HMYDY, STMXG, DT, JFWY, MJWC, HEG, XLWTY, FXK, YLMDD, ET, LHC, BG, BHXZXXX, RYS, MDJ, XZC, XLWTC, BDK, NGZ, YGZ), we collected one pollination network between July and August 2021 or 2022. The networks consist of interactions between plants (bottom bar) and pollinators (top bar). The full size of 48 networks includes in the Supplementary Fig. 8. The width of the links shows the number of pollination visits. There is a clear dominance of honey bees in the bee-near plots regardless of the rapeseed cover. Pollinator groups are depicted by colors: red, honey bees; blue, native bees; violet, butterflies and moths; brown, beetles; yellow, flies. All insect images belong to Pixabay (https://pixabay.com) under the Creative Commons Zero (CC0) license. The sample map was made using R 4.2.2. The base map was obtained from the Alibaba Cloud Data Visualization platform (http://datav.aliyun.com/portal/school/atlas/area_selector). Two landscape photos of the two plant communities © Lin-Lin Wang. Source data are provided as a Source Data file.
Fig. 2
Fig. 2. The effects of honey bees on pollinator communities and pollination interactions.
The metrics (mean ± SD) include the rate of honey bees (a), the number of pollinator species (b), and the number of visits (c), functional complementarity of pollinator species (d), generality of pollinator species (e), interaction evenness (f), interaction diversity (g), niche overlap of plant species (h), vulnerability of plant species (i) in the bee-near and bee-far plots. Differences in metrics were estimated by two-sided linear mixed models (LMMs) or generalized linear mixed models (GLMMs). Error bars represent standard deviation. N = 24 independent replicates. Single points show source data. * P < 0.05, * * P  < 0.01, * * * P < 0.001, NS not significant. Further statistical values are shown in Supplementary Table 6. Source data are provided as a Source Data file.
Fig. 3
Fig. 3. Community-level plant reproduction success.
Differences in seed number (mean ± SD) of 21 pollinator-dependent plant species in the bee-near and bee-far plots were estimated by two-sided generalized linear mixed models (GLMMs) with Poisson distributions. Plant species and individuals were assigned as random effects and were nested. Plants at bee-near plots produced more seed number across 21 flowering plant species (GLMM: t = −39.663, P < 0.001, further statistical values are shown in Supplementary Tables 7). To test the effects of honey bee density (bee-near and bee-far) on seed number of each plant species, we fitted two-sided GLMMs with Poisson distributions. Plant individuals were assigned as random effects. Nine plant species (Carum carvi, Cirsium arvense, Saussurea japonica, Delphinium caeruleum, Gentiana stramine, Pedicularis kansuensis, Aster hispidus, Euphrasia regelii, and Geranium sibiricum) showed significant higher seed number at the bee-near plots (GLMMs: all P < 0.05, further statistical values are shown in Supplementary Tables 11). The number of seeds of five species (Allium sikkimense, Dracocephalum heterophyllum, Oxytropis ochrocephala, Elsholtzia densa, and Microula sikkimensis) did not differ significantly between the bee-far and bee-near plots (GLMMs: all P > 0.05, further statistical values are shown in Supplementary Tables 11). The number of seeds of seven ecological and functional specialized plant species (Melilotus officinalis, Salvia roborowskii, Gentiana aristate, Hypochaeris ciliat, Ligularia sagitta, Picris hieracioides, and Veronica polita) was decreased in bee-near plots compared with those in bee-far plots (GLMMs: all P < 0.05, further statistical values are shown in Supplementary Tables 11). Error bars represent standard deviation. Single points show source data. * P < 0.05, * * P < 0.01, * * * P < 0.001, NS not significant. Source data are provided as a Source Data file.

References

    1. Ollerton, J., Winfree, R. & Tarrant, S. How many flowering plants are pollinated by animals? Oikos120, 321–326 (2011).
    1. IPBES. The assessment report of the Intergovernmental Science-Policy Platform on Biodiversity and Ecosystem Services on pollinators, pollination and food production. S.G. Potts, V. L. Imperatriz-Fonseca, and H. T. Ngo, (eds) (2016).
    1. Burkle, L. A., Marlin, J. C. & Knight, T. M. Plant-pollinator interactions over 120 years: loss of species, co-occurrence, and function. Science339, 1611–1615 (2013). - PubMed
    1. Zoller, L., Bennett, J. & Knight, T. M. Plant–pollinator network change across a century in the subarctic. Nat. Ecol. Evol.7, 102–112 (2023). - PubMed
    1. Aizen, M. A. et al. Global agricultural productivity is threatened by increasing pollinator dependence without a parallel increase in crop diversification. Glob. Change Biol.25, 3516–3527 (2019). - PMC - PubMed

Publication types

LinkOut - more resources